ABSTRACT
Venturi-type chemigation injectors are widely used due to their advantages: they do not require electric power and are cheap to operate. However, they also generate considerable energy losses which affect the pressure in the system. The correct characterization of these systems requires pressures to be correctly set at the inlet, injector and outlet points in relation to main and injected solution flows. These analytical relationships, as described in the International Organization for Standardization’s standard ISO 15873:2002, can be obtained theoretically, although it is recommended that the manufacturer should determine the real behavior of the injector by operational tests. These relationships should also be provided graphically in the form of nomograms in order to facilitate the association of the variables involved and the subsequent selection of a specific model or class and type of assembly. In order to make the right choice, it is also necessary to have precise information on the irrigation sub-units that it feeds and the grower’s fertilization program.
Key words:
Chemigation; Fertigation; Head losses; Nomography
RESUMEN
El inyector para quimigación tipo Venturi tiene ventajas que hacen que sea un dispositivo bastante utilizado; no requiere energía eléctrica y es económico. Por el contrario, genera pérdidas de energía elevadas, afectando a las presiones en la instalación. Para una correcta caracterización de estos equipos deben relacionarse las presiones en los puntos de entrada, salida e inyección con los caudales principales e inyectados. Estas relaciones analíticas, que las introduce la norma de la Organización Internacional de Normalización (ISO 15873:2002), se pueden obtener de forma teórica; aunque es más recomendable que el fabricante establezca mediante ensayos de funcionamiento, el comportamiento real del inyector. Es oportuno que estas relaciones se proporcionen gráficamente, en la forma de nomogramas, para facilitar la asociación de las variables implicadas y la posterior selección de un modelo o clase concretos bajo una tipología de montaje. Así, para que esta selección sea adecuada es necesario también el conocimiento preciso de las subunidades de riego que alimenta y el programa de fertilización de la explotación.
Palabras-llave:
Quimigación; Fertirrigación; Pérdidas de carga; Nomografía
INTRODUCTION
Venturi-type fertilizer injector systems, which do not require an external power source and have no moving parts, are robust and cheap to run. Small and medium-sized systems are widely used in chemigation (DIMITRIOS et al., 2014DIMITRIOS, B. et al. Effects of fertilization and salinity on weed flora in common bean (‘Phaseolus vulgaris’ L.) grown following organic or conventional cultural practices. Australian Journal of Crop Science, v. 8, n. 2, p. 178-182, 2014.) due to their ease of use and low cost (ARVIZA, 2001ARVIZA, J. Dispositivos para fertirrigación en sistemas de riego localizado. Vida Rural, n. 123, p. 34-40, 2001.).
Although they can add any type of agrochemicals to water, they are mostly used to add fertilizers to pressurized irrigation water (DARLI et al., 2014DALRI, A. B. et al. Entupimento de emissores enterrados sob a cultura da cana-de-açúcar após três anos de cultivo em condições fertirrigadas. Irriga, p. 62-71, 2014. Edição Especial.; KUMAR; RAJPUT; PATEL, 2012KUMAR, M.; RAJPUT, T. B. S.; PATEL, N. Effect of system pressure and solute concentration on fertilizer injection rate of a Venturi for fertigation. Indian Society of Agricultural Engineers, v. 49, p. 9-13, 2012.; MANTOVANI et al., 2013MANTOVANI, E. C. et al. Eficiência no uso da água de duas cultivares de batata-doce em resposta a diferentes lâminas de irrigação. Horticultura Brasileira, v. 31, n. 4, p. 602-606, 2013.; SOUZA et al., 2012SOUZA, T. R. de. et al. Dinâmica de nutrientes na solução do solo em pomar fertirrigado de citros. Pesquisa Agropecuária Brasileira, v. 47, n. 6, p. 846-854, 2012.), which is an advantageous fertigation system, being efficient and practical. However, they inevitably generate large pressure losses in the system (SUN; NIU, 2012SUN, Y.; NIU, W. Simulating the effects of structural parameters on the hydraulic performances of Venturi tube. Modelling and Simulation in Engineering, v. 1, p. 1-7, 2012.) of at least 30% of the inlet pressure (ARVIZA, 2001ARVIZA, J. Dispositivos para fertirrigación en sistemas de riego localizado. Vida Rural, n. 123, p. 34-40, 2001.).
ISO 15873:2002 (Irrigation Equipment. Differential Pressure Venturi Fertilizer Injectors) is the present reference standard for Venturi injectors (INTERNATIONAL ORGANIZATION FOR STANDARDIZATION, 2002INTERNATIONAL ORGANIZATION FOR STANDARDIZATION. Irrigation equipment differential pressure Venturi-type liquid additive injectors (ISO 15873:2002). Geneva, 2002. 7 p.). This basically descriptive standard defines the most important operating parameters: different types of assembly, material characteristics and resistance to corrosion, ultraviolet radiation, the tests that should be carried out, and the information to be supplied by the manufacturer. This last point may involve difficulties, as the manufacturer’s technical information is often incomplete.
Some manufacturers relate injected flow with inlet pressure and Venturi head loss or throat vacuum, while others provide tables that associate inlet and outlet pressures with main and injected flows, with references to the flow or pressure at the point where injection begins. Some show the evolution of the injected flow with the pressure difference between injector inlet and outlet for different inlet pressures (MANZANO JUAREZ, 2008MANZANO JUAREZ, J. Análisis del inyector Venturi y mejora de su instalación en los sistemas de riego localizado. 2008. 248 f. (Tesis Doctoral) - Departamento de Ingeniería Rural y Agroalimentaria, Universitat Politècnica de València, Valencia, 2008.), while others may give insufficient information on total head losses and flow relationships, since these can be consulted in the scientific literature (HAIJUN et al., 2013HAIJUN, Y. et al. Influence of optimization of structural parameters on injection performance of Venturi injector. Journal of Drainage and Irrigation Machinery Engineering, v. 8, p. 1-16, 2013.; MANZANO et al., 2015MANZANO, J. et al. Diseño y alternativas en la instalación de inyectores Venturi en riego localizado. Ciência Agronômica, v. 46, n. 2, p. 287-298, 2015.; SUN; NIU, 2012SUN, Y.; NIU, W. Simulating the effects of structural parameters on the hydraulic performances of Venturi tube. Modelling and Simulation in Engineering, v. 1, p. 1-7, 2012.).
There may also be problems with dimensions and diameters. The parameter normally used to identify models is the nominal inlet and outlet diameter, without specifying the respective internal diameters, the internal throat diameter or the connection with the fertilizer suction pipe. Key aspects, such as installation instructions and a description of accessories may be missing, and important information on the free surface level in the additive solution tank may not be given. The information provided is thus frequently poor, partial or confusing (MANZANO JUAREZ, 2008MANZANO JUAREZ, J. Análisis del inyector Venturi y mejora de su instalación en los sistemas de riego localizado. 2008. 248 f. (Tesis Doctoral) - Departamento de Ingeniería Rural y Agroalimentaria, Universitat Politècnica de València, Valencia, 2008.).
This paper describes a study of the complete characterization of a Venturi injector based on ISO 15873:2002, using theoretical relationships based on Bernoulli’s Theorem to determine the pressures at the points of inlet, injection and outlet of the main and injected flows, supported by nomograms or selection abacuses. Finally, a case study is described of two simulations of actual systems operated by commercial melon and tomato growers to facilitate the association of the variables involved and the subsequent selection of a specific model and type of assembly.
MATERIAL AND METHODS
The study was carried out in the Hydraulics and Irrigation Laboratory of the Universitat Politècnica de València at the Rural and Agrofood Engineering Department in Valencia, Spain (39º29′ N, 0º23′ W and 20 m) and based on ISO 15873:2002 (INTERNATIONAL ORGANIZATION FOR STANDARDIZATION, 2002INTERNATIONAL ORGANIZATION FOR STANDARDIZATION. Irrigation equipment differential pressure Venturi-type liquid additive injectors (ISO 15873:2002). Geneva, 2002. 7 p.). The Venturi injector parameters (inlet, injected and outlet flows, diameters and lengths of nozzle, suction pipe, throat and diffuser, and nozzle and diffuser angles) were defined by theoretical formulation and these relationships were then structured graphically for practical use.
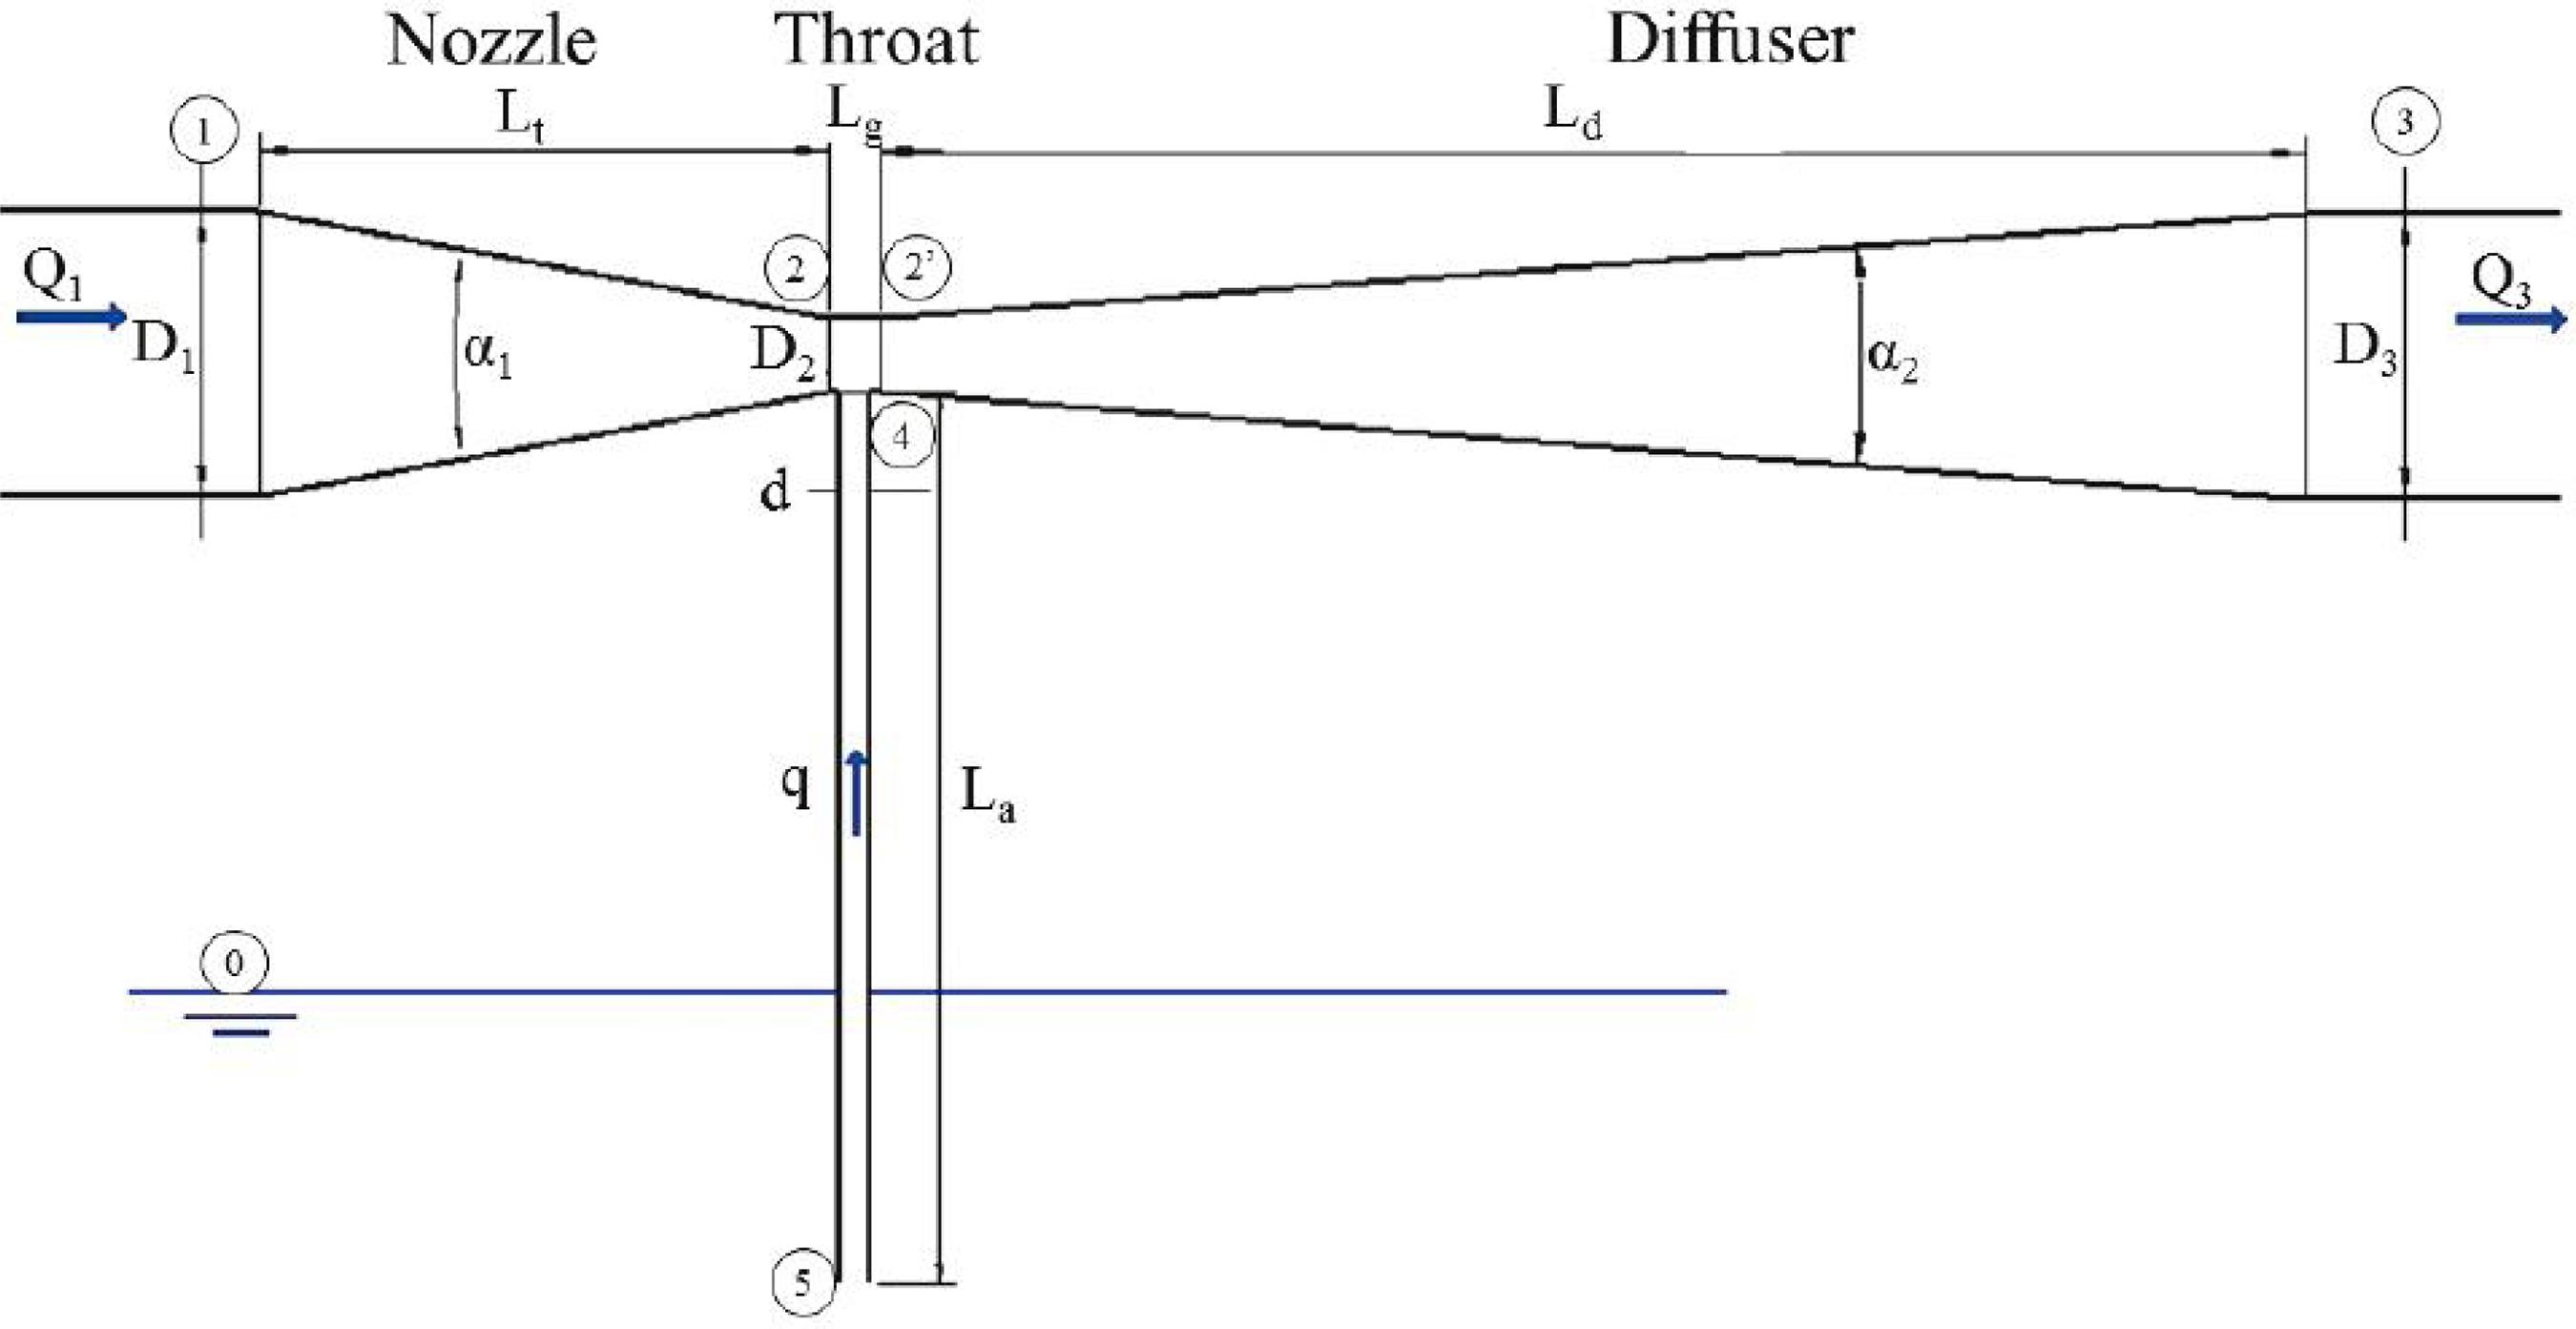
The theoretical formulation of the Venturi injector’s operating equations were directly based on the application of Bernoulli’s Theorem for a horizontal assembly (Figure 1).
Typical scheme of Venturi injector
Q1: inlet flow; q: injection flow; Q3: outlet flow; D1: nozzle diameter; d: suction tube diameter; D2: throat diameter; D3: diffuser diameter; Lt: nozzle length; Lg: throat length La: suction tube length; Ld: diffuser length; α1: nozzle angle; α2: diffuser angle. Cross sections: 0: free surface level of injection solution; 1: Venturi inlet; 2: throat inlet; 2’: throat outlet; 3: Venturi outlet; 4: suction tube outlet; 5: suction tube inlet
The Venturi operating equations are applied to obtain the relationship between head losses at the injector inlet (Section 1) and the start of the throat (Section 2), between the throat inlet (Section 2) and throat outlet (Section 2’), between throat outlet (Section 2’) and injector outlet (Section 3), between the point where the throat joins (Section 4) the free layer (Section 5). This procedure is used to determine the head loss between each section and the total injector head loss in addition to finding the ratio between the injector’s inlet and outlet pressures and the energy lost in suction.
Re-ordering the Venturi injector parameters, looking at Figure 1 and following the definitions in ISO 15873:2002, the basic parameters are organized as follows:
-
Inlet pressure (P1/γ), in throat (P2/γ) and at outlet (P3/γ);
-
Pressure differential(DP)/γ): (P1-P2/γ);
-
Main flow or motive water flow (Q1): injector nozzle inlet flow;
-
Injection flow (q): flow injected into throat by suction tube;
-
Maximum and minimum pressure differentials: or those at which maximum and minimum injection flows are achieved, respectively;
-
Main flow range: or the difference between the minimum flow required to start suction and the maximum flow;
-
Maximum injection flow (qmax): variable with the established pressure conditions subject to the generation of cavitation;
-
Injection ratio (rq): q/Q1+q;
-
Nominal diameter (DN): corresponds to diameter of tube at inlet and outlet;
-
Injector dimensions and components: internal nozzle lengths and diameters (Lt, D1), throat (Lg, D2) and diffuser (Ld, D3=D1) and nozzle and diffuser angle values (α1 and α2 respectively.
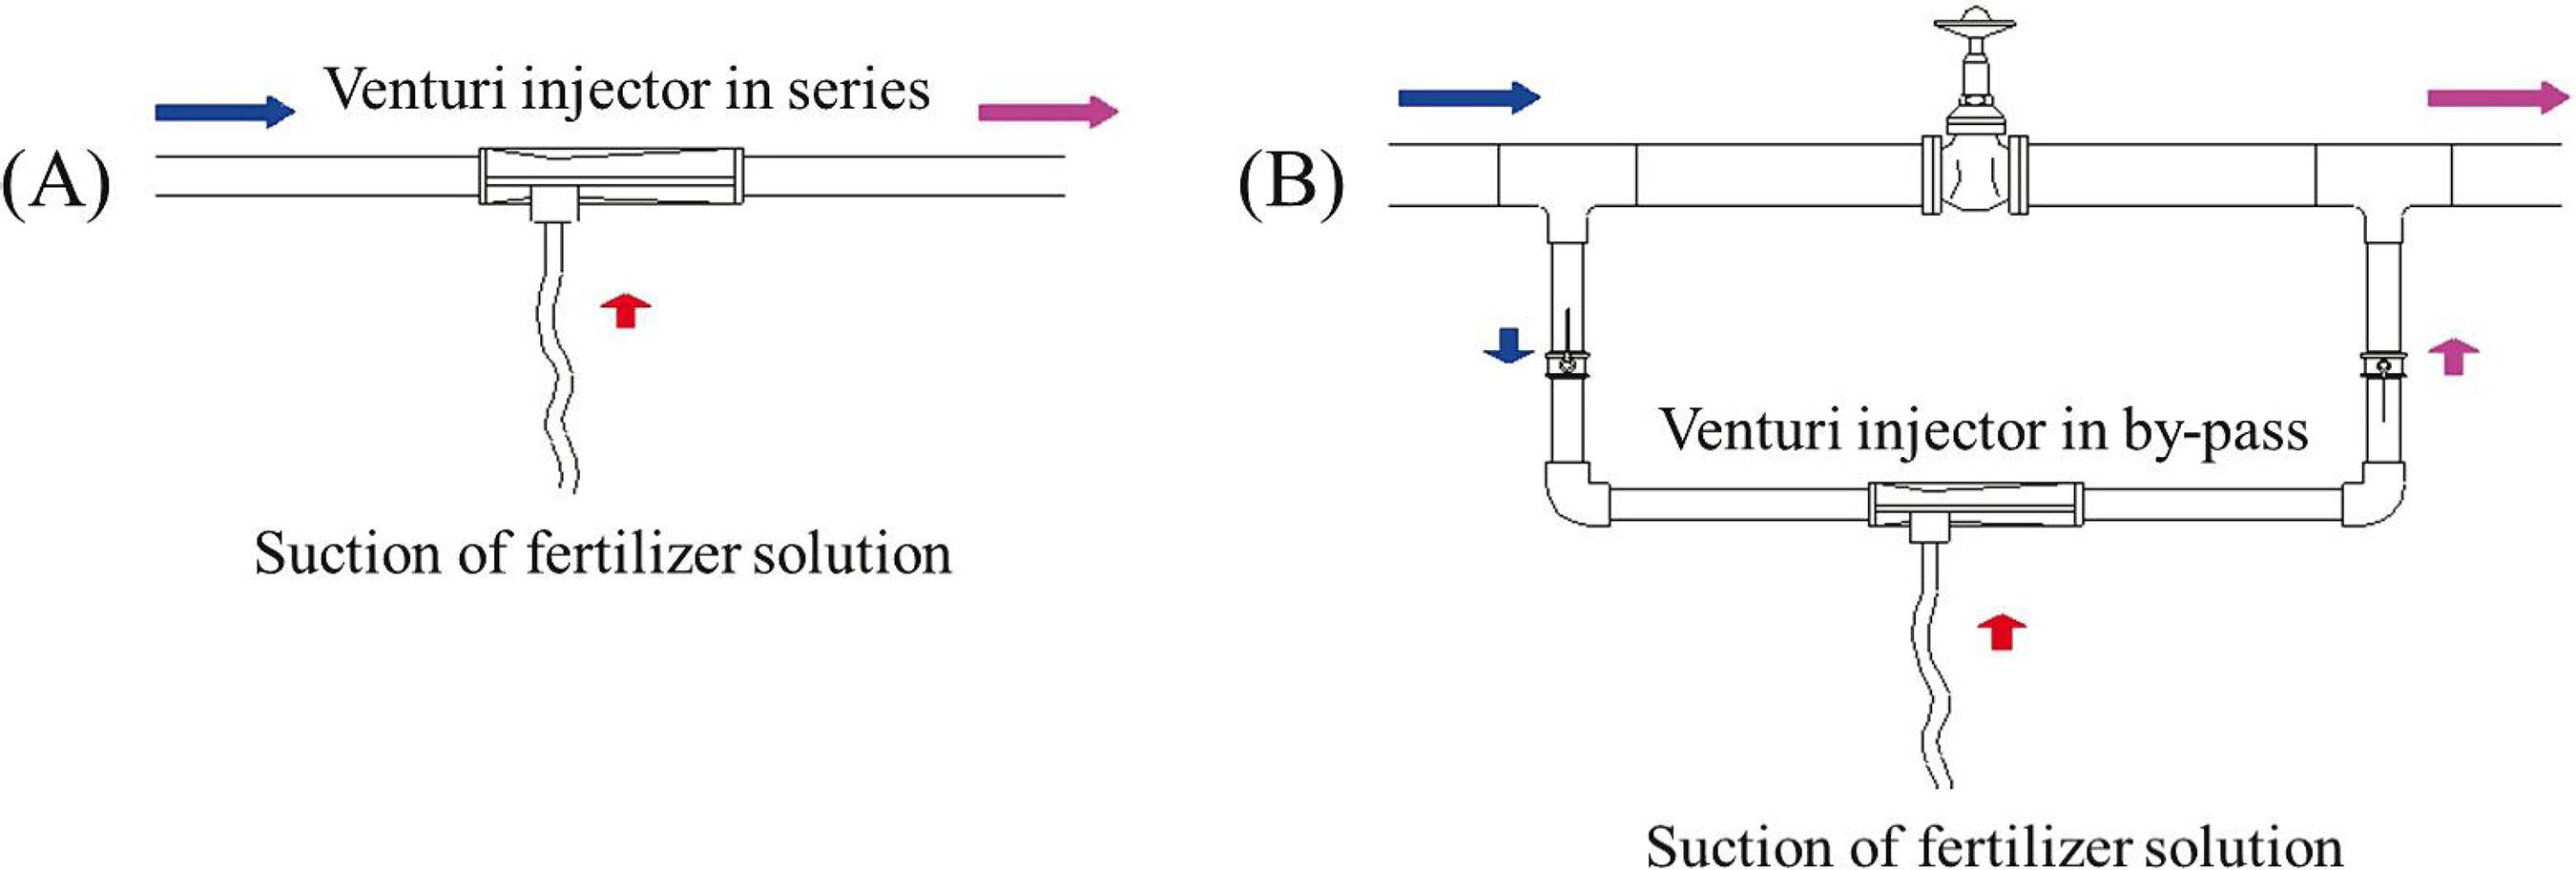
By means of the equations obtained from the theoretical formulation and supported, when possible, by the experimental relationships of DP/γ, Q1 and q, a graphic method was designed to find the relationship between the principal Venturi injector operating parameters, applied to two specific Venturi models with two different arrangements (Table 1 and Figure 2).
Venturi injectors studied: Model “A” installed in series (A) and Model “B” installed in by-pass (B)
The graphic method, derived from dimensional analysis and nomogram theory, is the result of three graphs in a single nomogram or selection abacus for each model.
The first graph is in upper left hand corner of the abacus, constructed from the expression q=f (P1/γ,P2/γ). The second is in the lower left hand corner, obtained from the expression DP = f (Q1). This is related on the right with outlet pressure (P3/γ), by means of the relationship Δhv = f (Q1, q) (third graph). The graphs were integrated with SigmaPlot 12.0. software.
In in-series installations (Model “A”) this selection abacus can directly determine pressures at the injector inlet (P1/γ), throat (P2/γ) and outlet (P3/γ). This requires the known agronomic parameters of injection flow (q) and main irrigation flow (Q1) to be set. It also allows the injector’s derived minimum flow (Q1) to be fixed in bypass arrangements (Model “B”), as well as the pressures at the throat (P2/γ) and outlet (P3/γ) to obtain the desired solution flow (q) from the selected inlet pressure (P1/γ). In fact they allow all the variables that intervene in a given injector model to be related to each other.
With the aim of establishing reference values and finding the order of magnitude of the injection and irrigation flows, a number of fertigation simulations were carried out on commercial melon and tomato production installations with two types of injector (Models “A” and “B”). These crops were selected since they have similar production cycles in temperate and tropical climates (Spain and Brazil).
For the Brazilian melons, the example followed was an eight-week cycle (SOUSA et al., 2014SOUSA, V. F. de et al. Irrigação e fertirrigação na cultura do melão. In: SOUSA, V. F. de et al. Irrigação e fertirrigação em fruteiras e hortaliças. Brasília: Empresa Brasileira de Pesquisa Agropecuária, 2014. p. 657-688.), on an irrigated surface of 0.5 hectares (total area 5,000 m2), at a fertigation frequency of 2 days and fertigation time of 1 hour per irrigation period. The compensating drippers were set at 4 L h-1, with guaranteed outlet pressure (P3/γ) of 10 m.w.c. Drippers were placed at 0.5 m intervals with 2 m lateral spacing (1 m2 per dripper). For 5,000 drippers (5,000 m2 divided by 1 m2) operating individually at 4 L h-1 the flow required to irrigate the sector was 20,000 L h-1 (5.55 L s-1). In this case the injection flow (q) was calculated as a percentage of irrigation flow (Q1) establishing an injection ratio (rq) of 1%, equivalent to 200 L h-1. The fertilizer used was potassium nitrate (KNO3) and urea (CH4N2O) dissolved in water.
The tomato producers were located in Murcia (Spain) and in this case HuraGIS software was used to calculate the irrigation and fertigation program from weather and agronomic information (JIMÉNEZ-BELLO et al., 2011JIMENEZ-BELLO, M. A. et al. Analysis, assessment, and improvement of fertilizer distribution in pressure irrigation systems. Irrigation Science, v. 29, n. 1, p. 45-53, 2011.). A 14-week cycle was considered on an irrigation surface equivalent to 2 hectares (total area 20,000 m2), with 1 hour of fertigation per day at peak time. Non-compensating drippers were used at a pressure of 8 m.w.c for a nominal flow of 2 L h-1. Distance between drippers was 0.5 m with 0.8 m between lines (0.4 m2 per dripper). With 50,000 drippers (20,000 m2 divided by 0.4 m2) of 2 L h-1 each, the flow required for each sector was 100,000 L h-1 (27.77 L s-1). The commercial fertilizer was mixed with 9-3-7 (NPK) commercial soluble compound at a maximum injection flow (q) of 64 L h-1.
RESULTS AND DISCUSSION
Analytic characterization of Venturi injector
The basic parameters used in the characterization, design and selection of a Venturi injector are the pressures P1/γ, P2/γ and P3/γ, the flows Q1 and q, diameters D1, D2 and d, and the values of internal angles of the converging and diverging segments (α1 and α2).
Parameters such as the differential pressure between inlet and throat, throat and outlet, total head losses and main flows were used by Manzano et al. (2014)MANZANO, J. et al. Diseño y predicción del funcionamiento de inyectores Venturi en riego localizado. Revista Brasileira de Engenharia Agrícola e Ambiental, v. 18, n. 12, p. 1209-1217, 2014. to design and predict the operations of Venturi injectors. Yan et al. (2012)YAN, H. J. et al. Effect of structural optimization on performance of Venturi injector. Earth and Environmental Science, v. 15, n. 7, p. 1-8, 2012., in a study on the structural optimization in designing these injectors, found inlet pressure and inlet/outlet pressure differential to be the principal variables affecting operations. Prototypes and types of installation (MANZANO et al., 2015MANZANO, J. et al. Diseño y alternativas en la instalación de inyectores Venturi en riego localizado. Ciência Agronômica, v. 46, n. 2, p. 287-298, 2015.) and the generation of cavitation (XU et al., 2014XU, Y. et al. Detection of cavitation in a Venturi injector with a combined method of strain gauges and numerical simulation. Journal of Fluids Engineering, v. 136, n. 8, p. 1-8, 2014.) are other examples of studies on some of the above-mentioned variables that can be used in characterizing Venturi injectors.
The following injector operating equations are obtained from directly applying Bernouilli’s Theorem, adapted for a real fluid.
First, between inlet and injector (Section 1) and the start of the throat (Section 2), assuming a horizontal arrangement (Equation 1):
Δht, being the head loss in the nozzle and a function of the kinetic term, can be estimated theoretically by means of the coefficient of resistance associated with its geometry (Lt, D1, D2 y α1), so that the differential pressure will be a function of fluid velocity and thus of main flow.
The injection flow will be incorporated in the throat (with velocity v), and distinguishing between Sections 2 and 2’ (throat inlet and outlet, respectively) (Equations 2 and 3) and knowing by the Continuity Equation that the flow in both sections will comply with Q1 = Q2, we have:
In this length there will be a head loss of Δhg which will now depend on the geometry of the connection with the suction tube Lg, and D2 (Equation 4):
Finally, between throat outlet (2’) and injector outlet (3), considering head losses in the diffuser, which again will depend on its geometry (Lg, D1, D2 and α2) and circulating flow, we will have (Equation 5):
Adding the head losses in each length total injector head loss can be defined (Equation 6) and thus the pressure ratio between injector inlet and outlet (Equation 7):
Focusing now on suction, the following ratio can be established between the connection point with the throat and the free surface level (Equation 8):
in which intervene the height difference between sections and head losses in the suction pipe, Δha, which will be associated with the length (La) and duct diameter (d), with inlet and outlet geometries and any existing accessories (filters, rotameters, non-return valves, etc.). This head loss is specific to the configuration of the suction tube and is independent of the Venturi studied. The suction head can be defined as Ha (Equation 9). However, if suction head losses are considered to be negligible and fixing water vapor pressure as the limit, the theoretical limit of the injection flow velocity, v, can be obtained (Equation 10):
Introducing (Equations 1 and 3), the ratio between pressure and flow at the injector inlet (Equation 11) can be obtained:
The head, Ha, will increase as pressure is reduced in the throat, being directly related to injected flow. According to this relationship, injection will not start until a positive head is obtained. The maximum injected flow would be obtained (ignoring height difference) in an ideal situation reducing P2 to vaporization pressure, Pv, as deduced in (Equation 9).
In the relationship between injection flow and inlet pressure P1 and inlet flow Q1 can be seen (Equation 11). If injector inlet pressure is set, and with this pressure variation in the throat, the maximum and minimum flows can be measured.
Another important parameter for Venturi injectors studied by different authors (LIMA NETO; PORTO, 2004LIMA NETO, I. E.; PORTO, R. de M. Performance of low-cost ejectors. Journal of Irrigation and Drainage Engineering, v. 130, n. 2, p. 122-128, 2004.; WINOTO; LI; SHAH, 2000WINOTO, S. H.; LI, H.; SHAH, D. A. Efficiency of jet pumps. Journal of Hydraulic Engineering, v. 126, n. 2, p. 150-156, 2000.) is injection performance. Feitosa et al. (1998)FEITOSA, J. C. et al. Influência da relação entre diâmetros dos bocais no desempenho de injetores tipo Venturi. Engenharia Agrícola, v. 17, n. 4, p. 15-24, 1998., based on the energies of the throat (E2) and injector inlet (E1), defined Venturi performance for chemigation (Equation 12):
The development of this expression, considering kinetic (Ec) and potential (Ep) energies and fluid density (ρ) at each point leads to (Equation 13):
Selection method for Venturi injectors
Although calculation methods are available to determine head losses as functions of the established geometric variables, e.g.IDEL’CIK (1960)IDEL’CIK, I. E. Memento des pertes de charge. Paris: Eyrolles, 1960. 494 p., it is always recommended to establish the relationships from the manufacturer’s technical information obtained from experimental tests. From these all the pressure relationships can be established theoretically as a function of flow or velocity.
An example is shown in Figure 3 for the injectors used in the simulation. The three main pressures are represented as a function of flow for a possible range of maximum and minimum values.
Pressure ratios of inlet (P1/γ), throat (P2/γ) and outlet (P3/γ) of Venturi injector, with main flow (Q1), for Models “A” (A) and “B” (B)
In this case a Venturi outlet pressure (P3/γ) of 10 m.w.c. is established as the minimum dripper operating pressure. The theoretical injection range for this outlet pressure, since the system operates with negative throat pressure, can be determined once this pressure goes below 0 m.w.c. until cavitation is reached in the throat (≈ -10 m.w.c.). In energy terms, the increased main flow causes higher fluid velocity (kinetic energy) in the throat due to the narrower cross-section. As a consequence, on raising the kinetic term, the pressure is gradually reduced (piezometric energy) until the vapor state is reached. However, at the Venturi inlet the higher main flow also affects the inlet pressure, if a given pressure is required at the outlet (P3/γ = 10 m.w.c.). The head losses therefore increase and higher pressure is required at the inlet (P1/γ). In any case, increased main flow is associated with higher kinetic and piezometric energy at the injector inlet.
In the same way it is easy to draw a graph of the theoretical ratio of the injected flow as a function of the suction head or throat pressure (Figure 4).
Theoretical ratio of injected flow (q) with suction head (Ha) of Venturi injector for Models “A” (red) and “B” (blue)
In this case the value of the injected flow is established assuming a simple 1m long suction tube of constant diameter. The theoretical maximum value is determined assuming negligible head losses in the suction tube (Equation 10). These approximations can be carried out for any model or type of installation, although ideally the manufacturer should determine the real behavior of the injector by operating tests.
The ratios between the main parameters of Model “A” and “B” Venturi injectors are integrated in the nomograms given in Figures 5 and 6.
Inlet, throat and outlet pressures of in-series installations, and throat and outlet pressures plus main flow of by-pass installations can be directly determined in Figures 5 and 6. Apart from this advantage, they can also be used to estimate indirectly, with the information obtained, other important parameters such as total head losses, injection ratio and performance.
As the nomograms created are analog graphic tools they are prone to incorrect use, parallax error, poor sight, errors of scale and other factors that could reduce their precision (WILLIAMS; WALKER, 2015WILLIAMS, D. J.; WALKER, J. D. A nomogram for calculation of the Revised Baux Score. Burns, v. 41, n. 1, p. 85-90, 2015.). However, this typical nomographic precision is adequate for the job it is designed to do. These tools, considered to be highly practical, help to solve complicated analytical or numerical calculations (EKNELIGODA, 2015EKNELIGODA, T. C. A design nomogram for a horizontally-fractured geothermal reservoir to determine the production temperature. Engineer, v. 48, n. 2, p. 35-41, 2015.) and are thus widely used for irrigation and hydraulics by both manufacturers and professionals and even in recent studies (USS; CHERNYSHEV, 2016USS, A. Y.; CHERNYSHEV, A. V. The development of the vortex gas pressure regulator. Procedia Engineering, v. 152, n. 1, p. 380-388, 2016.; WEIJERMARS, 2016WEIJERMARS, R. Stress cages and fracture cages in stress trajectory models of wellbores: implications for pressure management during drilling and hydraulic fracturing. Journal of Natural Gas Science and Engineering, v. 36, n. 1, p. 986-1003, 2016.).
The abacus, besides helping in the consultation of printed or virtual catalogs, is the first step in developing software applications. The system proposed here could easily be automated in design or equipment selection software to improve precision and facilitate calculations. There are already in existence various applications that extend the range of nomograms and provide optimized and rapid numerical solutions.
It should be noted that the definition of the theoretical behavior of the Venturi injector is a rather complicated case in Fluid Mechanics; in an apparently simple apparatus there may be at the same time laminar flow and other highly turbulent flows combined with transport phenomena and a mixture of different fluids (water, fertilizer solution, etc.) at different temperatures and viscosities. There may also be operational situations that give rise to cavitation.
In a strictly theoretical study, without taking possible phase changes into consideration, there should be equations for mass conservation, quantity of movement and energy. This strict approximation, supported by Computational Fluid Dynamics (CFD) methods, has been developed in a number of studies (HUANG; LI; WANG, 2009HUANG, X.; LI, G.; WANG, M. CFD simulation to the flow field of Venturi injector. In: LI, D.; ZHAO, C. Computer and computing technologies in agriculture II. 2. ed. Boston: Springer, 2009. v. 294, p. 805-815.; IÑIGUEZ-COVARRUBIAS et al., 2015IÑIGUEZ-COVARRUBIAS, M. et al. Comparación de resultados experimentales de un Venturi con simulación de dinámica de fluidos computacional. Tecnología y Ciencias del Agua, v. 6, n. 4, p.141-152, 2015.; MANZANO et al., 2014MANZANO, J. et al. Diseño y predicción del funcionamiento de inyectores Venturi en riego localizado. Revista Brasileira de Engenharia Agrícola e Ambiental, v. 18, n. 12, p. 1209-1217, 2014.). These studies have successfully compared the real operations of injectors of different geometries with models in CFD simulations and have even created new virtual prototypes (MANZANO et al., 2016MANZANO, J. et al. Geometry and head loss in Venturi injectors through Computational Fluid Dynamics. Engenharia Agrícola, v. 36, n. 3 p. 482-491, 2016.). However, these methods (as can be seen in the cited references) are not completely free of errors; the turbulence calculation model, the treatment of the Navier-Stokes equations, the established boundary conditions or the closeness of the simulated geometry to the actual geometry can all be sources of inaccuracy.
Experimental tests to define the laws of the behavior of individual injectors is another good alternative; tables graphs and behavioral laws based on practical tests in given working conditions can be found in manufacturers’ web sites, e.g. (MAZZEI & NETAFIM) and published papers (FEITOSA et al., 1998FEITOSA, J. C. et al. Influência da relação entre diâmetros dos bocais no desempenho de injetores tipo Venturi. Engenharia Agrícola, v. 17, n. 4, p. 15-24, 1998.; MANZANO et al., 2015MANZANO, J. et al. Diseño y alternativas en la instalación de inyectores Venturi en riego localizado. Ciência Agronômica, v. 46, n. 2, p. 287-298, 2015.). The weakness of these experimental ratios lies in the limits applied when they were created and in many cases the particular situation cannot be reproduced.
In the present work the mathematical ratios obtained with both the experimental and CFD techniques can be applied, even though the method and results obtained are based on Bernouilli’s Theorem. This classic relationship is itself a simplification of the energy equation, where losses in the form of heat are identified mainly with head losses due to the friction of the fluid, and the average velocity is accepted for each cross-section of the flow as a representative value of the existing velocity field.
Thus, even though it is a simple approximation, the application of Bernouilli’s Theorem is universally accepted for the definition of the behavior of the fundamental parameters of flow and pressure of fluid systems (IÑIGUEZ-COVARRUBIAS et al., 2015IÑIGUEZ-COVARRUBIAS, M. et al. Comparación de resultados experimentales de un Venturi con simulación de dinámica de fluidos computacional. Tecnología y Ciencias del Agua, v. 6, n. 4, p.141-152, 2015.; MANZANO et al., 2015MANZANO, J. et al. Diseño y alternativas en la instalación de inyectores Venturi en riego localizado. Ciência Agronômica, v. 46, n. 2, p. 287-298, 2015.).
Fertigation simulations
Case 1 - melons
Preliminary tests showed that the main irrigation flow (Q1 = 5.55 L s-1) and injection flow (q = 200 L h-1) permitted the use of the Model “A” in-series injector (Figure 5). For these values two horizontal dotted lines are drawn in the graph (Step 1). Where both lines intersect the constant P1/γ line (Step 2) the necessary value at the injector inlet (33.4 m.w.c.) and the value of P2/γ required in the throat (-1.52 m.w.c.). The intersection of the horizontal line of Q1 with the corresponding curve of P1/γ (Step 3) provides the necessary value of P3/γ (25.27 m.w.c.). This pressure exceeds the minimum pressure required by the drippers after the injector (10 m.w.c.), but as they are compensating types the pressure can be adjusted downstream. From the values obtained and using the equation proposed to calculate the injector’s performance (Equation 13) a performance of 0.02% is obtained in this case.
Case 2 - commercial tomatoes for industry
A by-pass installation of the Model “B” injector was chosen for this case due to the available range of flows (Figure 6), since the high irrigation flow did not allow an in-series system. A flow thus had to be derived from the venture injector (Q1) to achieve the desired flow (q). The selected reference inlet pressure was P1/γ at 20 m.w.c. (continuous blue line). From the horizontal line of q until P1/γ (Step 1) the throat pressure (P2/γ de -1.45 m.w.c.) is obtained (Step 2), the derived flow (Q1 of 1.31 L s-1) (Step 2) and outlet pressure (P3/γ of 13.08 m.w.c.) (Step 3). The remainder of the flow required by the subunit (26.46 L s-1) would pass through the main duct and it was necessary to establish a head loss in the Venturi (Δhv = 20 - 13.08 = 6.92 m.w.c.) by the regulation valves and regulate the pressure downstream of the injector to achieve the 10 m.w.c. required by the irrigation sector. The performance of the injector for this model was higher than the previous case, close to 0.2%, due to the by-pass type installation. The use of this indicator and the proposed formulation mean that models can be compared for different use scenarios.
It is evident that in both cases the installation and settings of the injector depend on the other components: main duct, regulation valves and automation, etc. It should also be noted that modifying the circulating flow or pressure affects the other hydraulic parameters involved.
The effects of temperature and viscosity on the injection flow should also be considered. The two case studies considered a constant ambient temperature of 25 ºC and the same viscosity for water and the fertilizer solution. However, according to Yuan et al. (2000)YUAN, Z. et al. Effects of liquid temperature and viscosity on Venturi injectors. Transactions of the American Society of Agricultural Engineers, v. 43, n. 6 p. 1441-1448, 2000., in fluids with a low viscosity (<1.5 mPa s) similar to that of water, the injection flow is not affected by temperature. On the other hand, when viscosity is high (>3 mPa s) there may be larger variations. Viscous products used in fertigation such as urea ammonium nitrate (UAN32) and calcium ammonium nitrate (CAN-17) can cause variations in the injection rate of 10 and 5%, respectively, with a daily variation of 20 ºC in the fertilizer tank. High fluid density can also reduce the injection flow (LIMA NETO, 2006LIMA NETO, I. E. Formulação adimensional do fluxo em injetores de fertilizantes. Revista Brasileira de Engenharia Agrícola e Ambiental, v. 10, n. 2, p. 247-251, 2006.), so that when using agrochemicals with very high densities and/or viscosities (not a common practice in chemigation) these effects must be taken into consideration.
In the proposed procedure, using Bernouilli’s Theorem and theoretical functions (Darcy-Weisbach) to calculate head loss in nozzle, throat and diffuser or suction tube of the Venturi injector, the calculation equations can easily be adjusted when adjusting kinetic viscosity for the friction factor. Another uncommon situation in chemigation consists of using fertilizer solution tanks with a higher piezometric level (e.g. at a higher level or pressurized tanks) than the injector throat, in which case the suction pressure P0/γ would have to be modified as appropriate. In practice, with regards to nomograms, this would mean modifying the working range to the new pressure, now above 0 m.w.c. However, it should be noted that specific empirical functions for a given model and fertilizer solution, or if not available, CFD techniques, will always give better results. This means that to choose the right injector model it is not enough to determine its ratios correctly, but the data referring to the entire chemigation installation should also be taken into account.
From actual irrigation conditions it is possible to obtain information on irrigation flows and the flows necessary for fertilizer injection. These latter values can be used in theoretical equations and/or in nomograms containing the principal Venturi injector parameters (more practical), such as in the examples given in Figures 5 and 6 to determine the other parameters (inlet, throat and outlet pressures and main flow). This procedure will make it easier to select the right injector model to use in fertigation with pressurized irrigation subunits.
CONCLUSIONS
-
Based on ISO15873:2002, analytic ratios are proposed for injected flow, main flow range and injector operating pressures for the complete characterization of Venturi injectors;
-
A method of commercial selection or Venturi injector design (selection abacuses) is also proposed, supported by the analytic, theoretical or experimental formulation. For this, exact information of the irrigation subunits and the producer’s fertilization program is required.
-
1
Extraído parcialmente de la Tesis del primer autor, con el apoyo financiero de la Universitat Politècnica de València y del Centro Valenciano de Estudios del Riego
REFERENCES
- ARVIZA, J. Dispositivos para fertirrigación en sistemas de riego localizado. Vida Rural, n. 123, p. 34-40, 2001.
- DALRI, A. B. et al Entupimento de emissores enterrados sob a cultura da cana-de-açúcar após três anos de cultivo em condições fertirrigadas. Irriga, p. 62-71, 2014. Edição Especial.
- DIMITRIOS, B. et al Effects of fertilization and salinity on weed flora in common bean (‘Phaseolus vulgaris’ L.) grown following organic or conventional cultural practices. Australian Journal of Crop Science, v. 8, n. 2, p. 178-182, 2014.
- EKNELIGODA, T. C. A design nomogram for a horizontally-fractured geothermal reservoir to determine the production temperature. Engineer, v. 48, n. 2, p. 35-41, 2015.
- FEITOSA, J. C. et al Influência da relação entre diâmetros dos bocais no desempenho de injetores tipo Venturi. Engenharia Agrícola, v. 17, n. 4, p. 15-24, 1998.
- HAIJUN, Y. et al Influence of optimization of structural parameters on injection performance of Venturi injector. Journal of Drainage and Irrigation Machinery Engineering, v. 8, p. 1-16, 2013.
- HUANG, X.; LI, G.; WANG, M. CFD simulation to the flow field of Venturi injector. In: LI, D.; ZHAO, C. Computer and computing technologies in agriculture II 2. ed. Boston: Springer, 2009. v. 294, p. 805-815.
- IDEL’CIK, I. E. Memento des pertes de charge Paris: Eyrolles, 1960. 494 p.
- IÑIGUEZ-COVARRUBIAS, M. et al Comparación de resultados experimentales de un Venturi con simulación de dinámica de fluidos computacional. Tecnología y Ciencias del Agua, v. 6, n. 4, p.141-152, 2015.
- INTERNATIONAL ORGANIZATION FOR STANDARDIZATION. Irrigation equipment differential pressure Venturi-type liquid additive injectors (ISO 15873:2002) Geneva, 2002. 7 p.
- JIMENEZ-BELLO, M. A. et al Analysis, assessment, and improvement of fertilizer distribution in pressure irrigation systems. Irrigation Science, v. 29, n. 1, p. 45-53, 2011.
- KUMAR, M.; RAJPUT, T. B. S.; PATEL, N. Effect of system pressure and solute concentration on fertilizer injection rate of a Venturi for fertigation. Indian Society of Agricultural Engineers, v. 49, p. 9-13, 2012.
- LIMA NETO, I. E. Formulação adimensional do fluxo em injetores de fertilizantes. Revista Brasileira de Engenharia Agrícola e Ambiental, v. 10, n. 2, p. 247-251, 2006.
- LIMA NETO, I. E.; PORTO, R. de M. Performance of low-cost ejectors. Journal of Irrigation and Drainage Engineering, v. 130, n. 2, p. 122-128, 2004.
- MANTOVANI, E. C. et al Eficiência no uso da água de duas cultivares de batata-doce em resposta a diferentes lâminas de irrigação. Horticultura Brasileira, v. 31, n. 4, p. 602-606, 2013.
- MANZANO JUAREZ, J. Análisis del inyector Venturi y mejora de su instalación en los sistemas de riego localizado 2008. 248 f. (Tesis Doctoral) - Departamento de Ingeniería Rural y Agroalimentaria, Universitat Politècnica de València, Valencia, 2008.
- MANZANO, J. et al Diseño y alternativas en la instalación de inyectores Venturi en riego localizado. Ciência Agronômica, v. 46, n. 2, p. 287-298, 2015.
- MANZANO, J. et al Diseño y predicción del funcionamiento de inyectores Venturi en riego localizado. Revista Brasileira de Engenharia Agrícola e Ambiental, v. 18, n. 12, p. 1209-1217, 2014.
- MANZANO, J. et al Geometry and head loss in Venturi injectors through Computational Fluid Dynamics. Engenharia Agrícola, v. 36, n. 3 p. 482-491, 2016.
- SOUSA, V. F. de et al Irrigação e fertirrigação na cultura do melão. In: SOUSA, V. F. de et al Irrigação e fertirrigação em fruteiras e hortaliças Brasília: Empresa Brasileira de Pesquisa Agropecuária, 2014. p. 657-688.
- SOUZA, T. R. de. et al Dinâmica de nutrientes na solução do solo em pomar fertirrigado de citros. Pesquisa Agropecuária Brasileira, v. 47, n. 6, p. 846-854, 2012.
- SUN, Y.; NIU, W. Simulating the effects of structural parameters on the hydraulic performances of Venturi tube. Modelling and Simulation in Engineering, v. 1, p. 1-7, 2012.
- USS, A. Y.; CHERNYSHEV, A. V. The development of the vortex gas pressure regulator. Procedia Engineering, v. 152, n. 1, p. 380-388, 2016.
- XU, Y. et al Detection of cavitation in a Venturi injector with a combined method of strain gauges and numerical simulation. Journal of Fluids Engineering, v. 136, n. 8, p. 1-8, 2014.
- WEIJERMARS, R. Stress cages and fracture cages in stress trajectory models of wellbores: implications for pressure management during drilling and hydraulic fracturing. Journal of Natural Gas Science and Engineering, v. 36, n. 1, p. 986-1003, 2016.
- WILLIAMS, D. J.; WALKER, J. D. A nomogram for calculation of the Revised Baux Score. Burns, v. 41, n. 1, p. 85-90, 2015.
- WINOTO, S. H.; LI, H.; SHAH, D. A. Efficiency of jet pumps. Journal of Hydraulic Engineering, v. 126, n. 2, p. 150-156, 2000.
- YAN, H. J. et al Effect of structural optimization on performance of Venturi injector. Earth and Environmental Science, v. 15, n. 7, p. 1-8, 2012.
- YUAN, Z. et al Effects of liquid temperature and viscosity on Venturi injectors. Transactions of the American Society of Agricultural Engineers, v. 43, n. 6 p. 1441-1448, 2000.
Publication Dates
-
Publication in this collection
Apr-Jun 2018
History
-
Received
04 Nov 2015 -
Accepted
23 May 2017