Abstracts
The purpose of the study was to analyze the electromyographic signal of the multifidus, longissimus thoracis and the lumbar iliocostalis muscles during the Biering-Sorensen test in subjects without lower back pain. Twenty volunteers performed the test on three separate occasions. An analysis of variance detected a difference between the three test times (p = 0.0026). For the frequency domain, it was observed that there were differences between the multifidus and the lumbar erectors muscles; longissimus and iliocostalis muscles. However, in the time domain analysis, no difference was observed. As the values of the slope coefficients of median frequencies were higher for the multifidus muscle, compared to the longissimus and lumbar iliocostalis muscles, this may indicate a higher tendency toward muscle fatigue. Therefore, considering the applied methodology, the study of electromyographic signals in the frequency domain should be considered as an instrument to assess fatigue of the spinal extensor muscles in clinical situations.
muscle fatigue; lower back pain; stabilization; electromyography
O propósito deste estudo foi analisar o sinal eletromiográfico dos músculos multífido, longuíssimo torácico e iliocostal lombar durante o teste de Biering-Sorensen em sujeitos sem dor lombar. Vinte voluntários realizaram o teste em três momentos distintos. A análise da variância detectou diferença entre os três momentos do teste (p = 0,0026). Para o domínio da frequência, foi observada a presença de diferença entre o músculo multífido e os eretores lombares; longuíssimo e o iliocostal. Entretanto, na análise no domínio do tempo não foram observadas diferenças. Como o valor do coeficiente de inclinação da frequência mediana foi maior para o músculo multífido comparado aos músculos longuíssimo e iliocostal, isto pode indicar uma maior tendência deste músculo à fadiga. Portanto, considerando-se a metodologia aplicada, o estudo do sinal eletromiográfico no domínio da frequência deve ser considerado como um instrumento para avaliar a fadiga do músculos extensores da coluna vertebral em situações clínicas.
fadiga muscular; lombalgia; estabilização; eletromiografia
El propósito de este estudio fue analizar la señal eletromiográfica de los músculos multífido, longuíssimo torácica y iliocostal lumbar durante la prueba Biering-Sorensen en sujetos sin dolor lumbar. Veinte voluntarios realiza la prueba en tres momentos diferentes. El análisis de varianza detectó una diferencia entre las tres etapas de la prueba (p = 0,0026). Para el dominio de la frecuencia, se observó la presencia de la diferencia entre el multífido y erector lumbar; longuíssimo y iliocosta. Sin embargo, el análisis en el dominio del tiempo, no se observaron diferencias. Como el valor del coeficiente de la pendiente de la frecuencia media fue más alta para el músculo multífido en comparación con longuíssimo y iliocostal, esto puede indicar un aumento de la tendencia del músculo a la fatiga. Por lo tanto, teniendo en cuenta la metodología, el estudio de la señal electromiográfica en el dominio de la frecuencia debe ser considerado como un instrumento para evaluar la fatiga de los músculos extensores de la columna vertebral en entornos clínicos.
fatiga muscular; dolor de espalda; estabilización; electromiografía
Introduction
Lower back pain is a condition that is associated with a very high incidence, and it is considered a public health problem that results in high costs to health services (Dagenais, Caro, & Haldeman, 2008Dagenais, S., Caro, J., & Haldeman, S. (2008). A systematic review of low back pain cost of illness studies in the United States and internationally. The Spine Journal, 8(1), 8-20. ; Hoy, Brooks, Blyth, & Buchbinder, 2010Hoy, D., Bain, C., Williams, G., March, L., Brooks, P., Blyth, F., Buchbinder, R. (2012). A systematic review of the global prevalence of low back pain. Arthritis and Rheumatism, 64(6), 2028-37. ; Hoy et al., 2012Hoy, D., Bain, C., Williams, G., March, L., Brooks, P., Blyth, F., Buchbinder, R. (2012). A systematic review of the global prevalence of low back pain. Arthritis and Rheumatism, 64(6), 2028-37. ; Manchikanti, Singh, Datta, Cohen, & Hirsch, 2009Manchikanti, L., Singh, V., Datta, S., Cohen, S. P., & Hirsch, J. A. (2009). Comprehensive review of epidemiology, scope, and impact of spinal pain. Pain Physician, 12(4), E35-70. ). Individuals have a 40% chance of experiencing an episode of back pain in their lifetime (Hoy et al., 2012Hoy, D., Bain, C., Williams, G., March, L., Brooks, P., Blyth, F., Buchbinder, R. (2012). A systematic review of the global prevalence of low back pain. Arthritis and Rheumatism, 64(6), 2028-37. ; Panjabi, 2003Panjabi, M. M. (2003). Clinical spinal instability and low back pain. Journal of Electromyography and Kinesiology, 13(4), 371-379. ), but it generally has a good prognosis, with resolution in 2 to 4 weeks (Hides, Jull, & Richardson, 2001Hides, J. A., Jull, G. A., & Richardson, C. A. (2001). Long-term effects of specific stabilizing exercises for first-episode low back pain. Spine, 26(11), 243-248.), and complete cessation in 2 or 3 months (O'Sullivan, 2000O'Sullivan, P.O. (2000). Lumbar segmental 'instability': clinical presentation and specific stabilizing exercise management. Manual Therapy, 5 (1), 2-12.). Nevertheless, the recurrence rate in the first year after acute onset is between 60 and 86%, of which 2-3% of people develop a chronic condition (Hides et al., 2001Hides, J. A., Jull, G. A., & Richardson, C. A. (2001). Long-term effects of specific stabilizing exercises for first-episode low back pain. Spine, 26(11), 243-248.).
The importance of the multifidus muscle (MT) on spine stabilization was observed in an in vitro biomechanical study, which showed that it is capable of raising the stiffness of articular level L4/L5 by up to two thirds (Wilke, Wolf, Claes, Arand, & Wiesend, 1995Wilke, H., Wolf, S., Claes, L., Arand, M., & Wiesend, A. (1995). Stability increase of the lumbar spine with different muscle groups. A biomechanical in vitro study. Spine, 20(2), 192-8.). Therefore, in patients with lower back pain, this muscle can be more fatigable than in asymptomatic individuals (Coorevits et al., 2005Coorevits, Pascal, Danneels, L., Cambier, D., Ramon, H., & Vanderstraeten, G. (2008). Assessment of the validity of the Biering-Sørensen test for measuring back muscle fatigue based on EMG median frequency characteristics of back and hip muscles. Journal of Electromyography and Kinesiology, 18(6), 997-1005. ; Cox, 2002Cox, J. M. (2002). Dor lombar: mecanismo, diagnóstico e tratamento (6.ed., pp. 653-678). São Paulo: Manole.; Sung, 2003Sung, P. S. (2003). Multifidi muscles median frequency before and after spinal stabilization exercises. Archives of Physical Medicine and Rehabilitation, 84(9), 1313-1318. ). Given its importance in controlling lumbar segmental stability (Freeman, Woodham, & Woodham, 2010Freeman, M. D., Woodham, M. a, & Woodham, A. W. (2010). The role of the lumbar multifidus in chronic low back pain: a review. PM & R: the journal of injury, function, and rehabilitation, 2(2), 142-6; quiz 1 p following 167. ; Hides, Richardson, & Jull, 1996Hides, J. A., Jull, G. A., & Richardson, C. A. (2001). Long-term effects of specific stabilizing exercises for first-episode low back pain. Spine, 26(11), 243-248.), it is natural that assessment protocols contemplate specific tests to evaluate the conditions of muscle fatigue and its correlation with lower back pain.
Electromyography (EMG) allows the study of muscle fatigue by providing easy access to physiological processes that lead the muscle to generate force. The use of an electromyographic signal as an indicator of muscle fatigue displays time-dependent changes before any change in the force generated that predicts the onset of contractile fatigue (Al-Mulla, Sepulveda, & Colley, 2011Al-Mulla, M. R., Sepulveda, F., & Colley, M. (2011). A review of non-invasive techniques to detect and predict localised muscle fatigue. Sensors (Basel, Switzerland), 11(4), 3545-94. ; De Lucca, 1997De Lucca, C. (1997). The use of surface eletromyography in biomechanics. Journal of Applied Biomechanics, (13), 135-163.). Although changes in electrophysiological properties occur during voluntary contractions, and are manifested in the EMG signal, the behavior of this signal can be analyzed in both time and frequency domains (Merletti, Lo Conte, & Orizio, 1991Merletti, R., Lo Conte, L. R., & Orizio, C. (1991). Indices of Muscle Fadigue. Journal of Electromyography and Kinesiology, 1(1), 20-33.).
The resilience of spinal superficial and deep extensor muscles has been evaluated by the static strength of the back extensors test, proposed by Sorensen (Cox, 2002Cox, J. M. (2002). Dor lombar: mecanismo, diagnóstico e tratamento (6.ed., pp. 653-678). São Paulo: Manole.). This clinical test demonstrated reliable measurements to discriminate between individuals with and without lower back pain (Alaranta, Hurri, Heliövaara, Soukka, & Harju, 1994Alaranta, H., Hurri, H., Heliövaara, M., Soukka, A., & Harju, R. (1994). Non-dynamometric trunk performance tests: reliability and normative data. Scandinavian Journal of Rehabilitation Medicine, 26(4), 211-5.; Latimer, Maher, Refshauge, & Colaco, 1999Latimer, J., Maher, C. G., Refshauge, K., & Colaco, I. (1999). The reliability and validity of the Biering-Sorensen test in asymptomatic subjects and subjects reporting current or previous nonspecific low back pain. Spine, 24(20), 2085-9. ), and is safe, appropriate and easy to perform (Moreau, Green, Johnson, & Moreau, 2001Moreau, C. E., Green, B. N., Johnson, C. D., & Moreau, S. R. (2001). Isometric back extension endurance tests: a review of the literature. Journal of Manipulative and Physiological Therapeutics, 24(2), 110-22. ). In a critical review, the authors concluded that the Biering-Sorensen test has become the tool of reference for evaluating muscle performance in patients with lower back pain, most notably before and after rehabilitation (Demoulin, Vanderthommen, Duysens, & Crielaard, 2006Demoulin, C., Vanderthommen, M., Duysens, C., & Crielaard, J.-M. (2006). Spinal muscle evaluation using the Sorensen test: a critical appraisal of the literature. Joint, Bone, Spine, 73(1), 43-50. ). Since then, various clinical studies have used this test to measure the resistance of the paraspinal muscles (Nassif et al., 2011Nassif, H., Brosset, N., Guillaume, M., Delore-Milles, E., Tafflet, M., Buchholz, F., & Toussaint, J.-F. (2011). Evaluation of a randomized controlled trial in the management of chronic lower back pain in a French automotive industry: an observational study. Archives of Physical Medicine and Rehabilitation, 92(12), 1927-1936. e4.; Sung, 2013Sung, P. S. (2003). Multifidi muscles median frequency before and after spinal stabilization exercises. Archives of Physical Medicine and Rehabilitation, 84(9), 1313-1318. ). However, this test does not assess the MT individually, but a set of muscles that act as accessories for the performance of that movement, and thus, it is possible that the load transfer between muscles masking the real load applied at multifidus.
There is functional differences established for these muscles (França, Burke, Claret, & Marques, 2008França, F. J. R., Burke, T. N., Claret, D. C., & Marques, A. P. (2008). Estabilização segmentar da coluna lombar nas lombalgias : uma revisão bibliográfica e um programa de exercícios. Fisioterapia e Pesquisa,15(2), 200-206.), where the MT is responsible for the local control and stability, because it is directly connected to the vertebra, while LG and IC muscles are responsible for general stability, not being connected directly to the spine. Also, multifidus muscle fatigue rate is greater in patients with chronic back pain when compared with subjects without back pain (Biedermann, Shanks, Forrest, 1991Biedermann HJ, Shanks GL, Forrest WJ, I. J. (1991). Power spectrum analyses of electromyographic activity. Discriminators in the differential assessment of patients with chronic low-back pain. Spine, 16(10), 1179-84.). Thus, we intend to evaluate subjects without lower back pain to check the level of muscle load applied during the trunk extension. This study, therefore, aimed to analyze the behavior of EMG signals in time and frequency domains on the MT, the longissimus thoracis (LG), and the lumbar iliocostalis (IC), using surface EMG (sEMG), in individuals without lower back pain where there is no muscle inhibition by pain during the Biering-Sorensen test.
Methods
Subjects
A total of 27 healthy males and females were invited to participate in this study. The volunteers underwent a clinical evaluation, and were considered eligible for the study if they had no pain symptoms, no musculoskeletal disease, no history of back surgery, no important structural or functional deformities, or had not complained of pain during the Sorensen lumbar endurance test. Following the evaluation, 20 individuals met the eligibility criteria and composed the study sample. A detailed description of the anthropometric characteristics of the sample is provided in Table 1. All participants signed a consent form, and the study was approved by the Research Ethics Committee of FCT/UNESP.
Design
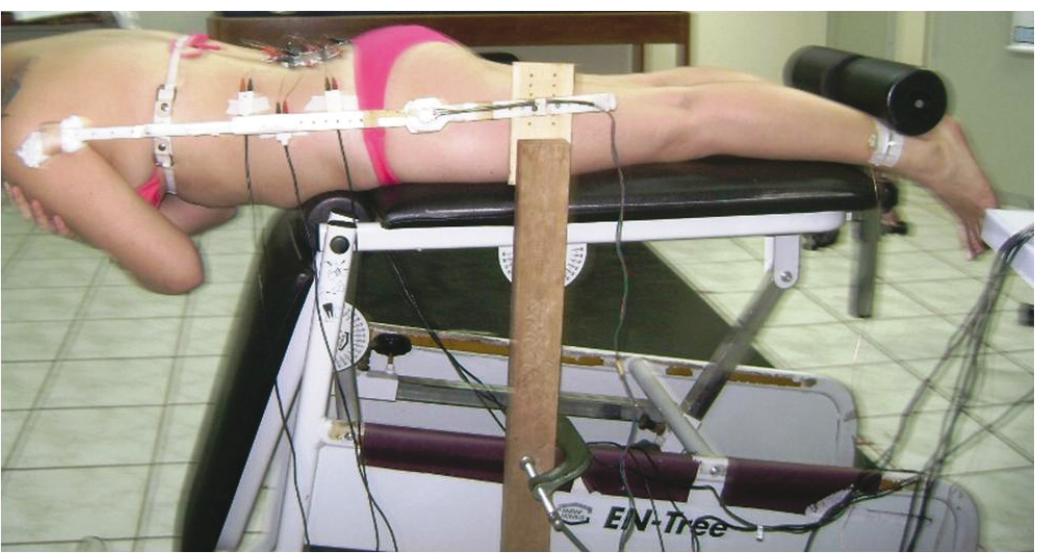
After the sample selection, participants were positioned prone for the Biering-Sorensen test. They were instructed to keep their trunk in a neutral position, through isometric contraction of the extensors of the spine, keep the head aligned with the trunk and arms folded at the height of the chest after removal of support for the anterior trunk (Figure 1).
Sorensen test in lateral view, with ankles embedded in the roller support and arms crossed at chest height.
Each participant was given verbal encouragement throughout the test. Interruption of the test occurred entirely at the discretion of the participant or at the moment the position of the trunk oscillated by more than 15 degrees. The maximum supporting time was 5 minutes.
The test was conducted in three different time moments, two of which (T1 and T2) were on the same day, with an interval of 15 minutes between them, while the third (T3) was carried out 24 hours after the first test day. Active surface electrodes were attached to the back extensor muscles (MT, LG, and IC), on the right and left sides of the body, to capture EMG activity.
Equipment
EMG activity was recorded using an 8-channel signals system acquisition (Lynx(r), São Paulo, Brazil) through six pairs of self-adhesive surface electrodes, Meditrace model (Tyco Healthcare, Canada), with AgCl surface attachment and a diameter of 10 mm. A preamplifier circuit with a gain of 20 times, common mode rejection ratio greater than 80 dB, and impedance of 1012 Ω, was connected to the electrodes. All analog signals were filtered with a band cut-off frequency of 20 Hz (high pass) and 500 Hz (low pass) by an analog filter (of the second-order Butterworth type), and then amplified to a final gain of 1000 times. The system also contained a converting plate, to convert from analog to digital (A/D), configured for a sampling frequency of 2000 Hz. For acquisition and storage of signals in data files, we used Bioinspector 1.8 software.
An electrogoniometer, consisting of two plastic rods interconnected by a linear potentiometer 5K Ω, was connected to the signal conditioning module to monitor trunk oscillations during the test, and voltage variation during movement of the rods was converted by calibration of degrees of movement. Electrogoniometer rods were fixed to the side of the trunk by velcro and on a fixed bar on the edge of the bank, keeping the focus on the line of the hip joint. For the test, we used a bank linked to a support for the posterior region of the ankles, allowing the trunk to remain free during test execution.
Procedures
Before marking the points at which to attach the electrodes, the skin was carefully prepared by shaving, cleansing, and mild abrasion with hydrated alcohol. The location of anatomical points was guided by palpation, following the standards proposed by SENIAM (Hermens et al.1999Hermens, H.J., Freiks, B., Merletti, R., Stegeman, D., Blok, J., Rau, G., Disselhorst-Klug, C., Hägg, G. (1999). European Recommendations for Surface ElectroMyoGraphyNo Title. SENIAM 8 http://www.seniam.org
http://www.seniam.org...
). From the upper border of the iliac crest moving toward the spine, the L4 vertebra was located, and from this points were marked on L5, on the space between L1 and L2, and on the right and left posterior-superior iliac spine (Figure 2).
Top view of the set points for connecting the electrodes (MT: multifidus, LG: lumbar longissimus, IC: iliocostalis, R: right and L: left).
From those marked points, the pair of electrodes on the MT muscle was positioned at the intersection between an imaginary line starting from the posterior-superior iliac crest to the space between L1 and L2, with a second from the point of L5 to find this imaginary line. For the LG muscle, the pair of electrodes was fixed 2.5 cm lateral to the spinous process of the vertebra L1; and for the IC muscle, 5 cm lateral to the spinous process of the vertebra L2 (Hermens et al.,1999Hermens, H.J., Freiks, B., Merletti, R., Stegeman, D., Blok, J., Rau, G., Disselhorst-Klug, C., Hägg, G. (1999). European Recommendations for Surface ElectroMyoGraphyNo Title. SENIAM 8 http://www.seniam.org
http://www.seniam.org...
). Preamplifiers were connected to the self-adhesive electrodes, while the reference electrode was placed at the side of the left ankle.
With the electrodes already set, the quality of signal capture was verified with the volunteer remaining at rest, and after active extension of the trunk. The presence of noisy electrical environments less than ±50 µV was considered an appropriate condition for collecting EMG signals.
Data analysis
After selection, the signals were transformed in TXT language for further processing, following a routine developed in MATLAB 6.5, at the Laboratory of Biomechanics and Motor Control. In this routine, the raw signal passed through a band-pass digital filter with a frequency of 20 to 500 Hz, and of the fourth-order Butterworth type. A fast Fourier transform was calculated for each window of 2000 ms with 1000 ms overlap. Obtaining the spectrum frequency, the median frequency (MF) was extracted. The MFs obtained were plotted versus time of contraction, making up a linear fit to obtain the slope coefficient (SCMF). Using the same windows, values were obtained from the root mean square (RMS), whose values were also plotted against time of contraction, making up a linear fit to obtain the slope coefficient (SCRMS).
Results
Duration of the Biering-Sorensen test
The average running time of the Biering-Sorensen test was 144.8 s, with a coefficient of variation (CV) of 37.4% among subjects, while for the average variability inter-collection time (T1, T2, and T3), a CV of 15% (ranging from 1.3% to 28.2%) was obtained (Table 2).
Comparison of values of SCMF and SCRMS among different test time moments (T1, T2 and T3)
The ANOVA for the SCMF for the MT, LG and IC muscles, comparing different time moments of the Biering-Sorensen test (T1, T2, and T3), showed no significant difference among them (p> 0.05).
With regard to SCRMS values, the results showed no normal distribution (p < 0.05); then, a nonparametric analysis with repeated measures (Friedman test) was carried out. A statistically significant difference was observed only for SCRMS for the right LG muscle (between T1 and T3).
Comparison of the SCMF values among the muscles
In testing for normality of the data (Kolmogorov and Smirnov), the right MT and left MT muscles did not show normal distribution (p = 0.019 and p < 0.01, respectively). The nonparametric Kruskal-Wallis test showed that there was a significant difference (p < 0.0001) between the muscles; and then a post-test (Dunn's Multiple Comparisons) was applied (Table 3).
Table 3 shows that when compared to the contralateral muscles, the MT, LG, and IC muscles, showed no statistically significant difference. However, the MT muscle showed a significant difference when compared to the LG and IC muscles, regardless of the side analyzed, except when comparing the right side MT muscle with the right side IC muscle and the left side IC muscle. It can also be observed that the MT muscles had a higher average SCMF value compared to the other muscles (Figure 3).
Mean and standard deviation values of Slope Coefficient of Median Frequency (SCMF) for the muscles: A - multifidus (RMT), B - lumbar longissimus (RLG) and C - iliocostalis (RIC) at the right side; and multifidus (LMT), lumbar longissimus (LLG), F-iliocostalis (LIC) on the left side (L), of the three sampling times of 20 volunteers, obtained during the Biering-Sorensen test.
Comparison for the SCRMS values among muscles
The test for normality (Kolmogorov and Smirnov) did not show a normal distribution (right MT - p = 0.031; right LG - p < 0.01; right IC - p < 0.01; left MT - p < 0.01; left LG - p < 0.01; left IC - p < 0.01). The nonparametric Kruskal-Wallis test showed that there was a significant difference (p = 0.0063). Post-test (Dunn's Multiple Comparisons) results are shown in Table 4.
Table 4 shows that there was no difference between the muscles in the analysis of the SCRMS values, except in the comparative analysis between the right MT and left LG muscles, and between the left LG and right IC muscles.
Discussion
The main purpose of this study was to examine whether there are differences in the sEMG behavior of the muscle MT, LG and IC while performing the Biering-Sorensen Test. In summary, the analysis in the frequency domain (MF) showed strong evidence to suggest that there are differences among the MT, the erector LG, and IC muscles. However, the analysis in the time domain (RMS) did not show such differences.
The mean values of SCMF showed a greater inclination of the right and left MT muscle compared to the right and left LG and IC muscles. The greater the slope coefficient, the greater compression of the frequency spectrum toward the low frequencies and, therefore, it increases the tendency to muscle fatigue. Similar results were observed for analysis of the MF (Coorevits, Danneels, Cambier, Ramon, & Vanderstraeten, 2008; Ebadi et al., 2012Ebadi, S., Ansari, N. N., Naghdi, S., Jalaei, S., Sadat, M., Bagheri, H., Fallah, E. (2012). The effect of continuous ultrasound on chronic non-specific low back pain: a single blind placebo-controlled randomized trial. BMC Musculoskeletal Disorders, 13(1), 192. ; Ng, Richardson, & Jull, 1997Ng, J. K., & Richardson, C. a. (1996). Reliability of electromyographic power spectral analysis of back muscle endurance in healthy subjects. Archives of Physical Medicine and Rehabilitation, 77(3), 259-64. )SD = 4.2, range = 20.6-31.9 as well as RMS (Ng et al., 1997Ng, J. K., & Richardson, C. a. (1996). Reliability of electromyographic power spectral analysis of back muscle endurance in healthy subjects. Archives of Physical Medicine and Rehabilitation, 77(3), 259-64. ). Van Dieën and collaborators (1993)Van Dieën JH, Toussaint HM, Thissen C, van de V. A. (1993). Spectral analysis of erector spinae EMG during intermittent isometric fatiguing exercise. Ergonomics, 36(4), 407-14. SD = 4.2, range = 20.6-31.9 showed that the MT muscle changes most of the consistent features of EMG power spectrum, as a consequence of fatigue at L5.
In the analysis of MF, the fact that MT muscles have greater slope in relation to the IC muscles can be explained by the higher activity level of the MT muscle (78%) versus the IC muscle (65%) as observed by Ng, Richardson and Jull, (1997) during the task of keeping the trunk extended. It shows that, despite the difference between the types of muscle fibers (Mannion & Dolan, 1996Mannion, a F., & Dolan, P. (1996). The effects of muscle length and force output on the EMG power spectrum of the erector spinae. Journal of Electromyography and Kinesiology, 6(3), 159-68.; Mannion, Dumas, Stevenson, & Cooper, 1998)possibly reflecting the greater size and conduction velocity of the later-recruited (fast twitch, there was a greater requirement of MT during the test.
The slope coefficient value of the erector spinae muscle has been related to the spatial arrangement of the muscle. It was noticed that the more laterally located muscles were less activated in comparison with the more medially located muscles. It is consistent with previous studies using surface EMG on lumbar paraspinal muscles (Coorevits et al., 2008; Larivière, Gagnon, Gravel, & Bertrand Arsenault, 2008Larivière, C., Gagnon, D., Gravel, D., & Bertrand Arsenault, a. (2008). The assessment of back muscle capacity using intermittent static contractions. Part I - Validity and reliability of electromyographic indices of fatigue. Journal of Electromyography and Kinesiology, 18(6), 1006-19. )iliocostalis lumborum at L3, and longissimus at L1 and T10. According to these authors, during low to moderate forces, the more medially located muscles are more activated. The sustained task for a prolonged period of time leads to a decrease in their capacity to produce force, resulting in fatigue. Thus, the tendency to fatigue of the MT erector muscle could explain the greater inclination value of SCMF.
Furthermore, the difference in the slope coefficient for MF muscle among various muscles can be explained not only by the level of muscle activation or by the muscular load experienced during the task, but also by the characteristics of muscle fibers type (Larivière et al., 2008Larivière, C., Gagnon, D., Gravel, D., & Bertrand Arsenault, a. (2008). The assessment of back muscle capacity using intermittent static contractions. Part I - Validity and reliability of electromyographic indices of fatigue. Journal of Electromyography and Kinesiology, 18(6), 1006-19. ; Mannion et al., 1998; Mannion & Dolan, 1994). During lower load, there is a tendency to recruit proportionally more fatigue-resistant type I fibers (Ng & Richardson, 1996; Tan, Parnianpour, Nordin, Hofer, 1993Tan JC, Parnianpour M, Nordin M, Hofer H, W. B. (1993). Isometric maximal and submaximal trunk extension at different flexed positions in standing. Triaxial torque output and EMG. Spine, 18(16), 2480-90.). It also can be justified by the muscular load experienced (Sparto, Parnianpour, Reinsel, 1997Sparto PJ, Parnianpour M, Reinsel TE, S. S. (1997). Spectral and temporal responses of trunk extensor electromyography to an isometric endurance test. Spine, 22(4), 418-25.), muscle length during the task (Mannion & Dolan, 1996; Mannion & Dolan, 1994), the moment arm between the muscles and deterioration of the afferents inputs from the muscle spindles (Fallentin, Maikala, Banks, Obrien, & Rivard, 2012Fallentin, N., Maikala, R., Banks, J., Obrien, N., & Rivard, A. (2012). Specificity of back muscle response to submaximal fatiguing contractions. Work, 41 Suppl 1, 2539-44.).
For the analysis in the time domain, although there was no difference in SCRMS between the MT and IC muscles, there was an increase in slope coefficient for the two muscles, compatible with muscular effort. However, Barbosa and Gonçalves (2005)Barbosa, F.S.S., & Gonçalves, M. (2005). Fadiga dos músculos eretores da espinha: um estudo eletromiográfico. Revista Fisioterapia e Pesquisa, 12 (2), 6-12. found a higher fatigue index for IC muscles compared to MT muscles, justifying their findings by referring to the predominance of type II muscle fibers in the IC muscle, leading to higher slope coefficients of RMS.
As the recording of muscle EMG was conducted using surface electrodes, we must consider the possibility of crosstalk interference. The presence of crosstalk is inherently associated with the recordings obtained by surface EMG, mainly in the evaluation of nearby muscle groups. In an attempt to minimize this influence, the placement of the electrodes was made strictly according to the standards set by SENIAM (Hermens et al. 1999Hermens, H.J., Freiks, B., Merletti, R., Stegeman, D., Blok, J., Rau, G., Disselhorst-Klug, C., Hägg, G. (1999). European Recommendations for Surface ElectroMyoGraphyNo Title. SENIAM 8 http://www.seniam.org
http://www.seniam.org...
).
The literature offers differing opinions with regard to the capability that surface EMG possesses to detect the activity of the MT muscle. While some experiments have confirmed this possibility (Arokoski, Valta, Kankaanpää, & Airaksinen, 2002Arokoski, J. P. a, Valta, T., Kankaanpää, M., & Airaksinen, O. (2002). Activation of paraspinal and abdominal muscles during manually assisted and nonassisted therapeutic exercise. American Journal of Physical Medicine & Rehabilitation, 81(5), 326-35. ), others argue that the implementation of intramuscular electrodes is necessary to record the EMG activity of this muscle (Stokes, Henry, & Single, 2003Stokes, I. A. F., Henry, S. M., & Single, R. M. (2003). Surface EMG electrodes do not accurately record from lumbar multifidus muscles. Clinical Biomechanics, 18(1), 9-13. ). However, Ng and Richardson (1996) suggested that a modified Biering-Sorensen test analysis, using the EMG power spectrum, may be a suitable method to measure the rate of fatigue of the lumbar muscles if the crosstalk is minimized, and concluded that the measurement of MT muscle fatigue could still be a useful clinical measure. In addition, several studies have shown the reliability of EMG spectral analysis during the Biering-Sorensen test (Dolan, Mannion, & Adams, 1995; Koumantakis, Arnall, Cooper, & Oldham, 2001Koumantakis, G. a, Arnall, F., Cooper, R. G., & Oldham, J. a. (2001). Paraspinal muscle EMG fatigue testing with two methods in healthy volunteers. Reliability in the context of clinical applications. Clinical Biomechanics, 16(3), 263-6. ; Tekin et al., 2009Tekin, Y., Ortancil, O., Ankarali, H., Basaran, A., Sarikaya, S., & Ozdolap, S. (2009). Biering-Sorensen test scores in coal miners. Joint, Bone, Spine: Revue du Rhumatisme, 76(3), 281-5.).
Therefore, we believe that the use of surface EMG and the analysis in the frequency domain (MF) associated with the Biering-Sorensen test remains important and amenable to clinical use, both to verify differences between lumbar muscles, as well as to monitor the development of exercise programs for lumbopelvic stabilization.
Conclusion
The analysis in the frequency domain for the surface EMG of the MT, LG, and IC muscles during the Biering-Sorensen test demonstrated differences between the MT and the erector LG and IC muscles. However, the analysis in the time domain (RMS) did not allow for this observation.
As the values of the slope coefficients of the median frequency (MF) were higher for the MT muscle, compared to the LG and IC muscles, this suggests an increased tendency of muscle fatigue. Therefore, considering the methodology, the study of EMG signals in the frequency domain should be considered as an instrument to assess fatigue of the spinal extensor muscles in clinical situations.
This research was supported by FAPESP (Fundação de Amparo à Pesquisa Do Estado de São Paulo), Grant number: 07/57579-0
References
- Alaranta, H., Hurri, H., Heliövaara, M., Soukka, A., & Harju, R. (1994). Non-dynamometric trunk performance tests: reliability and normative data. Scandinavian Journal of Rehabilitation Medicine, 26(4), 211-5.
- Al-Mulla, M. R., Sepulveda, F., & Colley, M. (2011). A review of non-invasive techniques to detect and predict localised muscle fatigue. Sensors (Basel, Switzerland), 11(4), 3545-94.
- Arokoski, J. P. a, Valta, T., Kankaanpää, M., & Airaksinen, O. (2002). Activation of paraspinal and abdominal muscles during manually assisted and nonassisted therapeutic exercise. American Journal of Physical Medicine & Rehabilitation, 81(5), 326-35.
- Barbosa, F.S.S., & Gonçalves, M. (2005). Fadiga dos músculos eretores da espinha: um estudo eletromiográfico. Revista Fisioterapia e Pesquisa, 12 (2), 6-12.
- Biedermann HJ, Shanks GL, Forrest WJ, I. J. (1991). Power spectrum analyses of electromyographic activity. Discriminators in the differential assessment of patients with chronic low-back pain. Spine, 16(10), 1179-84.
- Coorevits, Pascal, Danneels, L., Cambier, D., Ramon, H., & Vanderstraeten, G. (2008). Assessment of the validity of the Biering-Sørensen test for measuring back muscle fatigue based on EMG median frequency characteristics of back and hip muscles. Journal of Electromyography and Kinesiology, 18(6), 997-1005.
- Coorevits, PLM, Danneels, L., Ramon, H., Van Audekercke, R., Cambier, D., & Vanderstraeten, G. (2005). Statistical modelling of fatigue-related electromyographic median frequency characteristics of back and hip muscles during a standardized isometric back extension test. Journal of Electromyography and Kinesiology, 15(5), 444-51.
- Cox, J. M. (2002). Dor lombar: mecanismo, diagnóstico e tratamento (6.ed., pp. 653-678). São Paulo: Manole.
- Dagenais, S., Caro, J., & Haldeman, S. (2008). A systematic review of low back pain cost of illness studies in the United States and internationally. The Spine Journal, 8(1), 8-20.
- De Lucca, C. (1997). The use of surface eletromyography in biomechanics. Journal of Applied Biomechanics, (13), 135-163.
- Demoulin, C., Vanderthommen, M., Duysens, C., & Crielaard, J.-M. (2006). Spinal muscle evaluation using the Sorensen test: a critical appraisal of the literature. Joint, Bone, Spine, 73(1), 43-50.
- Dolan, P., Mannion, A., & Adams, M. (1995). Fatigue of the erector spinae muscles. A quantitative assessment using "frequency banding" of the surface electromyography signal. Spine, 20(2), 149-59.
- Ebadi, S., Ansari, N. N., Naghdi, S., Jalaei, S., Sadat, M., Bagheri, H., Fallah, E. (2012). The effect of continuous ultrasound on chronic non-specific low back pain: a single blind placebo-controlled randomized trial. BMC Musculoskeletal Disorders, 13(1), 192.
- Fallentin, N., Maikala, R., Banks, J., Obrien, N., & Rivard, A. (2012). Specificity of back muscle response to submaximal fatiguing contractions. Work, 41 Suppl 1, 2539-44.
- França, F. J. R., Burke, T. N., Claret, D. C., & Marques, A. P. (2008). Estabilização segmentar da coluna lombar nas lombalgias : uma revisão bibliográfica e um programa de exercícios. Fisioterapia e Pesquisa,15(2), 200-206.
- Freeman, M. D., Woodham, M. a, & Woodham, A. W. (2010). The role of the lumbar multifidus in chronic low back pain: a review. PM & R: the journal of injury, function, and rehabilitation, 2(2), 142-6; quiz 1 p following 167.
- Hermens, H.J., Freiks, B., Merletti, R., Stegeman, D., Blok, J., Rau, G., Disselhorst-Klug, C., Hägg, G. (1999). European Recommendations for Surface ElectroMyoGraphyNo Title. SENIAM 8 http://www.seniam.org
» http://www.seniam.org - Hides, J. A., Jull, G. A., & Richardson, C. A. (2001). Long-term effects of specific stabilizing exercises for first-episode low back pain. Spine, 26(11), 243-248.
- Hides, J. A., Richardson, C. A., & Jull, G. A. (1996). Multifidus muscle recovery is not automatic fafter resolution of acute, first-episode low back pain. Spine, 21(23): 2763-9.
- Hoy, D., Bain, C., Williams, G., March, L., Brooks, P., Blyth, F., Buchbinder, R. (2012). A systematic review of the global prevalence of low back pain. Arthritis and Rheumatism, 64(6), 2028-37.
- Hoy, D., Brooks, P., Blyth, F., & Buchbinder, R. (2010). The epidemiology of low back pain. Best Practice & Research. Clinical Rheumatology, 24(6), 769-81.
- Koumantakis, G. a, Arnall, F., Cooper, R. G., & Oldham, J. a. (2001). Paraspinal muscle EMG fatigue testing with two methods in healthy volunteers. Reliability in the context of clinical applications. Clinical Biomechanics, 16(3), 263-6.
- Larivière, C., Gagnon, D., Gravel, D., & Bertrand Arsenault, a. (2008). The assessment of back muscle capacity using intermittent static contractions. Part I - Validity and reliability of electromyographic indices of fatigue. Journal of Electromyography and Kinesiology, 18(6), 1006-19.
- Latimer, J., Maher, C. G., Refshauge, K., & Colaco, I. (1999). The reliability and validity of the Biering-Sorensen test in asymptomatic subjects and subjects reporting current or previous nonspecific low back pain. Spine, 24(20), 2085-9.
- Manchikanti, L., Singh, V., Datta, S., Cohen, S. P., & Hirsch, J. A. (2009). Comprehensive review of epidemiology, scope, and impact of spinal pain. Pain Physician, 12(4), E35-70.
- Mannion, a F., & Dolan, P. (1996). The effects of muscle length and force output on the EMG power spectrum of the erector spinae. Journal of Electromyography and Kinesiology, 6(3), 159-68.
- Mannion, a F., Dumas, G. a, Stevenson, J. M., & Cooper, R. G. (1998). The influence of muscle fiber size and type distribution on electromyographic measures of back muscle fatigability. Spine, 23(5): 576-84.
- Mannion, A., & Dolan, P. (1994). Electromyographic median frequency changes during isometric contraction of the back extensors to fatigue. Spine, 19(11), 1223-9.
- Merletti, R., Lo Conte, L. R., & Orizio, C. (1991). Indices of Muscle Fadigue. Journal of Electromyography and Kinesiology, 1(1), 20-33.
- Moreau, C. E., Green, B. N., Johnson, C. D., & Moreau, S. R. (2001). Isometric back extension endurance tests: a review of the literature. Journal of Manipulative and Physiological Therapeutics, 24(2), 110-22.
- Nassif, H., Brosset, N., Guillaume, M., Delore-Milles, E., Tafflet, M., Buchholz, F., & Toussaint, J.-F. (2011). Evaluation of a randomized controlled trial in the management of chronic lower back pain in a French automotive industry: an observational study. Archives of Physical Medicine and Rehabilitation, 92(12), 1927-1936. e4.
- Ng, J. K., & Richardson, C. a. (1996). Reliability of electromyographic power spectral analysis of back muscle endurance in healthy subjects. Archives of Physical Medicine and Rehabilitation, 77(3), 259-64.
- Ng, J. K., Richardson, C. a, & Jull, G. a. (1997). Electromyographic amplitude and frequency changes in the iliocostalis lumborum and multifidus muscles during a trunk holding test. Physical Therapy, 77(9), 954-61.
- O'Sullivan, P.O. (2000). Lumbar segmental 'instability': clinical presentation and specific stabilizing exercise management. Manual Therapy, 5 (1), 2-12.
- Panjabi, M. M. (2003). Clinical spinal instability and low back pain. Journal of Electromyography and Kinesiology, 13(4), 371-379.
- Sparto PJ, Parnianpour M, Reinsel TE, S. S. (1997). Spectral and temporal responses of trunk extensor electromyography to an isometric endurance test. Spine, 22(4), 418-25.
- Stokes, I. A. F., Henry, S. M., & Single, R. M. (2003). Surface EMG electrodes do not accurately record from lumbar multifidus muscles. Clinical Biomechanics, 18(1), 9-13.
- Sung, P. S. (2003). Multifidi muscles median frequency before and after spinal stabilization exercises. Archives of Physical Medicine and Rehabilitation, 84(9), 1313-1318.
- Sung, P. S. (2013). Disability and back muscle fatigability changes following two therapeutic exercise interventions in participants with recurrent low back pain. Medical Science Monitor: International Medical Journal of Experimental and Clinical Research, 19, 40-8.
- Tan JC, Parnianpour M, Nordin M, Hofer H, W. B. (1993). Isometric maximal and submaximal trunk extension at different flexed positions in standing. Triaxial torque output and EMG. Spine, 18(16), 2480-90.
- Tekin, Y., Ortancil, O., Ankarali, H., Basaran, A., Sarikaya, S., & Ozdolap, S. (2009). Biering-Sorensen test scores in coal miners. Joint, Bone, Spine: Revue du Rhumatisme, 76(3), 281-5.
- Van Dieën JH, Toussaint HM, Thissen C, van de V. A. (1993). Spectral analysis of erector spinae EMG during intermittent isometric fatiguing exercise. Ergonomics, 36(4), 407-14.
- Wilke, H., Wolf, S., Claes, L., Arand, M., & Wiesend, A. (1995). Stability increase of the lumbar spine with different muscle groups. A biomechanical in vitro study. Spine, 20(2), 192-8.
Publication Dates
-
Publication in this collection
Jan-Mar 2014
History
-
Received
02 May 2013 -
Accepted
28 Jan 2014