Abstract
The oxidative action of chemical substances present in dairy products may contribute to the darkening of the product. Product color is one of the first factors to be considered by the consumer for acceptance or rejection. In the food industry, the color parameter is measured using colorimeters and spectrophotometers; nevertheless, the use of digital images for colorimetric tests has been surveyed in the food area. Therefore, the present work aimed at investigating for 45 days the chemical, physicochemical and colorimetric alterations of creamy dairy dessert with white chocolate flavor and strawberry-flavored yogurt. These alterations were monitored by the analysis of the parameters pH, acidity, soluble solids content, in addition to spectroscopy in the middle-infrared region and digital images. The data collected were processed in a computational environment applying chemometric tools. As result, it was verified that there were alterations in the parameters evaluated; nonetheless, the acidity of the dairy dessert remained constant during the storage period. From the Principal Component Analysis (PCA) using the color variables, it was observed that the samples were grouped and separated by type and storage time in agreement with the visually observed colorimetric modifications.
Keywords:
Food industry; Monitoring; Colorimetry; Digital image; Chemometric tools; In Dairy Quality
Resumo
A ação oxidativa de substâncias químicas presentes em produtos lácteos pode contribuir para o escurecimento do produto. A cor do produto é um dos primeiros fatores a serem considerados pelo consumidor para a aceitação ou a rejeição. Na indústria de alimentos, o parâmetro cor é medido através de colorímetros e espectrofotômetros; no entanto, o uso de imagens digitais para testes colorimétricos vem sendo pesquisado na área alimentícia. Desta forma, o presente trabalho tem por objetivo investigar, durante 45 dias, as alterações químicas, físico-químicas e colorimétricas de sobremesa láctea cremosa sabor chocolate branco e iogurte sabor morango. Essas alterações foram monitoradas por meio da análise dos parâmetros pH, acidez, teor de sólidos solúveis, além de espectroscopia na região do infravermelho médio e de imagens digitais. Os dados coletados foram processados em ambiente computacional aplicando ferramentas quimiométricas. Como resultado, constatou-se que houve alterações nos parâmetros avaliados e que, no entanto, a acidez da sobremesa láctea manteve-se constante durante o tempo de armazenamento. A partir da Análise de Componentes Principais utilizando as variáveis de cor, foi observado que as amostras foram agrupadas e separadas por tipo e tempo de armazenamento, em concordância com as modificações colorimétricas visualmente observadas.
Palavras-chave:
Indústria de alimentos; Monitoramento; Colorimetria; Imagem digital; Ferramentas quimiométricas; Qualidade de laticínios
Highlights
The use of digital camera is considered viable to investigate the oxidative stability of foods.
1 Introduction
Consumers are increasingly demanding and mindful of their health and well-being. Therefore, natural products aimed at healthy eating, as well as those with rapid ingestion, are booming in the market. With the high demand for these products, food industries need to constantly optimize and guarantee the quality of their products, to meet consumers’ demands and thus remain competitive in the market. Based on this, dairy goods produced from milk fermentation, such as yogurts and dairy desserts, become prominent in the food segment for providing good digestive functioning (Yilmaz-Ersan et al., 2019Yilmaz-Ersan, L., Ozcan, T., Akpinar-Bayizit, A., Mansri, C., Topcuoglu, E., Karaman, S., & Ozdemir, T. (2019). The evaluation of the textural and sensorial properties of chocolate dairy dessert. Journal of Animal Husbandry and Dairy Science, 3(1), 9-13.)
Foods have several properties related to appearance and quality, such as: consistency; flavor; nutritional composition; odor; and color (Russ, 2015Russ, J. C. (2015). Image analysis of foods. Journal of Food Science, 80(9), E1974-1987. PMid:26270611. http://dx.doi.org/10.1111/1750-3841.12987
http://dx.doi.org/10.1111/1750-3841.1298...
). The oxidative actions of some microorganisms and chemical substances present in dairy products can alter their levels of acidity and pH, contributing to the darkening of the product (Spagnol et al., 2018Spagnol, W. A., Silveira, V., Pereira, E., & Guimarães Filho, N. (2018). Monitoramento da cadeia do frio: novas tecnologias e recentes avanços. Brazilian Journal of Food Technology, 21, 2-8. http://dx.doi.org/10.1590/1981-6723.6916
http://dx.doi.org/10.1590/1981-6723.6916...
). Thus, the parameter color, which constitutes one of the first factors considered by the consumer, directly influences the acceptance or rejection of the product observed (Fernandes et al., 2011Fernandes, S. S., Coelho, R. S., Franco, R. M., Barbosa, C. G., & Luches, E. R. H. (2011). Monitoramento da microbiota de iogurtes comerciais. Revista do Instituto de Latícinios Cândido Tostes, 382(66), 5-11.). Therefore, there is a need for strict control under several conditions, from the processing stage to its commercialization to guarantee quality and, consequently, consumer health (Silva et al., 2018Silva, P. H. A., Gonçalves, M. C., & Chaves, K. S. (2018). Características físico-químicas e sensoriais de iogurte firme e sobremesa láctea fermentada com doce de caju. Higiene Alimentar, 32, 123-127.).
Several techniques and procedures can be employed for the quality control of dairy products, one of which is colorimetric analysis with the help of a colorimeter, using reagents and standards (Kalinin et al., 2013Kalinin, A., Krasheninnikov, V., Sadovskiy, S., & Yurova, E. (2013). Determining the composition of proteins in milk using a portable near infrared spectrometer. Journal of Near Infrared Spectroscopy, 21(5), 409-415. http://dx.doi.org/10.1255/jnirs.1054
http://dx.doi.org/10.1255/jnirs.1054...
). According to Oliveira et al. (2011)Oliveira, L. C., Souza, S. O., & Mamede, M. E. O. (2011). Avaliação das características físico-químicas e colorimétricas de vinhos finos de duas principais regiões vinícolas do Brasil. Revista do Instituto Adolfo Lutz, 70(2), 158-167. the use of colorimeters has been frequently employed to verify the color of different beverages, such as wine and soluble coffee, juices, and products. Although the classical analysis for the evaluation of the parameter color in dairy products uses commercial colorimeters, its high cost and the need for reagents become the main disadvantages of the employment of this technique (Kalinin et al., 2013Kalinin, A., Krasheninnikov, V., Sadovskiy, S., & Yurova, E. (2013). Determining the composition of proteins in milk using a portable near infrared spectrometer. Journal of Near Infrared Spectroscopy, 21(5), 409-415. http://dx.doi.org/10.1255/jnirs.1054
http://dx.doi.org/10.1255/jnirs.1054...
). Infrared spectroscopy with Fourier transform has been widely applied in studies for the verification of the quality control of food products. Among the advantages, it stands out for being economical, fast, and especially for being a technique of Non-Destructive Testing (NDT) which, coupled with chemometrics, can assist in food quality control (Salleh et al., 2019Salleh, N. A., Selamat, J., Meng, G. Y., Abas, F., Jambari, N. N., & Khatib, A. (2019). Fourier transform infrared spectroscopy and multivariate analysis of milk from different goat breeds. International Journal of Food Properties, 22(1), 1673-1683. http://dx.doi.org/10.1080/10942912.2019.1668803
http://dx.doi.org/10.1080/10942912.2019....
).
Nevertheless, considering that the color of the foods is influenced by the presence of different pigments and physicochemical alterations, technologically-advanced methods are under study to proportionate the processes of analyses fast, easy to handle and without the use of reagents, or minimizing it, offering to the food industry ability and quality in the process of quality control (Motta et al., 2015Motta, J. D., Melo Queiroz, A. J., Figueirêdo, R. M. F., & Sousa, K. D. S. M. (2015). Índice de cor e sua correlação com parâmetros físicos e físico-químicos de goiaba, manga e mamão. Comunicata Scientiae, 6(1), 74-82.).
In this scenario, Lodha et al. (2014)Lodha, A., Pandya, A., Sutariya, P. G., & Menon, S. K. (2014). A smart and rapid colorimetric method for the detection of codeine sulphate, using unmodified gold nanoprobe. RSC Advances, 4(92), 50443-50448. http://dx.doi.org/10.1039/C4RA06269H
http://dx.doi.org/10.1039/C4RA06269H...
emphasized that in the last decade, the use of digital images from digital cameras in smartphones has been applied to perform quantitative colorimetric tests with application in diverse fields of Science and Technology, such as Chemistry; Agronomy; and Engineerings. This derives from the increase in the supply of portable cell phones with very high-quality digital cameras, whose value is accessible, making it an important tool for the construction of analytical chemical systems with fast data transmission and processing, presenting satisfactory results (Gonçalves Dias Diniz, 2020Gonçalves Dias Diniz, P. H. (2020). Chemometrics-assisted color histogram-based analytical systems. Journal of Chemometrics, 34(12), 1-27. http://dx.doi.org/10.1002/cem.3242
http://dx.doi.org/10.1002/cem.3242...
).
As a pathway to evaluate the quality of diverse foods and beverages, such as coffee (Souto et al., 2015Souto, U. T., Barbosa, M. F., Dantas, H. V., Pontes, A. S., Lyra, W. S., Diniz, P. H. G. D., de Araújo, M. C. U., & Silva, E. C. (2015). Screening for coffee adulteration using digital images and SPA-LDA. Food Analytical Methods, 8(6), 1515-1521. http://dx.doi.org/10.1007/s12161-014-0020-7
http://dx.doi.org/10.1007/s12161-014-002...
); cachaça (Sousa Fernandes et al., 2019Sousa Fernandes, D. D., Almeida, V. E., Fontes, M. M., Araújo, M. C. U., Véras, G., & Diniz, P. H. G. D. (2019). Simultaneous identification of the wood types in aged cachaças and their adulterations with wood extracts using digital images and SPA-LDA. Food Chemistry, 273, 77-84. https://doi.org/10.1016/j.foodchem.2018.02.035
https://doi.org/10.1016/j.foodchem.2018....
); hamburgers (Fernandes et al., 2019Fernandes, D. D. S., Romeo, F., Krepper, G., Di Nezio, M. S., Pistonesi, M. F., Centurión, M. E., Araújo, M. C. U., & Diniz, P. H. G. D. (2019). Quantification and identification of adulteration in the fat content of chicken hamburgers using digital images and chemometric tools. Lwt, 100, 20-27. http://dx.doi.org/10.1016/j.lwt.2018.10.034
http://dx.doi.org/10.1016/j.lwt.2018.10....
); and milk (Pereira et al., 2020Pereira, E. V. S., Fernandes, D. D. S., Araújo, M. C. U., Diniz, P. H. G. D., & Maciel, M. I. S. (2020). Simultaneous determination of goat milk adulteration with cow milk and their fat and protein contents using NIR spectroscopy and PLS algorithms. Lwt, 127, 109427. https://doi.org/10.1016/j.lwt.2020.109427
https://doi.org/10.1016/j.lwt.2020.10942...
). In fact, the method of analysis employing digital images has been presented satisfactory results according to the data published in the literature. Thus, the use of digital cameras in smartphones can be considered a viable and alternative tool to investigate the oxidative stability of the most varied foods, as opposed to traditional methods usually employed to evaluate the parameter color in this type of matrix, since the implementation of new, accessible, fast, portable and cheap methods for quality control and the establishment of an identity standard is of great importance for the food industry.
Aiming to the investigation of the chemical, physicochemical and colorimetric characteristics of the products creamy dairy dessert with white chocolate flavor and strawberry-flavored yogurt, it could be noted that analyses of the parameters pH, acidity and Total Soluble Solids (TSS) contents were performed, besides spectroscopy in the middle-infrared region (Fourrier-Transform Infrared Spectroscopy (FTIR)) and digital images, given the fast and non-destructive nature of this technique and the small volume of sample required.
2 Material and methods
2.1 Sample acquisition
The samples of strawberry-flavored yogurt with the addition of fruit and creamy dairy dessert with white chocolate flavor were selected, and a total of four different lots were analyzed based on the supply logistics of the manufacturer, located in the city of Poços de Caldas, in the Minas Gerais state. The samples, closed in the original packaging, were stored under refrigeration at the temperature of 5 °C and, subsequently, submitted to the stability tests and physicochemical characterization.
2.2 Chemical and physicochemical characterization
The samples from four different lots of the selected dairy products underwent characterization at the beginning of storage, in other words, on the day they were manufactured and provided (day zero) until the expiration date informed by the manufacturer (45 days) at intervals of 15 days. It is important to highlight that, to perform the analyses, the products were left out of refrigeration until they reached room temperature and, subsequently, directly taken from the closed package. The methodology adopted was based on the instructions from the Adolfo Lutz Institute (IAL) (Zenebon & Pascuet, 2008Zenebon, O., & Pascuet, N. S. (2008). Métodos físicos-quimicos para análise de alimentos. São Paulo: Instituto Adolfo Lutz.) and the Normative Instruction Nº 68 of the Ministry of Agriculture, Livestock and Supply (MAPA) (Brasil, 2006Brasil. Ministério da Agricultura, Pecuária e Abastecimento. (2006). Métodos analíticos oficiais físico-químicos, para controle de leite e produtos lácteos (Instrução Normativa no 68, de 12 de dezembro de 2006). Diário Oficial [da] República Federativa do Brasil, Brasília. Retrieved in 2021, March 21, from https://wp.ufpel.edu.br/inspleite/files/2016/03/Instrução-normativa-n°-68-de-12-dezembro-de-2006.pdf
https://wp.ufpel.edu.br/inspleite/files/...
). The data obtained were processed using the software Origin version 8.
2.2.1 Spectroscopic screening in the middle-infrared region
In order to understand the chemical composition and follow the possible alterations of the products strawberry-flavored yogurt and creamy dairy dessert with white chocolate flavor of the first lot, the samples were submitted to direct analyze no sample preparation in a Fourier transform spectrometer model Cary 630 zinc selenide, in the spectral region between 4000 and 400 cm–1, with the resolution of 1.93 cm–1.
2.2.2 pH
The measurement of pH was determined by the potentiometric method, in which a bench pH meter was used (brand MS Tcnopon instrumentação), resolution 0.01, and the equipment was calibrated using the buffer solutions of pH 4.0 and 7.0 and, subsequently, the direct read of pH was performed placing the combined glass electrode in contact with the sample, which was in a properly filled 50 mL backer (Egea et al., 2019Egea, M. B., Gomes, A. C. G., Lima, M. S., & Takeuchi, K. P. (2019). Relação entre as características físico-químicas e reológica e o valor comercial de iogurte integral com sabor morango. Segurança Alimentar e Nutricional, 26(64), e019003. http://dx.doi.org/10.20396/san.v26i0.8652948
http://dx.doi.org/10.20396/san.v26i0.865...
).
2.2.3 Titrable Acidity and Total Soluble solids content (°Brix)
Titrable acidity was performed according to the Normative Instruction Nº 68 (Brasil, 2006Brasil. Ministério da Agricultura, Pecuária e Abastecimento. (2006). Métodos analíticos oficiais físico-químicos, para controle de leite e produtos lácteos (Instrução Normativa no 68, de 12 de dezembro de 2006). Diário Oficial [da] República Federativa do Brasil, Brasília. Retrieved in 2021, March 21, from https://wp.ufpel.edu.br/inspleite/files/2016/03/Instrução-normativa-n°-68-de-12-dezembro-de-2006.pdf
https://wp.ufpel.edu.br/inspleite/files/...
). A total of 5 g of the sample were weighed in a 50 mL becker, and using a graduated pipette, approximately 5 mL of distilled water were added to the sample, following homogenization of the solution. Subsequently, 5 drops of a phenolphthalein solution at 1% were added. Titration was performed with a sodium hydroxide solution at 0.1 mol/L using a 25 mL burette until the appearance of pink coloration. Three repetitions were performed for each sample analyzed.
The TSS content of the samples was determined by a calibrated portable digital refractometer- DR301-95 Kruss (Egea et al., 2019Egea, M. B., Gomes, A. C. G., Lima, M. S., & Takeuchi, K. P. (2019). Relação entre as características físico-químicas e reológica e o valor comercial de iogurte integral com sabor morango. Segurança Alimentar e Nutricional, 26(64), e019003. http://dx.doi.org/10.20396/san.v26i0.8652948
http://dx.doi.org/10.20396/san.v26i0.865...
).
2.3 Analysis of the dairy products using color histograms
Digital images of the samples of creamy dairy dessert with white chocolate flavor and strawberry-flavored yogurt were registered, using a fully sealed wooden box with a black interior and white bottom, with only one side of the box being mobile, a LED lamp for lighting and a smartphone (Model: iPhone 5s. Brand: Apple, camera with a resolution of 8 megapixels). The samples were transferred to a Petri dish and then inserted inside the box, and the smartphone was fixed to a clamp on the rod of the box.
Digital image processing was performed using the software Matlab® employing Toolbox imagens_GUI (developed by the Laboratory of Automation and Instrumentation in Analytical Chemistry and Chemometrics (LAQA) of the Federal University of Paraíba), thus acquiring the image data in the MAT format. Grayscale histograms, RGB (Red, Green and Blue) and HSV (Hue, Saturation, Value) were extracted from all images. Subsequently, the matrices were converted to the format compatible with the program Unscrambler 9.7, thus calculating the means of the variables obtained and then performing a Principal Component Analysis employing the method of Full Cross-Validation (complete cross-validation).
3 Results and discussion
3.1 Creamy dairy dessert with white chocolate flavor
3.1.1 Spectroscopic screening in the mid-infrared region
According to the information provided by the manufacturer, found in the label of the creamy dairy dessert with white chocolate flavor, the main ingredients in its formulation were: whole milk; sugar; milk cream; modified starch; powdered milk whey; powdered skimmed milk; starch; flavorings; disodium phosphate acidity regulator; tetrasodium pyrophosphate stabilizer; and carrageenan thickener. The investigation regarding the responsibility of the product’s components during the deterioration over time was obtained by monitoring the spectra in the middle-infrared region, which is presented in Figure 1.

Based on the spectra obtained, the presence of typical frequencies referring to the structural characteristics of the milk organic molecules (the main raw material of dairy products) is observed. It is possible to verify in Figure 1 the presence of an absorption peak in the region of 3250 cm-1, because of the strong vibrations in the symmetrical stretching of the group νs(OH), indicating the presence of water and possibly carboxylic acid responsible for the formation of milk fat, this same observation was described by Lei et al. (2010)Lei, Y., Zhou, Q., Zhang, Y. L., Chen, J. B., Sun, S. Q., & Noda, I. (2010). Analysis of crystallized lactose in milk powder by Fourier-transform infrared spectroscopy combined with two-dimensional correlation infrared spectroscopy. Journal of Molecular Structure, 974(1-3), 88-93. http://dx.doi.org/10.1016/j.molstruc.2009.12.030
http://dx.doi.org/10.1016/j.molstruc.200...
analyzing lactose in powdered milk.
At the wavelength around 2983 cm-1, the presence of a νas(CH2) groups is observed, with vibrations in the asymmetrical stretching responsible for the formation of sugar and fat compound (Coitinho et al., 2017Coitinho, T. B., Cassoli, L. D., Cerqueira, P. H. R., da Silva, H. K., Coitinho, J. B., & Machado, P. F. (2017). Adulteration identification in raw milk using Fourier transform infrared spectroscopy. Journal of Food Science and Technology, 54(8), 2394-2402. PMid:28740297. http://dx.doi.org/10.1007/s13197-017-2680-y
http://dx.doi.org/10.1007/s13197-017-268...
). Among 2854 cm-1 and 2855 cm-1, the absorption band reveals the presence of symmetrical vibrations of the compound νs(CH2), also responsible for fat. A little intense peak was found at 2350 cm-1 because of the symmetrical stretching vibrations of νs(CH2), also attributed to fat formation.
An absorption peak at 1747 cm-1 can be related to the stretching of the group ν(C=O), responsible for the formation of the fat compound, according to the data observed by Coitinho et al. (2017)Coitinho, T. B., Cassoli, L. D., Cerqueira, P. H. R., da Silva, H. K., Coitinho, J. B., & Machado, P. F. (2017). Adulteration identification in raw milk using Fourier transform infrared spectroscopy. Journal of Food Science and Technology, 54(8), 2394-2402. PMid:28740297. http://dx.doi.org/10.1007/s13197-017-2680-y
http://dx.doi.org/10.1007/s13197-017-268...
who monitored milk with and without adulteration employing FTIR and detected bands referring to fats in the same length ranges as the present study. On August 17th, 2020, the Normative Instruction Nº 84 was published in the Official Journal of the Union (Brasil, 2020Brasil. Ministério da Agricultura, Pecuária e Abastecimento, Secretaria de Defesa Agropecuária. (2020). Dispõe sobre a identidade e os requisitos de qualidade, que deve apresentar o produto denominado sobremesa láctea (Instrução Normativa nº 84, de 17 de agosto de 2020). Diário Oficial [da] República Federativa do Brasil, Brasília. Retrieved in 2021, March 21, from https://www.in.gov.br/en/web/dou/-/instrucao-normativa-no-84-de-17-de-agosto-de-2020-273462951
https://www.in.gov.br/en/web/dou/-/instr...
) which determines that dairy desserts must present more than 50% (w/w-1) of milk in the product, and for this reason, the bands observed are identical to those of milk.
At 1239 cm-1, there is the formation of a band with moderate intensity, probably associated with the axial deformation of the C-O bond present in sucrose. A band with medium intensity is observed at 1126 cm-1, possibly associated with the vibration of axial deformation of the system C-O-C of the bond between fructose and glucose for sucrose formation (Coitinho et al., 2017Coitinho, T. B., Cassoli, L. D., Cerqueira, P. H. R., da Silva, H. K., Coitinho, J. B., & Machado, P. F. (2017). Adulteration identification in raw milk using Fourier transform infrared spectroscopy. Journal of Food Science and Technology, 54(8), 2394-2402. PMid:28740297. http://dx.doi.org/10.1007/s13197-017-2680-y
http://dx.doi.org/10.1007/s13197-017-268...
).
The sample contains starch (C6H10O5)n according to the manufacturer, whose region of absorption is at 1148 cm-1. The bands related to the proteins present in the sample appear around 1645 cm-1, referring to the vibrations of amide I in proteins present in dairy products (Moros et al., 2006Moros, J., Iñón, F. A., Khanmohammadi, M., Garrigues, S., & De La Guardia, M. (2006). Evaluation of the application of attenuated total reflectance-Fourier transform infrared spectrometry (ATR-FTIR) and chemometrics to the determination of nutritional parameters of yogurt samples. Analytical and Bioanalytical Chemistry, 385(4), 708-715. PMid:16741770. http://dx.doi.org/10.1007/s00216-006-0418-1
http://dx.doi.org/10.1007/s00216-006-041...
). Regarding total fats, according to Salleh et al., (2019)Salleh, N. A., Selamat, J., Meng, G. Y., Abas, F., Jambari, N. N., & Khatib, A. (2019). Fourier transform infrared spectroscopy and multivariate analysis of milk from different goat breeds. International Journal of Food Properties, 22(1), 1673-1683. http://dx.doi.org/10.1080/10942912.2019.1668803
http://dx.doi.org/10.1080/10942912.2019....
bands 1451.1 cm-1 and 1075.4 cm-1 are associated with fats; therefore, in this same wavelength range, the spectra (Figure 1) presented a medium intensity, indicating association with the total fats present in the studied sample.
3.1.2 Titrable Acidity and pH
Regarding the acidity of the samples of creamy dairy dessert with white chocolate flavor, it was observed that it remained constant from 15 days until 45 days of storage, indicating the value of 0.20 (g/100 g) for the three first lots and 0.1 (g/100 g) for the last lot. Lots 1 and 2, 3 and 4 presented the same behavior, indicating a stronger acidity at time 0, in other words, on the day the product was manufactured, and according to Almeida Neta et al. (2018)Almeida Neta, M. C., Rocha de Queiroga, A. P., Almeida, R. L. J., Caetano Soares, A., Marinho Gonçalves, J., Soares Fernandes, S., de Sousa, M. C., Olbrich Dos Santos, K. M., Alonso Buriti, F. C., & Rolim Florentino, E. (2018). Fermented dessert with whey, ingredients from the peel of Jabuticaba (Myrciaria cauliflora) and an indigenous culture of lactobacillus plantarum: composition, microbial viability, antioxidant capacity and sensory features. Nutrients, 10(9), 1-19. PMid:30200532. http://dx.doi.org/10.3390/nu10091214
http://dx.doi.org/10.3390/nu10091214...
this was attributed to the short time of action of the acidity stabilizer added to the product. Furthermore, the product contains the probiotic Lactobacillus Acidophilus, which promotes slower acidification after its processing, hence, helps to keep the count of probiotic bacteria until the end of storage, thus justifying the stabilized acidity.
It is important to highlight that the Ministry of Agriculture, Livestock, and Supply (Ministério da Agricultura, Pecuária e Abastecimento (MAPA)), up to date of obtaining the data of this work, has not attributed a specific Normative Instruction for dairy desserts; thus, the quality parameters were based on the Normative for the control of milk and dairy in general (Brasil, 2006Brasil. Ministério da Agricultura, Pecuária e Abastecimento. (2006). Métodos analíticos oficiais físico-químicos, para controle de leite e produtos lácteos (Instrução Normativa no 68, de 12 de dezembro de 2006). Diário Oficial [da] República Federativa do Brasil, Brasília. Retrieved in 2021, March 21, from https://wp.ufpel.edu.br/inspleite/files/2016/03/Instrução-normativa-n°-68-de-12-dezembro-de-2006.pdf
https://wp.ufpel.edu.br/inspleite/files/...
). Nevertheless, meeting the need to regulate the segment of the product studied, MAPA published in August 2020 the Normative Instruction Nº 84 (Brasil, 2020Brasil. Ministério da Agricultura, Pecuária e Abastecimento, Secretaria de Defesa Agropecuária. (2020). Dispõe sobre a identidade e os requisitos de qualidade, que deve apresentar o produto denominado sobremesa láctea (Instrução Normativa nº 84, de 17 de agosto de 2020). Diário Oficial [da] República Federativa do Brasil, Brasília. Retrieved in 2021, March 21, from https://www.in.gov.br/en/web/dou/-/instrucao-normativa-no-84-de-17-de-agosto-de-2020-273462951
https://www.in.gov.br/en/web/dou/-/instr...
) which fixes the identity and the quality requirements that dairy desserts must present. Thus, the dairy dessert heat treated after fermentation, with additions (characteristic of the samples in this work), must have from 0.6 to 2 g of lactic acid per 100 g of product (Brasil, 2020Brasil. Ministério da Agricultura, Pecuária e Abastecimento, Secretaria de Defesa Agropecuária. (2020). Dispõe sobre a identidade e os requisitos de qualidade, que deve apresentar o produto denominado sobremesa láctea (Instrução Normativa nº 84, de 17 de agosto de 2020). Diário Oficial [da] República Federativa do Brasil, Brasília. Retrieved in 2021, March 21, from https://www.in.gov.br/en/web/dou/-/instrucao-normativa-no-84-de-17-de-agosto-de-2020-273462951
https://www.in.gov.br/en/web/dou/-/instr...
), consequently, the creamy dairy dessert with white chocolate flavor investigated would not be inside the quality standard determined by MAPA.
The pH of the samples of creamy dairy dessert with white chocolate flavor varied from 6.5 to 6.8, presenting variations during the period from 0 to 45 days. It was verified that in all lots, there was an increase in pH at the end of the storage time, differently from its acidity, that indicated stability, which happens because of the proteins of the product with buffering activity and action; therefore, the measures of acidity and pH are not mandatorily proportional (Souza et al., 2018Souza, J. V., Paiva, B. L. F., Santos, A. F. C., Fontenele, M. A., Silva Araújo, K. S., & Viana, D. C. (2018). Avaliação dos parametros físico-químicos do leite “in Natura” comercializado informalmente no Município de Imperatriz-Ma. Revista Brasileira de Agropecuária Sustentável, 8(4), 4-9. http://dx.doi.org/10.21206/rbas.v8i4.3064
http://dx.doi.org/10.21206/rbas.v8i4.306...
). An important point to be commented on is that acidity is determined in terms of the lactic acid, and the pH is directly related to the number of hydronium ions in a solution. Therefore, they do not necessarily need to present proportional behavior.
Studies in the area reported reported that many manufacturers, after fermentation, submit the raw material to thermal treatments to guarantee the safety of the product, focusing in extending the shelf-life of the dairy desserts and pH in the final product must be around 6.2 and 6.5 (Silva et al., 2012Silva, A. S., Honjoya, E. R., Inay, O. M., Costa, M. R., Souza, C. H., Santana, H. W., Suguimoto, H. H., & Aragon-Alegro, L. C. (2012). Viability of Lactobacillus casei in chocolate flan and its survival to simulated gastrointestinal conditions. Semina: Ciências Agrárias, 33(Suppl. 2), 3163-3170. http://dx.doi.org/10.5433/1679-0359.2012v33Supl2p3163
http://dx.doi.org/10.5433/1679-0359.2012...
); thus, the pH of the samples studied is above the range reported in the literature nevertheless, for the parameter pH, the new Normative Instruction Nº 84 (Brasil, 2020Brasil. Ministério da Agricultura, Pecuária e Abastecimento, Secretaria de Defesa Agropecuária. (2020). Dispõe sobre a identidade e os requisitos de qualidade, que deve apresentar o produto denominado sobremesa láctea (Instrução Normativa nº 84, de 17 de agosto de 2020). Diário Oficial [da] República Federativa do Brasil, Brasília. Retrieved in 2021, March 21, from https://www.in.gov.br/en/web/dou/-/instrucao-normativa-no-84-de-17-de-agosto-de-2020-273462951
https://www.in.gov.br/en/web/dou/-/instr...
) did not indicate attributions, even being an important quality factor of dairy products.
3.1.3 Total soluble solids content (°Brix)
The TSS content of the samples of dairy dessert indicated alterations during the storage time from 0 to 45 days with values between 23.3% and 27.4%. Nikaedo et al. (2004)Nikaedo, P. H. L., Amaral, F. F., & Penna, A. L. B. (2004). Caracterização tecnológica de sobremesas lácteas achocolatadas cremosas elaboradas com concentrado protéico de soro e misturas de gomas carragena e guar. Revista Brasileira de Ciências Farmacêuticas, 40(3), 397-404. http://dx.doi.org/10.1590/S1516-93322004000300016
http://dx.doi.org/10.1590/S1516-93322004...
presented TSS values between 23.3% and 24.5% 12 hours after manufacture and storage, in conformity with the contents found in this work. (Coitinho et al., 2017Coitinho, T. B., Cassoli, L. D., Cerqueira, P. H. R., da Silva, H. K., Coitinho, J. B., & Machado, P. F. (2017). Adulteration identification in raw milk using Fourier transform infrared spectroscopy. Journal of Food Science and Technology, 54(8), 2394-2402. PMid:28740297. http://dx.doi.org/10.1007/s13197-017-2680-y
http://dx.doi.org/10.1007/s13197-017-268...
), Henrique et al. (2012)Henrique, J. R., Henrique, J. R., Rodrigues, L. M. A., Paixão, M. G., Pinto, S. A., & Paciulli, S. O. D. (2012). Desenvolvimento, parâmetros físico-químicos e avaliação sensorial de sobremesas lácteas produzidas com diferentes variedades de maracujá com e sem soro de leite. Revista do Instituto de Latícinios Cândido Tostes, 67(389), 27-33.http://dx.doi.org/10.5935/2238-6416.20120075
http://dx.doi.org/10.5935/2238-6416.2012...
found values between 31% and 34% for TSS contents in 12 hours after product manufacture, values that are incompatible with the values found in this study. The Normative Instruction Nº 84 (Brasil, 2020Brasil. Ministério da Agricultura, Pecuária e Abastecimento, Secretaria de Defesa Agropecuária. (2020). Dispõe sobre a identidade e os requisitos de qualidade, que deve apresentar o produto denominado sobremesa láctea (Instrução Normativa nº 84, de 17 de agosto de 2020). Diário Oficial [da] República Federativa do Brasil, Brasília. Retrieved in 2021, March 21, from https://www.in.gov.br/en/web/dou/-/instrucao-normativa-no-84-de-17-de-agosto-de-2020-273462951
https://www.in.gov.br/en/web/dou/-/instr...
) determines that the total solids content in dairy desserts must contain a minimum of 10 g of total solids per 100 g of product; thus, the studied samples are following the new Instruction of MAPA.
3.2 Strawberry-flavored yogurt
3.2.1 Spectroscopic screening in the mid-infrared region
According to information provided by the manufacturer, presented in the label of the strawberry-flavored yogurt under study, the main ingredients in its formulation are: whole milk; sugar; strawberry mix; starch; calcium chloride; citric acid; natural dye carmine; sodium citrate; flavorings; xanthan gum; potassium sorbate; milk yeast; pectin; carbohydrates; proteins; fats; sodium; and calcium.
As in the samples of dairy dessert, the strawberry-flavored yogurt also had in its composition carbohydrates, proteins and fats; thus, the spectra were identical to each other because of the high amount of milk. Nevertheless, the strawberry yogurt had additional and particularly characteristic components, such as the natural organic dye carmine (Ca+2(Al. C44H37O32)) -2. In Figure 2, the infrared spectra obtained from 0 to 45 days of the strawberry-flavored yogurt are represented.

According to Lei et al. (2010)Lei, Y., Zhou, Q., Zhang, Y. L., Chen, J. B., Sun, S. Q., & Noda, I. (2010). Analysis of crystallized lactose in milk powder by Fourier-transform infrared spectroscopy combined with two-dimensional correlation infrared spectroscopy. Journal of Molecular Structure, 974(1-3), 88-93. http://dx.doi.org/10.1016/j.molstruc.2009.12.030
http://dx.doi.org/10.1016/j.molstruc.200...
modifications in the bands between 1760 and 1730 cm-1 are caused by C=O stretching, which indicates the presence of esterified carboxylic groups (-COOCH3), and between 1630 and 1600 cm-1, it corresponds the free carboxylic groups (-COOH) relative to pectin; the intense bands in the region of 3450 cm-1 derive from the strong vibrations in the symmetric stretching of the νs(OH) group, possibly indicating the presence of the carboxylic acid responsible for the formation of milk fat, as observed in the spectra obtained in the present study.
The bands with medium intensities around 1660 cm-1 to 1650 cm-1 and 1547 cm-1 to 1541 cm-1 refer to the vibrations caused by the presence of amide I ν(C=O) and amide II δ(N-H) compounds, identifying protein molecules (Lei et al., 2010Lei, Y., Zhou, Q., Zhang, Y. L., Chen, J. B., Sun, S. Q., & Noda, I. (2010). Analysis of crystallized lactose in milk powder by Fourier-transform infrared spectroscopy combined with two-dimensional correlation infrared spectroscopy. Journal of Molecular Structure, 974(1-3), 88-93. http://dx.doi.org/10.1016/j.molstruc.2009.12.030
http://dx.doi.org/10.1016/j.molstruc.200...
). The region around 800 cm-1 to 1250 cm-1 is represented by the carbohydrate compounds ν(C-O), ν(C=C) and ν(C-O-C), which are superimposed on the compounds of fat in the region around 1160 cm-1 ν(C-O) and amide III in the region around 1241 cm-1 to 1251 cm-1 ν(C-N) with the stretching in this region in conformity with the spectra obtained here (Figure 2).
3.2.2 Titrable acidity and pH
The acidity index of the dairy product strawberry-flavored yogurt in lot 1 presented acidity values from 1.0 (g/100 g) to 1.20 (g/100 g); lot 2, with a higher variation, whose values were from 0.8 (g/100 g) to 1.2 (g/100 g); the third lot from 1.0 (g/100 g) to 1.10 (g/100 g); and finally, the fourth and last lot from 0.74 (g/100 g) to 0.84 (g/100 g), which is the lot with the least acidity. The variation observed between the first lots and the fourth lot can be justified because of the period of production and evaluation, which occurred in different months. Furthermore, the behavior of all quality parameters depends on the quality and consignment of milk (the main raw material), from which the milk product is produced. Nevertheless, it was observed that, in the final stock time, acidity presented an increase in all lots.
The alterations in acidity values are related to lactose, a component present in a higher percentage in the solid part of milk whey, since this carbohydrate produces lactic acid during fermentation, thus changing the acidity of the product (Silva & Ueno, 2013Silva, A. B. N., & Ueno, M. (2013). Evaluation of lactic acid bacteria viability and titratable acidity variation in fruit flavor yogurt. Revista do Instituto de Latícinios Cândido Tostes, 68(390), 20-25. http://dx.doi.org/10.5935/2238-6416.20130004
http://dx.doi.org/10.5935/2238-6416.2013...
). The four lots evaluated had acidity values inside the range determined by MAPA, which defines values between 0.6 (g/100 g) and 1.5 (g/100 g). Oliveira et al. (2013)Oliveira, F. M., Lyra, I. N., & Esteves, G. S. G. (2013). Avaliação microbiológica e físico-química de iogurtes de morango industrializados e comercializados no Município de Linhares – Es. Revista Brasileira de Produtos Agroindustriais, 15(2), 147-155. http://dx.doi.org/10.15871/1517-8595/rbpa.v15n2p147-155
http://dx.doi.org/10.15871/1517-8595/rbp...
found acidity index values around 0.8 (g/100 g) for samples of industrialized strawberry-flavored yogurts, identical values to those found in this study. Additionally, these same authors emphasize that the bacterial activity during shelf-life leads to the development of excessive acidity, fragile texture and alteration in the coloration of the dairy product (Oliveira et al., 2013Oliveira, F. M., Lyra, I. N., & Esteves, G. S. G. (2013). Avaliação microbiológica e físico-química de iogurtes de morango industrializados e comercializados no Município de Linhares – Es. Revista Brasileira de Produtos Agroindustriais, 15(2), 147-155. http://dx.doi.org/10.15871/1517-8595/rbpa.v15n2p147-155
http://dx.doi.org/10.15871/1517-8595/rbp...
).
Regarding the pH of the yogurt samples, it was verified that in all lots, there was a reduction in pH, varying from 4.6 to 3.9. This variation may have occurred because of the Maillard reaction. This reaction involves an aldehyde (reducing sugar) and amino groups of amino acids, thus altering the pH of the medium (Newton et al., 2012Newton, A. E., Fairbanks, A. J., Golding, M., Andrewes, P., & Gerrard, J. A. (2012). The role of the Maillard reaction in the formation of flavour compounds in dairy products - Not only a deleterious reaction but also a rich source of flavour compounds. Food & Function, 3(12), 1231-1241. PMid:22948260. http://dx.doi.org/10.1039/c2fo30089c
http://dx.doi.org/10.1039/c2fo30089c...
), and the production of acids reduces pH value. The products from the Maillard reaction can influence several food quality attributes, such as color, aroma and flavor. Furthermore, at pH < 4.0, clot contraction occurs because of the reduction in protein hydration, also causing the draining (conversion to whey) of the product, which might have occurred in the samples of the first lot, which presented pH below 4.0 (Caldeira et al., 2010Caldeira, L. A., Ferrão, S. P. B., Fernandes, S. A. D. A., Magnavita, A. P. A., & Santos, T. D. R. (2010). Desenvolvimento de bebida láctea sabor morango utilizando diferentes níveis de iogurte e soro lácteo obtidos com leite de búfala. Ciência Rural, 40(10), 2193-2198. http://dx.doi.org/10.1590/S0103-84782010005000176
http://dx.doi.org/10.1590/S0103-84782010...
). Another justification for the alteration in the pH of the samples of strawberry-flavored yogurt may be based on the fact that these products have pieces of fruit, and even with their removal for the performance of the pH measurements, over storage time the fruit pieces present in the samples may suffer dehydration, which contributes to the alteration observed in this parameter.
3.2.3 Total soluble solids content (°Brix)
The TSS (°Brix) content of the samples of strawberry-flavored yogurt presented variations during the period evaluated. Nevertheless, a similar behavior was identified among the lots: in the interval between the first 15 to 30 days, there was a decrease in the values from 12.8% to 13.1% and in the storage time of 45 days, there was a more pronounced increase in the range from 13.6% to 14%. These results are following those found in the literature. Santos et al. (2016)Santos, G., Cunha, V. C. M., Pedral, A. L., Silva, G. F., Silva, M. A. A. P., & Pagani, A. A. C. (2016). Avaliação das características físico-químicas do iogurte liofilizado e reidratado. Proceedings of ISTI/SIMTEC, 3, 723-728. http://dx.doi.org/10.7198/S2318-3403201600030084.
http://dx.doi.org/10.7198/S2318-34032016...
investigating the physicochemical characteristics of yogurts, verified that the samples presented values of TSS in the range of 13%. Magalhães & Della Torre (2018)Magalhães, A. U., & Della Torre, A. C. G. (2018). Composição química e análise sensorial do iogurte grego comercializado no sul do estado de Minas Gerais. Revista do Instituto de Latícinios Cândido Tostes, 73(1), 10-18. http://dx.doi.org/10.14295/2238-6416.v73i1.607
http://dx.doi.org/10.14295/2238-6416.v73...
verified that one of the yogurt samples analyzed indicated a TSS value of around 15.5%. The same authors report that the TSS content directly affects the physical properties of yogurt, such as clot consistency. The higher the total soluble solids content, the more consistent and viscous the final product, as observed in the samples under study.
3.3 Analysis of the dairy products using color histograms
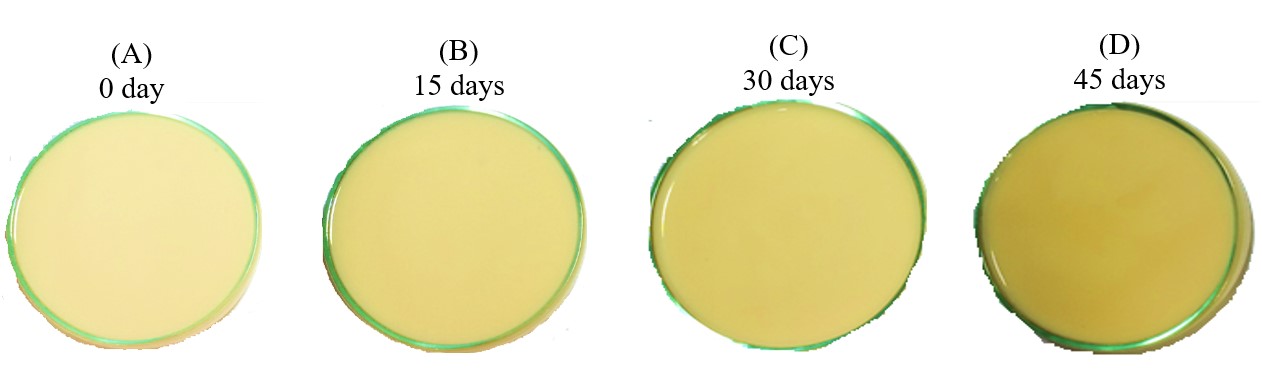
The colorimetric alteration of the dairy products was investigated by digital images registered over storage time. In Figure 3, the images of the creamy dairy dessert with white chocolate flavor are highlighted, and in Figure 4, of the strawberry-flavored yogurt, both at the storage times from 0 to 45 days at intervals of 15 days.


According to Figures 3 and 4, it is visually noted that the creamy dairy dessert with white chocolate flavor darkened as storage time increased, and the samples of strawberry-flavored yogurt lost the shade of pink color (whitening). In order to achieve the grouping of the samples, distinguishing flavors and storage days, the processing of the digital images obtained from the dairy products was performed, extracting the color variables in the intensities Red, Green and Blue (RGB), Hue, Saturation, Value (HSV) and Gray scale, as demonstrated in Figure 5. In total, 1792 variables were extracted from the digital images in triplicate during the storage time from 0 to 45 days at intervals of 15 days. Subsequently, the principal component analysis was performed using all variables obtained from the color histograms.

Color histograms obtained from the digital images of the samples of dairy dessert (A) and strawberry-flavored yogurt (B) to obtain the variables.
The color histograms (Figure 5) bring quantitative information on color intensities. Thus, it is observed that the color peaks of the samples of creamy dairy dessert with white chocolate flavor (A) present differences in the regions RGB, HSV and Gray scale concerning the color peaks of the samples of strawberry-flavored yogurt (B), indicating compatibility with the visual perception observed in Figures 3 and 4.
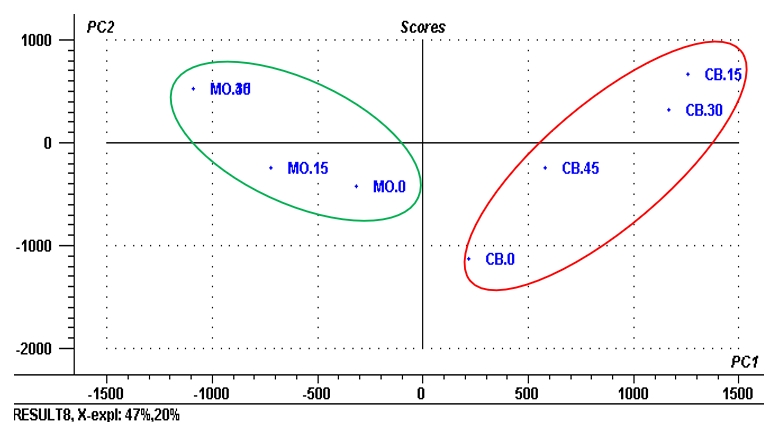
A Principal Component Analysis (PCA) was performed with the 1792 variables extracted to identify and group the samples of the products studied. The total variance of the data was explained with seven PCs, where 47% of the total variance was explained in PC1, as shown in Figure 6.

Analyzing Figure 6, it is observed that PC1 denoted the separation of the samples of creamy dairy dessert with white chocolate flavor (CB) from the samples of strawberry-flavored yogurt (MO). On the other hand, PC2 clearly showed samples CB0 and CB45 with negative scores, and CB15 and CB30 with positive scores. Moreover, points CB15 and CB30 indicated similarity with points MO30 and MO45, which might be related to the close values in the level of color H. Thus, the PCs generated demonstrate they are compatible with the visual observations obtained (Figures 3 and 4), in which the creamy dairy dessert with white chocolate flavor presented more pronounced colorimetric changes than the strawberry-flavored yogurt.
Figure 7 illustrates the x-loadings graph, which provides information on which variable influences the grouping observed in the scores graph (Figure 6). The variables grouping the data are the variables that are concentrated near the center of the graph. The farthest variables 1051 and 1051, which correspond to the level of color H, were responsible for CB30 and CB15, visualized in PC2, and variables 1030, 1031 and 1341 could respond for the grouping M30 and M45.

Graph of loadings of the histograms of the samples of dairy dessert and strawberry-flavored yogurt.
The colorimetric alterations observed in the samples of creamy dairy dessert were visually expressive (Figure 3) and in conformity with the behavior of the color variables indicated by the graph of scores (Figure 6). In the samples of creamy dairy dessert with white chocolate flavor, the product’s darkening was detected over storage time. According to Bastos et al., (2007)Bastos, D. M., Monaro, É., Siguemoto, É., & Séfora, M. (2007). Maillard reaction products in processed food : pros and cons. In: B. Valdez (Ed.), Food industrial processes – methods and equipment (pp. 281-300). London: IntechOpen., the Maillard reactions that occur between sugars and amino groups were also responsible for the darkening, aroma, and flavor of several foods, thus influencing the dissatisfaction or sensory attributes required by the consumer (Francisquini et al., 2017Francisquini, J. D., Martins, E., Silva, P. H. F., Schuck, P., Perrone, Í. T., & Carvalho, A. F. (2017). Reação de Maillard: uma revisão. Revista do Instituto de Latícinios Cândido Tostes, 72(1), 48. http://dx.doi.org/10.14295/2238-6416.v72i1.541
http://dx.doi.org/10.14295/2238-6416.v72...
).
The Maillard reaction occurs under influence of pH, storage time, temperature, water content, type of sugar, and amino acids involved, generating products such as melanoidins, which are responsible for the brown coloration and protein loss (Francisquini et al., 2017Francisquini, J. D., Martins, E., Silva, P. H. F., Schuck, P., Perrone, Í. T., & Carvalho, A. F. (2017). Reação de Maillard: uma revisão. Revista do Instituto de Latícinios Cândido Tostes, 72(1), 48. http://dx.doi.org/10.14295/2238-6416.v72i1.541
http://dx.doi.org/10.14295/2238-6416.v72...
). Xiang et al. (2021)Xiang, J., Liu, F., Wang, B., Chen, L., Liu, W., & Tan, S. (2021). A literature review on maillard reaction based on milk proteins and carbohydrates in food and pharmaceutical products: advantages, disadvantages, and avoidance strategies. Foods, 10(9), 1998. PMid:34574107. http://dx.doi.org/10.3390/foods10091998
http://dx.doi.org/10.3390/foods10091998...
emphasized that the Maillard reaction occurs mainly due to the presence of water. Therefore, according to the spectral bands (Figure 1 and 2) obtained in this work, the presence of absorption peaks in the region of 3250 cm-1 were observed, due to the strong vibrations in the symmetrical elongation of the νs (OH) group, which are strongly related to the presence of water, being the motivation for the occurrence of the Maillard reaction in dairy products analyzed even under refrigeration indicated by the manufacturer.
In the case of the creamy dairy dessert with white chocolate flavor, the brown color is not desirable, since it is not the characteristic color of white chocolate and, in case it is presented, it indicates that the beverage has suffered internal alterations, such as pH, acidity, soluble solids, among others.
The darkening during storage of the samples of creamy dairy dessert with white chocolate flavor, according to the literature, might be related to chemical reactions between the reducing sugar, mainly D-glucose, and a primary amine group. Nevertheless, other deteriorating factors, such as storage time, temperature, among others, cannot be discarded.
Regarding the strawberry-flavored yogurt, the colorimetric alterations were subtle (Figure 4), which is confirmed by the graph of scores (Figure 6), in which little variation was observed for the color variables extracted from the images of the samples of the strawberry-flavored yogurt. The literature reports that the alterations in the color of the product strawberry-flavored yogurt may be associated with reactions among sugars, carbohydrates, proteins, among other compounds (Silva & Ueno, 2013Silva, A. B. N., & Ueno, M. (2013). Evaluation of lactic acid bacteria viability and titratable acidity variation in fruit flavor yogurt. Revista do Instituto de Latícinios Cândido Tostes, 68(390), 20-25. http://dx.doi.org/10.5935/2238-6416.20130004
http://dx.doi.org/10.5935/2238-6416.2013...
). Nevertheless, the product contains the dye carmine as indicated in the label, which, in this case, becomes the main responsible for the coloration of the samples.
Discussions about the bands of the compound carmine were not performed, since the attribution of bands observed in FTIR is not trivial, considering the complexity of the chemical structure of the molecule of carmine. Therefore, it is not possible to evidence the colorimetric alterations of the strawberry-flavored yogurt with the chemical substance carmine in the present study. Nevertheless, the stability of the dye carmine, according to Barros & Barros (2010)Barros, A. A., & Barros, E. B. P. (2010). A química dos alimentos: produtos fermentados e corantes (Vol. 1). São Paulo: Edit-SBQ. depends on pH; thus, as previously discussed, the samples of strawberry-flavored yogurt presented reduction in the pH over time, which can justify the loss in the red coloration and, consequently, discoloration over storage time, as observed in Figure 4.
4 Conclusion
The samples of creamy dairy dessert with white chocolate flavor presented considerable changes in pH and total soluble solids; conversely, there were no changes in acidity. Even with the recently published Normative Instruction Nº 84, the Brazilian legislation is scarce concerning this type of food, however, by the literature, it is concluded that the samples presented agreements with the results presented by researchers in the food area.
The spectra obtained by middle-infrared spectroscopy presented groups that characterize the samples, also being possible to visualize alterations in the peaks which correspond to protein, carbohydrates, among others, during storage time from 0 to 45 days.
The samples of strawberry-flavored yogurt also indicated notorious alterations in pH, acidity, soluble solids content, and the bands obtained also corresponded to these alterations during storage time.
Regarding colorimetric stability, employing digital image processing simultaneously with Principal Component Analysis (PCA), it was possible to identify considerable colorimetric variations in the dairy products studied, in which, by the principal component analysis, the samples were identified and grouped in the first PC. On the other hand, PC2 explicitly grouped the samples of CB0 and CB45 with negative scores, and CB15 and CB30 with positive scores. Therefore, the PCs obtained were compatible with the colorimetric alterations visually noticed.
Acknowledgements
The authors thank the Coordenação de Aperfeiçoamento de Pessoal de Nível Superior (CAPES) – Brazil (CAPES – 1764471).
-
Cite as: Leal, K. N. S., Bastos, I. C., Diniz, P. H. G. D., & Barros, S. R. C. R. (2022). Assessment of dairy products stability by physicochemical and spectroscopic analyses and digital images. Brazilian Journal of Food Technology, 25, e2021164. https://doi.org/10.1590/1981-6723.16421
-
Funding: None
References
- Almeida Neta, M. C., Rocha de Queiroga, A. P., Almeida, R. L. J., Caetano Soares, A., Marinho Gonçalves, J., Soares Fernandes, S., de Sousa, M. C., Olbrich Dos Santos, K. M., Alonso Buriti, F. C., & Rolim Florentino, E. (2018). Fermented dessert with whey, ingredients from the peel of Jabuticaba (Myrciaria cauliflora) and an indigenous culture of lactobacillus plantarum: composition, microbial viability, antioxidant capacity and sensory features. Nutrients, 10(9), 1-19. PMid:30200532. http://dx.doi.org/10.3390/nu10091214
» http://dx.doi.org/10.3390/nu10091214 - Barros, A. A., & Barros, E. B. P. (2010). A química dos alimentos: produtos fermentados e corantes (Vol. 1). São Paulo: Edit-SBQ.
- Bastos, D. M., Monaro, É., Siguemoto, É., & Séfora, M. (2007). Maillard reaction products in processed food : pros and cons. In: B. Valdez (Ed.), Food industrial processes – methods and equipment (pp. 281-300). London: IntechOpen.
- Brasil. Ministério da Agricultura, Pecuária e Abastecimento, Secretaria de Defesa Agropecuária. (2020). Dispõe sobre a identidade e os requisitos de qualidade, que deve apresentar o produto denominado sobremesa láctea (Instrução Normativa nº 84, de 17 de agosto de 2020). Diário Oficial [da] República Federativa do Brasil, Brasília. Retrieved in 2021, March 21, from https://www.in.gov.br/en/web/dou/-/instrucao-normativa-no-84-de-17-de-agosto-de-2020-273462951
» https://www.in.gov.br/en/web/dou/-/instrucao-normativa-no-84-de-17-de-agosto-de-2020-273462951 - Brasil. Ministério da Agricultura, Pecuária e Abastecimento. (2006). Métodos analíticos oficiais físico-químicos, para controle de leite e produtos lácteos (Instrução Normativa no 68, de 12 de dezembro de 2006). Diário Oficial [da] República Federativa do Brasil, Brasília. Retrieved in 2021, March 21, from https://wp.ufpel.edu.br/inspleite/files/2016/03/Instrução-normativa-n°-68-de-12-dezembro-de-2006.pdf
» https://wp.ufpel.edu.br/inspleite/files/2016/03/Instrução-normativa-n°-68-de-12-dezembro-de-2006.pdf - Caldeira, L. A., Ferrão, S. P. B., Fernandes, S. A. D. A., Magnavita, A. P. A., & Santos, T. D. R. (2010). Desenvolvimento de bebida láctea sabor morango utilizando diferentes níveis de iogurte e soro lácteo obtidos com leite de búfala. Ciência Rural, 40(10), 2193-2198. http://dx.doi.org/10.1590/S0103-84782010005000176
» http://dx.doi.org/10.1590/S0103-84782010005000176 - Coitinho, T. B., Cassoli, L. D., Cerqueira, P. H. R., da Silva, H. K., Coitinho, J. B., & Machado, P. F. (2017). Adulteration identification in raw milk using Fourier transform infrared spectroscopy. Journal of Food Science and Technology, 54(8), 2394-2402. PMid:28740297. http://dx.doi.org/10.1007/s13197-017-2680-y
» http://dx.doi.org/10.1007/s13197-017-2680-y - Egea, M. B., Gomes, A. C. G., Lima, M. S., & Takeuchi, K. P. (2019). Relação entre as características físico-químicas e reológica e o valor comercial de iogurte integral com sabor morango. Segurança Alimentar e Nutricional, 26(64), e019003. http://dx.doi.org/10.20396/san.v26i0.8652948
» http://dx.doi.org/10.20396/san.v26i0.8652948 - Fernandes, D. D. S., Romeo, F., Krepper, G., Di Nezio, M. S., Pistonesi, M. F., Centurión, M. E., Araújo, M. C. U., & Diniz, P. H. G. D. (2019). Quantification and identification of adulteration in the fat content of chicken hamburgers using digital images and chemometric tools. Lwt, 100, 20-27. http://dx.doi.org/10.1016/j.lwt.2018.10.034
» http://dx.doi.org/10.1016/j.lwt.2018.10.034 - Fernandes, S. S., Coelho, R. S., Franco, R. M., Barbosa, C. G., & Luches, E. R. H. (2011). Monitoramento da microbiota de iogurtes comerciais. Revista do Instituto de Latícinios Cândido Tostes, 382(66), 5-11.
- Francisquini, J. D., Martins, E., Silva, P. H. F., Schuck, P., Perrone, Í. T., & Carvalho, A. F. (2017). Reação de Maillard: uma revisão. Revista do Instituto de Latícinios Cândido Tostes, 72(1), 48. http://dx.doi.org/10.14295/2238-6416.v72i1.541
» http://dx.doi.org/10.14295/2238-6416.v72i1.541 - Gonçalves Dias Diniz, P. H. (2020). Chemometrics-assisted color histogram-based analytical systems. Journal of Chemometrics, 34(12), 1-27. http://dx.doi.org/10.1002/cem.3242
» http://dx.doi.org/10.1002/cem.3242 - Henrique, J. R., Henrique, J. R., Rodrigues, L. M. A., Paixão, M. G., Pinto, S. A., & Paciulli, S. O. D. (2012). Desenvolvimento, parâmetros físico-químicos e avaliação sensorial de sobremesas lácteas produzidas com diferentes variedades de maracujá com e sem soro de leite. Revista do Instituto de Latícinios Cândido Tostes, 67(389), 27-33.http://dx.doi.org/10.5935/2238-6416.20120075
» http://dx.doi.org/10.5935/2238-6416.20120075 - Kalinin, A., Krasheninnikov, V., Sadovskiy, S., & Yurova, E. (2013). Determining the composition of proteins in milk using a portable near infrared spectrometer. Journal of Near Infrared Spectroscopy, 21(5), 409-415. http://dx.doi.org/10.1255/jnirs.1054
» http://dx.doi.org/10.1255/jnirs.1054 - Lei, Y., Zhou, Q., Zhang, Y. L., Chen, J. B., Sun, S. Q., & Noda, I. (2010). Analysis of crystallized lactose in milk powder by Fourier-transform infrared spectroscopy combined with two-dimensional correlation infrared spectroscopy. Journal of Molecular Structure, 974(1-3), 88-93. http://dx.doi.org/10.1016/j.molstruc.2009.12.030
» http://dx.doi.org/10.1016/j.molstruc.2009.12.030 - Lodha, A., Pandya, A., Sutariya, P. G., & Menon, S. K. (2014). A smart and rapid colorimetric method for the detection of codeine sulphate, using unmodified gold nanoprobe. RSC Advances, 4(92), 50443-50448. http://dx.doi.org/10.1039/C4RA06269H
» http://dx.doi.org/10.1039/C4RA06269H - Magalhães, A. U., & Della Torre, A. C. G. (2018). Composição química e análise sensorial do iogurte grego comercializado no sul do estado de Minas Gerais. Revista do Instituto de Latícinios Cândido Tostes, 73(1), 10-18. http://dx.doi.org/10.14295/2238-6416.v73i1.607
» http://dx.doi.org/10.14295/2238-6416.v73i1.607 - Moros, J., Iñón, F. A., Khanmohammadi, M., Garrigues, S., & De La Guardia, M. (2006). Evaluation of the application of attenuated total reflectance-Fourier transform infrared spectrometry (ATR-FTIR) and chemometrics to the determination of nutritional parameters of yogurt samples. Analytical and Bioanalytical Chemistry, 385(4), 708-715. PMid:16741770. http://dx.doi.org/10.1007/s00216-006-0418-1
» http://dx.doi.org/10.1007/s00216-006-0418-1 - Motta, J. D., Melo Queiroz, A. J., Figueirêdo, R. M. F., & Sousa, K. D. S. M. (2015). Índice de cor e sua correlação com parâmetros físicos e físico-químicos de goiaba, manga e mamão. Comunicata Scientiae, 6(1), 74-82.
- Newton, A. E., Fairbanks, A. J., Golding, M., Andrewes, P., & Gerrard, J. A. (2012). The role of the Maillard reaction in the formation of flavour compounds in dairy products - Not only a deleterious reaction but also a rich source of flavour compounds. Food & Function, 3(12), 1231-1241. PMid:22948260. http://dx.doi.org/10.1039/c2fo30089c
» http://dx.doi.org/10.1039/c2fo30089c - Nikaedo, P. H. L., Amaral, F. F., & Penna, A. L. B. (2004). Caracterização tecnológica de sobremesas lácteas achocolatadas cremosas elaboradas com concentrado protéico de soro e misturas de gomas carragena e guar. Revista Brasileira de Ciências Farmacêuticas, 40(3), 397-404. http://dx.doi.org/10.1590/S1516-93322004000300016
» http://dx.doi.org/10.1590/S1516-93322004000300016 - Oliveira, F. M., Lyra, I. N., & Esteves, G. S. G. (2013). Avaliação microbiológica e físico-química de iogurtes de morango industrializados e comercializados no Município de Linhares – Es. Revista Brasileira de Produtos Agroindustriais, 15(2), 147-155. http://dx.doi.org/10.15871/1517-8595/rbpa.v15n2p147-155
» http://dx.doi.org/10.15871/1517-8595/rbpa.v15n2p147-155 - Oliveira, L. C., Souza, S. O., & Mamede, M. E. O. (2011). Avaliação das características físico-químicas e colorimétricas de vinhos finos de duas principais regiões vinícolas do Brasil. Revista do Instituto Adolfo Lutz, 70(2), 158-167.
- Pereira, E. V. S., Fernandes, D. D. S., Araújo, M. C. U., Diniz, P. H. G. D., & Maciel, M. I. S. (2020). Simultaneous determination of goat milk adulteration with cow milk and their fat and protein contents using NIR spectroscopy and PLS algorithms. Lwt, 127, 109427. https://doi.org/10.1016/j.lwt.2020.109427
» https://doi.org/10.1016/j.lwt.2020.109427 - Russ, J. C. (2015). Image analysis of foods. Journal of Food Science, 80(9), E1974-1987. PMid:26270611. http://dx.doi.org/10.1111/1750-3841.12987
» http://dx.doi.org/10.1111/1750-3841.12987 - Salleh, N. A., Selamat, J., Meng, G. Y., Abas, F., Jambari, N. N., & Khatib, A. (2019). Fourier transform infrared spectroscopy and multivariate analysis of milk from different goat breeds. International Journal of Food Properties, 22(1), 1673-1683. http://dx.doi.org/10.1080/10942912.2019.1668803
» http://dx.doi.org/10.1080/10942912.2019.1668803 - Santos, G., Cunha, V. C. M., Pedral, A. L., Silva, G. F., Silva, M. A. A. P., & Pagani, A. A. C. (2016). Avaliação das características físico-químicas do iogurte liofilizado e reidratado. Proceedings of ISTI/SIMTEC, 3, 723-728. http://dx.doi.org/10.7198/S2318-3403201600030084
» http://dx.doi.org/10.7198/S2318-3403201600030084 - Silva, A. B. N., & Ueno, M. (2013). Evaluation of lactic acid bacteria viability and titratable acidity variation in fruit flavor yogurt. Revista do Instituto de Latícinios Cândido Tostes, 68(390), 20-25. http://dx.doi.org/10.5935/2238-6416.20130004
» http://dx.doi.org/10.5935/2238-6416.20130004 - Silva, A. S., Honjoya, E. R., Inay, O. M., Costa, M. R., Souza, C. H., Santana, H. W., Suguimoto, H. H., & Aragon-Alegro, L. C. (2012). Viability of Lactobacillus casei in chocolate flan and its survival to simulated gastrointestinal conditions. Semina: Ciências Agrárias, 33(Suppl. 2), 3163-3170. http://dx.doi.org/10.5433/1679-0359.2012v33Supl2p3163
» http://dx.doi.org/10.5433/1679-0359.2012v33Supl2p3163 - Silva, P. H. A., Gonçalves, M. C., & Chaves, K. S. (2018). Características físico-químicas e sensoriais de iogurte firme e sobremesa láctea fermentada com doce de caju. Higiene Alimentar, 32, 123-127.
- Sousa Fernandes, D. D., Almeida, V. E., Fontes, M. M., Araújo, M. C. U., Véras, G., & Diniz, P. H. G. D. (2019). Simultaneous identification of the wood types in aged cachaças and their adulterations with wood extracts using digital images and SPA-LDA. Food Chemistry, 273, 77-84. https://doi.org/10.1016/j.foodchem.2018.02.035
» https://doi.org/10.1016/j.foodchem.2018.02.035 - Souto, U. T., Barbosa, M. F., Dantas, H. V., Pontes, A. S., Lyra, W. S., Diniz, P. H. G. D., de Araújo, M. C. U., & Silva, E. C. (2015). Screening for coffee adulteration using digital images and SPA-LDA. Food Analytical Methods, 8(6), 1515-1521. http://dx.doi.org/10.1007/s12161-014-0020-7
» http://dx.doi.org/10.1007/s12161-014-0020-7 - Souza, J. V., Paiva, B. L. F., Santos, A. F. C., Fontenele, M. A., Silva Araújo, K. S., & Viana, D. C. (2018). Avaliação dos parametros físico-químicos do leite “in Natura” comercializado informalmente no Município de Imperatriz-Ma. Revista Brasileira de Agropecuária Sustentável, 8(4), 4-9. http://dx.doi.org/10.21206/rbas.v8i4.3064
» http://dx.doi.org/10.21206/rbas.v8i4.3064 - Spagnol, W. A., Silveira, V., Pereira, E., & Guimarães Filho, N. (2018). Monitoramento da cadeia do frio: novas tecnologias e recentes avanços. Brazilian Journal of Food Technology, 21, 2-8. http://dx.doi.org/10.1590/1981-6723.6916
» http://dx.doi.org/10.1590/1981-6723.6916 - Xiang, J., Liu, F., Wang, B., Chen, L., Liu, W., & Tan, S. (2021). A literature review on maillard reaction based on milk proteins and carbohydrates in food and pharmaceutical products: advantages, disadvantages, and avoidance strategies. Foods, 10(9), 1998. PMid:34574107. http://dx.doi.org/10.3390/foods10091998
» http://dx.doi.org/10.3390/foods10091998 - Yilmaz-Ersan, L., Ozcan, T., Akpinar-Bayizit, A., Mansri, C., Topcuoglu, E., Karaman, S., & Ozdemir, T. (2019). The evaluation of the textural and sensorial properties of chocolate dairy dessert. Journal of Animal Husbandry and Dairy Science, 3(1), 9-13.
- Zenebon, O., & Pascuet, N. S. (2008). Métodos físicos-quimicos para análise de alimentos São Paulo: Instituto Adolfo Lutz.
Edited by
Publication Dates
-
Publication in this collection
22 June 2022 -
Date of issue
2022
History
-
Received
09 Mar 2021 -
Accepted
17 Dec 2021