
Abstract:
Shadows exist in almost all aerial and outdoor images, and they can be useful for estimating Sun position estimation or measuring object size. On the other hand, they represent a problem in processes such as object detection/recognition, image matching, etc., because they may be confused with dark objects and change the image radiometric properties. We address this problem on aerial and outdoor color images in this work. We use a filter to find low intensities as a first step. For outdoor color images, we analyze spectrum ratio properties to refine the detection, and the results are assessed with a dataset containing ground truth. For the aerial case we validate the detections depending of the hue component of pixels. This stage takes into account that, in deep shadows, most pixels have blue or violet wavelengths because of an atmospheric scattering effect.
Keywords:
Shadow Detection; Aerial Images; Terrestrial Images
Resumo:
Sombras estão presentes na maior parte das imagens aéreas e terrestres, e elas podem ser úteis para estimação da posição do Sol, ou para medir os tamanhos de objetos. Por outro lado, elas representam um problema em processamentos tais como detecção/reconhecimento de objetos, correspondência entre imagens, etc., pois podem ser confundidas com objetos escuros e mudar as propriedades radiométricas da imagem. Neste trabalho esse problema foi tratado em imagens aéreas e terrestres. Utilizou-se um filtro para encontrar áreas com baixas intensidades. Para as imagens terrestres, foram analisadas propriedades da razão do espectro das imagens para refinar a detecção, e os resultados foram avaliados por meio de um conjunto de dados contendo a verdade de campo. Para o caso aéreo as detecções são validadas dependendo da componente da matiz dos pixels. Esse estágio leva em consideração que em sombras profundas a maior parte dos pixels possuem comprimentos de onda na região do azul e violeta por conta de um efeito de espalhamento atmosférico.
Palavras-chave:
Detecção de Sombras; Imagens Aéreas; Imagens Terrestres.
1. Introduction
Detecting shadows in digital images is an important preprocessing step for many applications. Shadows are frequently confused as scene objects, causing problems in algorithms such as object detection and recognition, image matching, and applications like traffic monitoring and surveillance. In some applications, however, the shadowed areas can be labelled and enhanced to enable information extraction in these areas. Also, shadowed areas can be used to compute brightness variation for vignetting correction, as it was presented by Imai et al (2014Imai, N. N., Polidório, A. M., Tommaselli, A. M. G., and Barros, A. F. 2014. Uso de sombras na correção do efeito vinhete. Boletim de Ciências Geodésicas (Online), 20(1), pp.100-116.). In some processes like camera calibration and image registering, shadowed areas can cause problems in the feature extraction and point measurements which will affect the final results. Stereomatching in aerial photogrammetry is also a problem which requires shadows detection and labeling, because shadows change during the image acquisition because of earth rotation.
Shadows are classified in two major groups: cast and self shadows. Cast shadows are projected by objects of the scene. Self shadows are those projected on the object by itself, in areas where there is deficient illumination. Self shadows usually have higher intensity values than cast shadows, because they receive more secondary light from near objects. Umbra and penumbra are other two sub categories of shadows which must also be considered. Umbra represents a shadow region where the primary source of light is completely obscured. Penumbra is the region around the edge of a shadow where the light source is only partially obscured, or where secondary sources of light illuminate it with low intensity (Dare, 2005Dare, P. M. 2005. Shadow Analysis in High-Resolution Satellite Imagery of Urban Areas. Photogrammetric Engineering and Remote Sensing, 71(2), pp.169-77.). Moreover, in deep shadows, the spectrum is skewed to the blue/violet wavelength, which means that shadow areas are dark and saturated at the blue/violet wavelength (Adler-Golden et al., 2002Adler-Golden, S. M., Matthew, M. W., Anderson, G. P., Felde, G. W. and Gardner, J. A. 2002. Algorithm for de-Shadowing Spectral Imagery. In: Proceedings of SPIE, Imaging Spectrometry VIII , v. 4816, pp.203-210. Seattle: USA. doi:10.1117/12.451691.
https://doi.org/10.1117/12.451691...
).
In this work we present two shadow detection algorithms, one to deal with aerial images and the other for outdoor color images taken from ordinary cameras. Both use an adapted version of the algorithm proposed by Santos et al. (2006Santos, D., Dalmolin, Q. and Basso, M. A. 2006. Detecção Automática de Sombras em Imagens de Alta Resolução. Boletim de Ciências Geodésicas , 12(1), pp.87-99. http://ojs.c3sl.ufpr.br/ojs2/index.php/bcg/article/view/5310/3931.
http://ojs.c3sl.ufpr.br/ojs2/index.php/b...
) for high-resolution aerial images. For the aerial case, we introduce a treatment to pixels with certain hue values, based on the hypothesis that most deep shadows have blue and violet wavelengths (Adler-Golden et al., 2002Adler-Golden, S. M., Matthew, M. W., Anderson, G. P., Felde, G. W. and Gardner, J. A. 2002. Algorithm for de-Shadowing Spectral Imagery. In: Proceedings of SPIE, Imaging Spectrometry VIII , v. 4816, pp.203-210. Seattle: USA. doi:10.1117/12.451691.
https://doi.org/10.1117/12.451691...
; Polidorio et al., 2003Polidorio, A. M., Flores, F. C., Imai, N. N., Tommaselli, A. M. G. and Franco, C. 2003. Automatic Shadow Segmentation in Aerial Color Images. In: Proceedings of the XVI SIBGRAPI. XVI
Brazilian Symposium on Computer Graphics and Image Processing. São Carlos, Brasil, 12-15 October 2003. doi:10.1109/SIBGRA.2003.1241019.
https://doi.org/10.1109/SIBGRA.2003.1241...
). The algorithm for outdoor color images uses a different approach that considers a spectrum ratio analysis (Tian et al., 2016Tian, J., Qi, X., Qu, L. and Tang, Y. 2016. New Spectrum Ratio Properties and Features for Shadow Detection. Pattern Recognition, 51, pp.85-96. doi:http://dx.doi.org/10.1016/j.patcog.2015.09.006.
https://doi.org/dx.doi.org/10.1016/j.pat...
).
We performed experiments with 5 aerial images taken in Sao Paulo state, Brazil. Results are assessed visually only, since there is no ground truth for this case. Furthermore, we assessed the algorithm for terrestrial images from a dataset with 355 images (Guo et al., 2011Guo, R., Qieyun, D., and Hoiem, D. 2011. Single-Image Shadow Detection and Removal Using Paired Regions. In: Proceedings of the CVPR ’11. IEEE
Conference on Computer Vision and Pattern Recognition, 2033(40). Washington, DC, USA: IEEE Computer Society. doi:10.1109/CVPR.2011.5995725.
https://doi.org/10.1109/CVPR.2011.599572...
). For both cases we compared the outcomes to other existing methods.
2. Related papers
Polidorio et al. (2003Polidorio, A. M., Flores, F. C., Imai, N. N., Tommaselli, A. M. G. and Franco, C. 2003. Automatic Shadow Segmentation in Aerial Color Images. In: Proceedings of the XVI SIBGRAPI. XVI
Brazilian Symposium on Computer Graphics and Image Processing. São Carlos, Brasil, 12-15 October 2003. doi:10.1109/SIBGRA.2003.1241019.
https://doi.org/10.1109/SIBGRA.2003.1241...
) developed a technique for detecting shadows in orbital and aerial images. They used a shadow quantifier index, which is computed using the intensity and saturation components from the HSI color space. The algorithm takes into account the low intensity and high saturation of shadow pixels, caused by a physical phenomenon of atmospheric dispersion of the sunlight, best known as the Rayleigh scattering effect. This technique proved to be efficient with aerial and orbital images, but its use with terrestrial images was not mentioned by the authors. In a previous work, we employed an adaptive version of this shadow index in high-resolution terrestrial images, which performed well in some cases.
There are many techniques for shadow labeling on high-resolution satellite and aerial images (Dare, 2005Dare, P. M. 2005. Shadow Analysis in High-Resolution Satellite Imagery of Urban Areas. Photogrammetric Engineering and Remote Sensing, 71(2), pp.169-77., Devi et al., 2011Devi, G., Kaliappan, S. and Malini,M. 2011. Stochastic Method for De-Shadowing and Objects Retrieval from High Resolution Images. International Journal on Computer Science and Engineering
(IJCSE), 4(3), pp.1468-78., Santos et al., 2006Santos, D., Dalmolin, Q. and Basso, M. A. 2006. Detecção Automática de Sombras em Imagens de Alta Resolução. Boletim de Ciências Geodésicas , 12(1), pp.87-99. http://ojs.c3sl.ufpr.br/ojs2/index.php/bcg/article/view/5310/3931.
http://ojs.c3sl.ufpr.br/ojs2/index.php/b...
, Centeno and Pacheco, 2011Centeno, J. A. S., and Pacheco, A. P. 2011. Classificação de Sombra Em Imagens Orbitais E Aéreas Usando Uma Matriz de Co-Ocorrência Modificada. Boletim de Ciências Geodésicas, 17 (1)., Tian et al., 2016Tian, J., Qi, X., Qu, L. and Tang, Y. 2016. New Spectrum Ratio Properties and Features for Shadow Detection. Pattern Recognition, 51, pp.85-96. doi:http://dx.doi.org/10.1016/j.patcog.2015.09.006.
https://doi.org/dx.doi.org/10.1016/j.pat...
), using thresholding, region encoding, spectral, textural and geometric properties, masks and other strategies.
Santos et al. (2006Santos, D., Dalmolin, Q. and Basso, M. A. 2006. Detecção Automática de Sombras em Imagens de Alta Resolução. Boletim de Ciências Geodésicas , 12(1), pp.87-99. http://ojs.c3sl.ufpr.br/ojs2/index.php/bcg/article/view/5310/3931.
http://ojs.c3sl.ufpr.br/ojs2/index.php/b...
) created a 3x3 filter to detect shadows in high-resolution aerial images, choosing pixels with lower radiometric response as shadow pixels. This filter, named shadow filter (SF), is the base of our algorithms, because of the good results in preliminary tests we performed. Their mask has interesting properties: computational efficiency, easiness of implementation, does not depend on free parameters, and seems to be noise-resistant, probably because its principle is similar to the median filter. In this paper we employ this mask along with some physical hypothesis of shadow properties to increase its efficacy.
The technique presented by Blajovici et al. (2011Blajovici, C., Kiss, P. J., Bonus, Z. and Varga, L. 2011. Shadow detection and removal from a single image. In: Proceedings of 19th SSIP, 19th Summer School on Image Processing. Szeged, Hungary, 7-16 July 2011.) detects the pixels with low intensity values through the analysis of the Y component of YCbCr color space. They consider as shadows those pixels having intensity values lower than a percentage of the average of a sliding window. This window moves through the image and its size decreases after each iteration. To avoid false positives they consider as shadows only dark areas with smooth borders. As a final step, they apply the median filter to remove noise.
Centeno and Pacheco (2011Centeno, J. A. S., and Pacheco, A. P. 2011. Classificação de Sombra Em Imagens Orbitais E Aéreas Usando Uma Matriz de Co-Ocorrência Modificada. Boletim de Ciências Geodésicas, 17 (1).) used a modified co-occurrence matrix, and an adaptive threshold, which is obtained through the frequency histogram of the co-occurrence matrix main diagonal. They split the histogram into two parts based on a local minima analysis and this point of separation is set as their threshold. This process considers that shadowed neighbor pixels have similar radiometric response. It means that the main diagonal of the co-occurrence matrix will have shadow pixels at the beginning (low intensities). Finding the split point is the key process.
Most techniques have problems with targets which have radiometric properties similar to shadows, namely water, trees and dark elements. Dare (2005Dare, P. M. 2005. Shadow Analysis in High-Resolution Satellite Imagery of Urban Areas. Photogrammetric Engineering and Remote Sensing, 71(2), pp.169-77.) applies a variance-based region filtering to separate shadow from falsely detected non-shadow regions. In our algorithm we perform a validation step using the hue band from HSI color space for aerial images.
Tian et al. (2009Tian, J., Sun, J., and Tang, Y. 2009. Tricolor Attenuation Model for Shadow Detection. IEEE
Transactions on Image Processing, 18(10), pp.2355-2363. doi:10.1109/TIP.2009.2026682.
https://doi.org/10.1109/TIP.2009.2026682...
) used an RGB attenuation model (Tricolor Attenuation Model - TAM), considering the image formation theory. The process is entirely automatic and does not depend on additional information. In a more recent work, Tian et al. (2016)Tian, J., Qi, X., Qu, L. and Tang, Y. 2016. New Spectrum Ratio Properties and Features for Shadow Detection. Pattern Recognition, 51, pp.85-96. doi:http://dx.doi.org/10.1016/j.patcog.2015.09.006.
https://doi.org/dx.doi.org/10.1016/j.pat...
developed a technique based on spectrum ratio properties of shadows for outdoor color images. In our algorithm for terrestrial images we apply this technique after the shadow mask as a combined strategy.
There are algorithms with training steps (Guo et al., 2011Guo, R., Qieyun, D., and Hoiem, D. 2011. Single-Image Shadow Detection and Removal Using Paired Regions. In: Proceedings of the CVPR ’11. IEEE
Conference on Computer Vision and Pattern Recognition, 2033(40). Washington, DC, USA: IEEE Computer Society. doi:10.1109/CVPR.2011.5995725.
https://doi.org/10.1109/CVPR.2011.599572...
) that introduce a dependence on training sets. For this reason, different training sets may result in different outcomes. Positive aspects of our techniques are that they do not rely on training data, are easy to implement and fast to run.
3. Aerial images
The shadow filter proposed in Santos et al. (2006Santos, D., Dalmolin, Q. and Basso, M. A. 2006. Detecção Automática de Sombras em Imagens de Alta Resolução. Boletim de Ciências Geodésicas , 12(1), pp.87-99. http://ojs.c3sl.ufpr.br/ojs2/index.php/bcg/article/view/5310/3931.
http://ojs.c3sl.ufpr.br/ojs2/index.php/b...
) was originally developed for aerial images (Figure 1).

Shadow mask proposed by Santos et al. (2006Santos, D., Dalmolin, Q. and Basso, M. A. 2006. Detecção Automática de Sombras em Imagens de Alta Resolução. Boletim de Ciências Geodésicas , 12(1), pp.87-99. http://ojs.c3sl.ufpr.br/ojs2/index.php/bcg/article/view/5310/3931.
http://ojs.c3sl.ufpr.br/ojs2/index.php/b... ).
This filter convolves a template through a monochromatic input image and the resulting pixels with intensity larger than 255 are considered shadow free, while the rest are labeled as shadows. In Equation 1, S ij represents the binary result of shadow detection at coordinates (i, j), and C is the image produced by the convolution process.
In our approach the image is first converted from RGB to grayscale, through Equation 2, and is smoothed by a bilateral filter (Fisher, 2016Fisher, B. 2016. Bilateral Filtering for Gray and Color Images. Available at: Available at: http://homepages.inf.ed.ac.uk/rbf/CVonline/LOCAL_COPIES/MANDUCHI1/Bilateral_Filtering.html#Index
Accessed September 2016;.
http://homepages.inf.ed.ac.uk/rbf/CVonli...
), to reduce noise.
Next, C is calculated and then S with Equation 1. False detections are removed through the use of hue information given by Equations 3 and 4 (Gonzalez and Woods, 2010Gonzalez, R C, and Woods, R E. 2010. Processamento Digital de Imagens. Book. 3rd ed. São Paulo: Pearson Pretience Hall.).
Hue is discretized into 10 bins and its probability is computed for the entire image. Those bins correspond to red, yellow, olive, green, cyan, azure, blue, violet, magenta and pink, respectively. The result is the probability of each bin as shown in Figure 2.
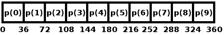
Pixels classified as shadows by the shadow filter are labeled as shadows if their hue component has a probability of less than 0.1. This 0.1 value was defined experimentally after observing the response of many aerial images.
We attempted to classify pixels with low intensity and hue in the interval of blue and violet wavelengths, as suggested by Adler-Golden et al. (2002Adler-Golden, S. M., Matthew, M. W., Anderson, G. P., Felde, G. W. and Gardner, J. A. 2002. Algorithm for de-Shadowing Spectral Imagery. In: Proceedings of SPIE, Imaging Spectrometry VIII , v. 4816, pp.203-210. Seattle: USA. doi:10.1117/12.451691.
https://doi.org/10.1117/12.451691...
) and Polidorio et al. (2003Polidorio, A. M., Flores, F. C., Imai, N. N., Tommaselli, A. M. G. and Franco, C. 2003. Automatic Shadow Segmentation in Aerial Color Images. In: Proceedings of the XVI SIBGRAPI. XVI
Brazilian Symposium on Computer Graphics and Image Processing. São Carlos, Brasil, 12-15 October 2003. doi:10.1109/SIBGRA.2003.1241019.
https://doi.org/10.1109/SIBGRA.2003.1241...
). The filter we use is able to find low intensities and the detector becomes good for deep shadow labeling when considering only the aforementioned wavelengths. To include cast shadows in the package, one must add hue intervals with small probability in the image.
We performed experiments with five images, containing urban areas, grass, trees, asphalt, crop, etc. The performance of our technique can be visually assessed when compared with the Santos' and Polidorios’s approach (Figure 3). Polidorio’s technique is based on the difference between I and S components of HIS color space. Subtracting S from I gives a shadow index, which is compared to a threshold. The authors stated that negative values correspond to shadows for the aerial case. Using this threshold value in our images does not detect more than a few shadowed pixels. This can be explained because this technique was originally created for satellite images, although they had also defined the threshold for aerial images. To improve their results we tuned the values empirically until the detection results were acceptable. We realized that the more the threshold is increased the more the vegetation is misclassified as shadows. Shadows from asphalt are not detected until the threshold is high enough to classify almost all vegetation as shadows. Figure 3 presents the Polidorio’s technique with manually tuned thresholds.
Results of Figure 3 show that Santos’ approach overperformed the detection. Our technique uses Santos' filter to find the low intensities but removes detected pixels that do not meet the requirement of low probability in the hue histogram.
Table 1 shows that blue, violet and magenta have the lowest probabilities. The cases in which their associated pixels have low intensities suggest they belong to shadow areas.
Figure 4 shows the pseudocode with the entire process.
4. Terrestrial images
This section deals with the problem of shadow detection in terrestrial images taken from off-the-shelf cameras.
The spectrum ratio properties of shadows described by Tian et al. (2016Tian, J., Qi, X., Qu, L. and Tang, Y. 2016. New Spectrum Ratio Properties and Features for Shadow Detection. Pattern Recognition, 51, pp.85-96. doi:http://dx.doi.org/10.1016/j.patcog.2015.09.006.
https://doi.org/dx.doi.org/10.1016/j.pat...
) was shown to be promising when combined with the shadow filter developed by Santos et al. (2006Santos, D., Dalmolin, Q. and Basso, M. A. 2006. Detecção Automática de Sombras em Imagens de Alta Resolução. Boletim de Ciências Geodésicas , 12(1), pp.87-99. http://ojs.c3sl.ufpr.br/ojs2/index.php/bcg/article/view/5310/3931.
http://ojs.c3sl.ufpr.br/ojs2/index.php/b...
). In this section we show how to combine both techniques to detect shadows in terrestrial images. Further, we are interested in shadow areas and not only in shadow edges (Tian et al., 2016, Lalonde et al., 2010Lalonde, J. F., Efros, A. A., and Narasimhan, S. G. 2010. Detecting Ground Shadows in Outdoor Consumer Photographs. In: Proceedings of the ECCV’10, pp.322-335. 11
th
European Conference on Computer Vision
: Part II. Berlin, Heidelberg: Springer-Verlag.). Detecting areas instead of edges gives clues about regions to be avoided or differently approached in algorithms such as image matching, object detection/recognition, and traffic monitoring.
As shown in Section 3, the input image is converted to grayscale and is also smoothed to remove noise before the process. Moreover, the thresholding step described in Equation 1 is replaced by an adaptive process. Here the threshold k is not static, but the mean value μ of the input image in grayscale multiplied by 1.3, i.e, k = 1.3 μ. This value was achieved empirically, after many simulations with different images.
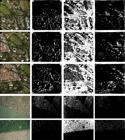
Results with aerial images. First column is the original input image, second is our result, third is Santos’, and last is the Polidorio’s approach with manually tuned thresholds.
Figure 5 shows a comparison between the two thresholding processes - static and adaptive. As one can verify, the static threshold may classify more shadows than necessary. The opposite is also true, because it does not change according to input image. Our adaptive threshold solves this problem for most cases.
After applying the shadow filter, the resulting image does not usually contain every shadow pixel detected. Hence we use the spectrum ratio theory (Tian et al., 2016Tian, J., Qi, X., Qu, L. and Tang, Y. 2016. New Spectrum Ratio Properties and Features for Shadow Detection. Pattern Recognition, 51, pp.85-96. doi:http://dx.doi.org/10.1016/j.patcog.2015.09.006.
https://doi.org/dx.doi.org/10.1016/j.pat...
) to find the remaining pixels. The spectrum ratios are calculated using Equation 5, as follows
in which H represents a color channel, F H is the average value in a predefined shadow free area and f H from a shadowed one. In other words, k is function of contrast.

Comparison between the static and adaptive thresholding for shadow mask usage. Static is always 255 and adaptive is 1.3 times the mean of the input image
Tian et al. (2016Tian, J., Qi, X., Qu, L. and Tang, Y. 2016. New Spectrum Ratio Properties and Features for Shadow Detection. Pattern Recognition, 51, pp.85-96. doi:http://dx.doi.org/10.1016/j.patcog.2015.09.006.
https://doi.org/dx.doi.org/10.1016/j.pat...
) observed shadowed regions at different Sun angles and calculated their spectrum ratios. Their experimental results showed that shadows present the following properties:
Property 1. The values of K H decrease as Sun angle increases.
Property 2. The values of K
H (H=R,G,B) satisfy K
R
>K
G
>K
B . Polidorio et al. (2003Polidorio, A. M., Flores, F. C., Imai, N. N., Tommaselli, A. M. G. and Franco, C. 2003. Automatic Shadow Segmentation in Aerial Color Images. In: Proceedings of the XVI SIBGRAPI. XVI
Brazilian Symposium on Computer Graphics and Image Processing. São Carlos, Brasil, 12-15 October 2003. doi:10.1109/SIBGRA.2003.1241019.
https://doi.org/10.1109/SIBGRA.2003.1241...
) also considers that shadows have the blue component higher than red and green. This results in K
B being smaller than K
R and K
G .
Property 3. The differences between K
H satisfy K
R
-K
G
˂K
G
-K
B . Similarly, it confirms one of the assumptions of Polidorio et al. (2003Polidorio, A. M., Flores, F. C., Imai, N. N., Tommaselli, A. M. G. and Franco, C. 2003. Automatic Shadow Segmentation in Aerial Color Images. In: Proceedings of the XVI SIBGRAPI. XVI
Brazilian Symposium on Computer Graphics and Image Processing. São Carlos, Brasil, 12-15 October 2003. doi:10.1109/SIBGRA.2003.1241019.
https://doi.org/10.1109/SIBGRA.2003.1241...
), that the contrast in blue is smaller because shadows are blue.
Property 4. The value of K H angle at any angle is less than twice the value of K H angle+10 . Their experimental results considered Sun angles within the interval [20 o , 80 o ], varying in steps of 10 o . The aforementioned properties are checked as follows:
Properties 1 and 4.τH.KH0 < K H <η H . K H 20 , with K H 80 representing K H at a Sun angle of 80 o . The tolerance coefficients are τ H = 2 -1 and η H =2 2 , representing the possibilities for Sun angles within the interval [0 o ,90 o ], according to Property 4.
Property 3. For this case, ϵ=(K R 80 - K G 80 )/2 is the lower bound for the difference between K R and K G , and shadow regions must satisfy Equation 6.
In our approach we do not rely on shadow borders as Tian et al. (2016Tian, J., Qi, X., Qu, L. and Tang, Y. 2016. New Spectrum Ratio Properties and Features for Shadow Detection. Pattern Recognition, 51, pp.85-96. doi:http://dx.doi.org/10.1016/j.patcog.2015.09.006.
https://doi.org/dx.doi.org/10.1016/j.pat...
), but regions. They calculated this ratio using pixels from both sides of a shadow border, expecting that they belonged to the same object. Here K
H depends on F
H calculated with known shadow free zones, and f
H is computed from a shadow candidate window.
Known shadow free zones are defined right after applying the shadow mask, with pixels classified as shadow free. f H is computed in a 3 x 3 window that moves through the input color image. The central pixel of this window is labeled as shadow when K H fits the four properties.
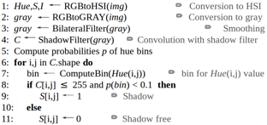
Finally the output image goes through a morphology operation of closing to remove noise. Figure 6 shows the pseudocode with the complete process.
The values of those predefined spectrum ratios, namely K
H
80 and K
H
20 , were extracted from Tian et al. (2016Tian, J., Qi, X., Qu, L. and Tang, Y. 2016. New Spectrum Ratio Properties and Features for Shadow Detection. Pattern Recognition, 51, pp.85-96. doi:http://dx.doi.org/10.1016/j.patcog.2015.09.006.
https://doi.org/dx.doi.org/10.1016/j.pat...
): K
R
20
= 12.11, K
R
80
= 3.18, K
G
20
= 10.40, K
G
80
= 2.86, K
B
20
= 8.10, K
B
80
= 2.53.

4.1 Results and discussion
Results are assessed via comparison with reference shadow maps, using metrics P and R based on true positives, false negatives and false positives.
P represents the detection precision, which is given by the ratio between true positives TP and the total region of shadows, which is the sum of TP and false negatives FN (Equation 7). It shows the percentage of true shadows correctly detected.
R is given by the ratio between true positives TP of Equation 8 and the total region of pixels classified as shadows. This measure tells how many of the classified shadows are true shadows.
A third factor, called F-measure, corresponds to a combination of P and R. It is given by Equation 9.
The three measures correspond to pixel-wise analysis of the predicted shadow map and the respective ground truth. The higher they are, the better the results.
We assessed our technique with Guo’s dataset (Guo et al., 2011Guo, R., Qieyun, D., and Hoiem, D. 2011. Single-Image Shadow Detection and Removal Using Paired Regions. In: Proceedings of the CVPR ’11. IEEE
Conference on Computer Vision and Pattern Recognition, 2033(40). Washington, DC, USA: IEEE Computer Society. doi:10.1109/CVPR.2011.5995725.
https://doi.org/10.1109/CVPR.2011.599572...
) containing 355 images with a great variety of targets, including grass, trees, buildings, houses, snow, sidewalks, asphalt, etc. Figure 7 shows the results of the proposed technique in comparison with Blajovici et al. (2011Blajovici, C., Kiss, P. J., Bonus, Z. and Varga, L. 2011. Shadow detection and removal from a single image. In: Proceedings of 19th SSIP, 19th Summer School on Image Processing. Szeged, Hungary, 7-16 July 2011.).

Our results are quite similar, but with the difference that our technique performed the detection in about 60 seconds, while their algorithm took about 4 hours. Tian et al. (2016Tian, J., Qi, X., Qu, L. and Tang, Y. 2016. New Spectrum Ratio Properties and Features for Shadow Detection. Pattern Recognition, 51, pp.85-96. doi:http://dx.doi.org/10.1016/j.patcog.2015.09.006.
https://doi.org/dx.doi.org/10.1016/j.pat...
) evaluated their algorithm with the same dataset, but considered only shadow edges (not areas) and achieved P/R/F = 0.69 / 0.73 / 0.66.
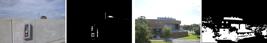
Some results of the technique proposed in this paper can be seen in Figure 8.
Figure 9 shows detection problems. Dark objects are sometimes labeled as shadows because of their similar radiometric response. Besides, very complex scenes, containing various targets such as trees, buildings, roads, grass, sidewalks, etc., may confuse the spectrum ratio analysis. It happens because here we calculate F
H for each component as an average of the non-shadowed area. To increase the detection quality, one should detect shadow edges and analyze the spectrum ratio properties for each separately (Tian et al., 2016Tian, J., Qi, X., Qu, L. and Tang, Y. 2016. New Spectrum Ratio Properties and Features for Shadow Detection. Pattern Recognition, 51, pp.85-96. doi:http://dx.doi.org/10.1016/j.patcog.2015.09.006.
https://doi.org/dx.doi.org/10.1016/j.pat...
).
5. Conclusion
The problem of shadow detection in aerial and outdoor color images was addressed in this paper by modifying and combining existing techniques. In both cases the algorithms used a shadow filter to find low intensities, which is a characteristic of shadows.
For aerial images we employed a validation process that considers as shadows only pixels with low probability in the hue histogram. It follows the assumption that deep shadows usually presents wavelengths in the interval of blue and violet, and aerial images usually have a small number of pixels with those properties. Furthermore, we considered not only blue and violet, because cast shadows often present a wider range of colors.

The algorithm for aerial images was assessed in an experiment with five images and the results were visually compared to other two techniques, showing good detection efficacy.
The second part of this work focused on outdoor color images taken by off-the-shelf cameras. As in the aerial case, the algorithm starts with the shadow filter, but it does not rely on a validation step. Instead, it uses a spectrum ratio analysis which consists of a comparison between the non-shadowed region spectrum and the spectrum of a candidate area. When this ratio meets certain properties, it classifies the candidate area as a shadow region. Individually, the shadow filter detects fewer shadows than expected. Meanwhile, when combined with this spectrum ratio analysis, results became better.
ACKNOWLEDGEMENTS
The authors would like to thank the Conselho Nacional de Desenvolvimento Científico e Tecnológico (CNPq) and Coordenação de Aperfeiçoamento de Pessoal de Nível Superior (CAPES) for their financial support
REFERENCES
- Adler-Golden, S. M., Matthew, M. W., Anderson, G. P., Felde, G. W. and Gardner, J. A. 2002. Algorithm for de-Shadowing Spectral Imagery. In: Proceedings of SPIE, Imaging Spectrometry VIII , v. 4816, pp.203-210. Seattle: USA. doi:10.1117/12.451691.
» https://doi.org/10.1117/12.451691 - Blajovici, C., Kiss, P. J., Bonus, Z. and Varga, L. 2011. Shadow detection and removal from a single image. In: Proceedings of 19th SSIP, 19th Summer School on Image Processing Szeged, Hungary, 7-16 July 2011.
- Centeno, J. A. S., and Pacheco, A. P. 2011. Classificação de Sombra Em Imagens Orbitais E Aéreas Usando Uma Matriz de Co-Ocorrência Modificada. Boletim de Ciências Geodésicas, 17 (1).
- Dare, P. M. 2005. Shadow Analysis in High-Resolution Satellite Imagery of Urban Areas. Photogrammetric Engineering and Remote Sensing, 71(2), pp.169-77.
- Devi, G., Kaliappan, S. and Malini,M. 2011. Stochastic Method for De-Shadowing and Objects Retrieval from High Resolution Images. International Journal on Computer Science and Engineering (IJCSE), 4(3), pp.1468-78.
- Fisher, B. 2016. Bilateral Filtering for Gray and Color Images. Available at: Available at: http://homepages.inf.ed.ac.uk/rbf/CVonline/LOCAL_COPIES/MANDUCHI1/Bilateral_Filtering.html#Index Accessed September 2016;.
» http://homepages.inf.ed.ac.uk/rbf/CVonline/LOCAL_COPIES/MANDUCHI1/Bilateral_Filtering.html#Index - Gonzalez, R C, and Woods, R E. 2010. Processamento Digital de Imagens. Book. 3rd ed. São Paulo: Pearson Pretience Hall.
- Guo, R., Qieyun, D., and Hoiem, D. 2011. Single-Image Shadow Detection and Removal Using Paired Regions. In: Proceedings of the CVPR ’11. IEEE Conference on Computer Vision and Pattern Recognition, 2033(40). Washington, DC, USA: IEEE Computer Society. doi:10.1109/CVPR.2011.5995725.
» https://doi.org/10.1109/CVPR.2011.5995725 - Imai, N. N., Polidório, A. M., Tommaselli, A. M. G., and Barros, A. F. 2014. Uso de sombras na correção do efeito vinhete. Boletim de Ciências Geodésicas (Online), 20(1), pp.100-116.
- Lalonde, J. F., Efros, A. A., and Narasimhan, S. G. 2010. Detecting Ground Shadows in Outdoor Consumer Photographs. In: Proceedings of the ECCV’10, pp.322-335. 11 th European Conference on Computer Vision : Part II Berlin, Heidelberg: Springer-Verlag.
- Polidorio, A. M., Flores, F. C., Imai, N. N., Tommaselli, A. M. G. and Franco, C. 2003. Automatic Shadow Segmentation in Aerial Color Images. In: Proceedings of the XVI SIBGRAPI. XVI Brazilian Symposium on Computer Graphics and Image Processing São Carlos, Brasil, 12-15 October 2003. doi:10.1109/SIBGRA.2003.1241019.
» https://doi.org/10.1109/SIBGRA.2003.1241019 - Santos, D., Dalmolin, Q. and Basso, M. A. 2006. Detecção Automática de Sombras em Imagens de Alta Resolução. Boletim de Ciências Geodésicas , 12(1), pp.87-99. http://ojs.c3sl.ufpr.br/ojs2/index.php/bcg/article/view/5310/3931
» http://ojs.c3sl.ufpr.br/ojs2/index.php/bcg/article/view/5310/3931 - Tian, J., Qi, X., Qu, L. and Tang, Y. 2016. New Spectrum Ratio Properties and Features for Shadow Detection. Pattern Recognition, 51, pp.85-96. doi:http://dx.doi.org/10.1016/j.patcog.2015.09.006.
» https://doi.org/dx.doi.org/10.1016/j.patcog.2015.09.006 - Tian, J., Sun, J., and Tang, Y. 2009. Tricolor Attenuation Model for Shadow Detection. IEEE Transactions on Image Processing, 18(10), pp.2355-2363. doi:10.1109/TIP.2009.2026682.
» https://doi.org/10.1109/TIP.2009.2026682
Publication Dates
-
Publication in this collection
Oct-Dec 2017
History
-
Received
25 Oct 2016 -
Accepted
19 June 2017


