
Abstract
Early visual changes caused by diabetes include color vision losses and an abnormal full-field electroretinogram. The purpose of this study was to evaluate color vision in type 2 diabetic patients with no clinically detectable retinopathy using an objective psychophysical color vision test, evaluate retinal function assessed by full-field electroretinography (ffERG), and verify the agreement among the changes detected by each of these tests. Color vision was tested and ffERG was performed in 34 diabetic patients (20 males; ages 56 ± 9 years). Results were compared with those obtained from age-matched control groups. Color discrimination losses occurred in all three color-confusion axes with a higher incidence on the protan axis. The full-field electroretinographic data indicated that inner retinal components (i.e., ffERG oscillatory potentials) were more affected than outer retinal components, indicating impairment of second- and third-order retinal neurons early in the disease. Previous studies reported tritan losses as a classic color vision defect in diabetes, but our results showed that all three color-confusion axes (i.e., protan, deutan, and tritan) are compromised, at least during the very early stages of the disease, reflecting a diffuse pattern of color vision loss. The full-field electroretinographic results that showed abnormalities of the inner retina support the color vision findings.
color vision; psychophysics; diabetes mellitus; diabetic retinopathy; electroretinogram; visual electrophysiology; visual perception
Early visual changes in diabetic patients with no retinopathy measured by color discrimination and electroretinography
Mirella GualtieriI; Claudia Feitosa-SantanaII; Marcos LagoI; Mauro NishiI,III; Dora Fix VenturaI
IUniversidade de São Paulo, São Paulo, SP, Brazil
IIRoosevelt University, Chicago, IL, USA
IIIUniversidade Federal de São Paulo, São Paulo, SP, Brazil
Correspondence to Correspondence: Mirella Gualtieri Instituto de Psicologia, Universidade de São Paulo Av. Prof. Mello Moraes, 1721 São Paulo, SP, 05508-030, Brasil Phone: +55 11 30918611. E-mail: mirellag@usp.br
ABSTRACT
Early visual changes caused by diabetes include color vision losses and an abnormal full-field electroretinogram. The purpose of this study was to evaluate color vision in type 2 diabetic patients with no clinically detectable retinopathy using an objective psychophysical color vision test, evaluate retinal function assessed by full-field electroretinography (ffERG), and verify the agreement among the changes detected by each of these tests. Color vision was tested and ffERG was performed in 34 diabetic patients (20 males; ages 56 ± 9 years). Results were compared with those obtained from age-matched control groups. Color discrimination losses occurred in all three color-confusion axes with a higher incidence on the protan axis. The full-field electroretinographic data indicated that inner retinal components (i.e., ffERG oscillatory potentials) were more affected than outer retinal components, indicating impairment of second- and third-order retinal neurons early in the disease. Previous studies reported tritan losses as a classic color vision defect in diabetes, but our results showed that all three color-confusion axes (i.e., protan, deutan, and tritan) are compromised, at least during the very early stages of the disease, reflecting a diffuse pattern of color vision loss. The full-field electroretinographic results that showed abnormalities of the inner retina support the color vision findings.
Keywords: color vision, psychophysics, diabetes mellitus, diabetic retinopathy, electroretinogram, visual electrophysiology, visual perception.
Background
Color vision is one of the earliest visual functions to be affected by diabetes mellitus (for review, see Ewing, Deary, Strachan, & Frier, 1998; Fletcher, Phipps, Ward, Puthussery, & Wilkinson-Berka, 2007). The general consensus from most previous studies is that diabetes mellitus leads to a tritan color vision defect (i.e., loss of discrimination along the blue/yellow axis). Tritan defects have been explained by higher susceptibility of short-wavelength cones in the retina (Cho, Poulsen, Ver Hoeve, & Nork, 2000) and early yellowing of the lens in the diabetic eye (Tregear, Knowles, Ripley, & Casswell, 1997). A few studies, however, have reported diffuse color vision impairment in diabetic patients in which discrimination along both the blue/yellow and red/green axes is affected (Feitosa-Santana, Paramei, Nishi, Gualtieri, Costa, & Ventura, 2010; Fristrom, 1998; Kurtenbach, Wagner, Neu, Schiefer, Ranke, & Zrenner, 1994; Ventura et al., 2003b). Such a defect is thought to be associated with additional inner retinal damage. Overall, color vision losses correlate with the degree of diabetic retinopathy or macular edema when these conditions are present (Tregear et al., 1997; Maar, Tittl, Stur, Zajic, & Reitner, 2001). In many cases, however, they may precede clinically detectable retinal vascular abnormalities (for review, see Fletcher et al., 2007).
Color vision in diabetic patients has generally been evaluated using classic color arrangement tests such as the FM-100 Hue or D-15 (Doucet, Moore, Gancel, Courtois, & Schrub, 1991; Fong, Barton, & Bresnick, 1999; Ismail & Whitaker, 1998; Trick, Burde, Gordon, Santiago, & Kilo, 1988). Nonetheless, computerized quantitative psychophysical color vision tests have been shown to provide better detection of visual impairment than arrangement tests (Castelo-Branco, Faria, Forjaz, Kozak, & Azevedo, 2004; Costa, Oliveira, Feitosa-Santana, Zatz, & Ventura, 2007; Feitosa-Santana et al., 2008; Ventura et al., 2003a,b, 2004, 2005a,b, 2007). Among these tests is the Cambridge Colour Test (CCT), a quantitative computer-based test that is suitable for clinical application because it requires a very simple response from the subject with straightforward and easy-to-understand instructions. The CCT is objective, has high test-retest reliability, and is not influenced by the effects of learning or fatigue (Costa, Ventura, Perazzolo, Murakoshi, & Silveira, 2006). Only two previous studies, both from our group (Ventura et al., 2003b; Feitosa-Santana et al., 2010), have conducted color vision assessment with quantitative computer-based tests in diabetic patients. Both studies, however, reported only psychophysical findings and did not correlate the results with any data on the physiological status of the sensory system at any level.
Visual impairments might have retinal or central origins. Thus, the assessment of visual function at different levels of processing is useful for identifying the structures involved and the basis for the visual loss. Full-field electroretinography (ffERG; i.e., the recording of electrical retinal mass responses to visual stimuli) provides access to the general functional status of the retina. The full-field electroretinogram is composed of three major components: a-, b-, and c-waves. The a-wave reflects the reduction of the dark current caused by light stimulation and originates from the activity of photoreceptors and OFF-bipolar cells. The origin of the b-wave is less clear. It depends on the activity of ON-center bipolar cells in response to light, either directly or through membrane potential changes in Muller cells (Asi & Perlman, 1992). Oscillatory potentials (OPs) are a high-frequency component observed between the peaks of the a- and b-waves that reflects the activity of the inner retina generated by negative feedback pathways among amacrine, ganglion, and bipolar cells (Wachtmeister & Dowling, 1978; for review, see Wachtmeister, 1998).
Full-field electroretinography has been shown to be a sensitive method for the detection of retinal impairment during the early stages of diabetes and follow-up of the grading of diabetic retinopathy (Lovasik & Kergoat, 1993; Holopigian, Greenstein, Seiple, Hood, & Carr, 1997). The OP has been suggested to be the most affected component of the full-field electroretinogram in diabetic patients (Shirao & Kawasaki, 1998; Tzekov & Arden, 1999; Asi & Perlman, 1992; Lovasik & Kergoat, 1993), and the delay or amplitude reduction of the OP is well-known to be attributable to vascular dysfunction in the retina (Luu, Szental, Lee, Lavanya, & Wong, 2010; Tzekov & Arden, 1999).
The present study investigated functional losses in subjects with type 2 diabetes with no clinical evidence of retinopathy. We used different methods of assessing visual function-one psychophysical and one electrophysiological-and discuss how the findings generated from these two methods are related to contribute to a better understanding of the course of early sensory damage caused by type 2 diabetes.
Methods
Participants
Thirty-four type 2 diabetic patients (20 males; mean age 56 ± 9 years; mean duration of disease 7 ± 6 years) were tested in both the color discrimination and full-field electroretinographic tests. Patients underwent ophthalmologic evaluation and were included in the experimental group if they presented no media opacities and no retinal alterations caused by diabetes or other causes (e.g., microaneurysms, intraretinal hemorrhages, cotton-wool spots, retinal edema, hard exudates, venous beading, neovascularization, and vitreous or preretinal hemorrhage). All patients had at least 20/30 best-corrected visual acuity.
Age-matched control subjects were examined using the same tests. The color vision control group was comprised of 23 individuals (11 males; mean age 62 ± 8 years). Eight of these subjects formed the ffERG control group (eight males; mean age 63 ± 8 years).
Both the color discrimination and full-field electroretinographic assessments were monocular and performed with the dominant eye. The preferential eye for gazing was determined using the sight-down-a-tube procedure in which the subject is asked to gaze binocularly at a small object through a restricted opening, and then each eye is alternately covered.
Cambridge colour test
The CCT (Cambridge Research Systems, Kent, UK) was used to measure color discrimination thresholds. The CCT is a computerized test based on the pseudoisochromatic plate paradigm (Mollon & Reffin, 1989). The visual stimulus consisted of a 5-degree colored Landolt-C target presented against a background on a high-resolution video monitor placed 2.6 m away from the subject. The target (Landolt-C) and background had different chromaticities and were each composed of circular patches that varied in size pseudo-randomly (.5-2 cm diameter; i.e., .11-.44 degrees) and luminance (six equal steps between 8 and 18 cd/m2), providing spatial and luminance noise to ensure that the discrimination between the target and background was solely based on the chromatic difference between the stimulus and background. The line that connected the target and background chromaticities defined a vector in 1976 CIE u'v' space (Mollon & Reffin, 1989). Vectors that connect any chromaticity to the background chromaticity could be defined to determine the thresholds around the background chromaticity.
During the test session, the chromaticity of the background remained constant, whereas the chromaticity of the Landolt-C varied along different directions (vectors) in the 1976 CIE diagram. The orientation of the C was randomly changed from trial to trial, so the gap in the stimulus could be at one of four possible locations (i.e., top, bottom, left, or right). At each vector location within the CIE diagram, a color discrimination threshold was determined with a four-alternative forced-choice, double-interleaved staircase. The participants were instructed to identify the position of the stimulus gap by pressing the corresponding button on a response box. If the subject's response was correct, then the subsequent stimulus was set to a chromaticity one step closer to the background along the vector being tested. If the response was wrong, then the chromaticity of the subsequent stimulus was set one step away from the background chromaticity. Step size decreased close to threshold according to a dynamic staircase algorithm (Cambridge Research Systems) that terminated after 12 reversals. Threshold staircases took approximately 4 min to complete.
The thresholds were measured in two test settings, the Trivector and Ellipses tests. The first measured discrimination along three vectors-protan, deutan, and tritan color confusion axes-against a background chromaticity (u' = .197, v' = .469). In the Ellipses test (MacAdam ellipses), test thresholds were measured along eight vectors around a background chromaticity in the 1976 CIE diagram, and an ellipse was fitted around the thresholds obtained. Five ellipses were determined around five different background chromaticities displayed horizontally and vertically around a center chromaticity that was approximately achromatic. The locations of each of the ellipses in the CIE diagram were as follows: ellipse 1, u' = .1977 and v' = .4689; ellipse 2, u' = .1925 and v' = .5092; ellipse 3, u' = .2044 and v' = .4160; ellipse 4, u' = .1580 and v' = .4738; ellipse 5, u' = .2422 and v'= .4634.
To generate and present the stimuli, we used a 15-bit graphic board (VSG 2/5, Cambridge Research Systems Ltd., Kent, UK) and a 20" video monitor (Sony Trinitron GDM-F500T9) with a frame rate of 100 Hz and resolution of 800 × 600 pixels.
Electroretinography
The participants' pupils were dilated with 1% tropicamide and fitted with a bipolar contact lens electrode (Goldlens; Doran Instruments, Inc., Littleton, MA, USA) placed on the cornea anesthetized with .5% proparacaine hydrochloride. A ground electrode (F-E5GH; Grass Products, Natus Medical, Inc., San Carlos, CA, USA) was attached to the earlobe of the participants.
The acquisition and recording system consisted of an amplifier (ICP511A; Grass Instruments), analog-to-digital acquisition board (NB1; National Instruments, Austin, TX, USA), and customized electroretinographic analysis software developed by Steven Nusinowitz (Jules Stein Eye Institute, University of California, Los Angeles, CA, USA). Light stimulation was produced by a photo stimulator (PS33 plus; Grass Products, Natus Medical Inc.) in a Ganzfeld (2503B-; LKC Systems Inc., Gaithersburg, MD, USA).
The procedure followed the International Society of Clinical Electrophysiology of Vision (ISCEV) clinical protocol for ffERG. The protocol includes five different recording settings: (1) rod response, (2) combined rod-cone response, (3) OPs, (4) single-flash cone response, and (5) 30 Hz flicker response.
Data analysis
We considered the following results for the color vision assessment: thresholds measured along the protan, deutan, and tritan color confusion axes in the Trivector test and area of the five ellipses measured in the Ellipses test. We analyzed the following parameters for the full-field electroretinographic results: peak-to-peak amplitude and latency between the onset of the stimulus and the peak of the wave in all five protocols according to ISCEV standards. For the waveforms recorded in the maximal scotopic response, the amplitude ratio of the b-wave relative to the a-wave (b/a) was calculated.
To classify individual results from patients, we established normal limits for all tests and parameters corresponding to the 95th percentile of the controls' data. Based on the normal limits, all patients had their results classified as either normal or abnormal.
Correlation analyses between the results obtained in the study and clinical parameters were also performed. Clinical parameters included duration of diabetes (i.e., time since diagnosis), glucose level at the time of the test, and percentage of glycated hemoglobin (HbA).
Adherence of the data to the normal curve was checked using the Kolmogorov-Smirnov test. Because the data failed to fit into a normal distribution, a nonparametric statistical analysis (Kruskal-Wallis test) was performed to compare results between patients and controls. The heterogeneity of the distribution between groups was also determined using the Levene test.
Results
Color vision
The age-matched normal limits for the CCT are presented in Figure 1 together with the individual data from type 2 diabetic patients. Individual color discrimination thresholds were abnormal in 47% (16/34), 44% (15/34), and 20% (7/34) of the patients for protan, deutan, and tritan axes, respectively (Figure 1). The mean thresholds for the diabetic patients were higher than for controls for the three color confusion axes in the Trivector test. The comparison between groups, however, revealed a significant difference only for protan thresholds (Kruskal-Wallis test, p < .05). Figure 1 shows the mean thresholds for patients and controls measured in the Trivector test and individual data points for both groups.
In the Ellipses test, individual ellipses in diabetic patients showed that the normal limits were exceeded in 55% (19/34), 29% (10/34), 15% (5/34), 20% (7/34), and 12% (4/34) of the patients for ellipses one to five, respectively. The comparison between patients and controls revealed a significant difference between groups only for the central ellipse. Figure 2 shows the average ellipses for patients and controls and the distribution of individual data of the ellipse areas for the patients.
Table 1 shows the correlation factor (R) and results for the null hypothesis (p-value) for each of the color vision test parameters correlated with duration of the disease, glucose level at the time of the test, and HbA.
Electroretinography
Recordings from diabetic patients varied considerably among subjects, ranging from normal to extremely abnormal. Figure 3 shows example ERG results for controls, a diabetic patient who had a normal ffERG, and a diabetic patient who had an abnormal ffERG. Examples of these individual data illustrate the pattern of the full-field electroretinographic data observed in the present study. The responses varied highly among individuals. Despite the variability in the results from the patients, the average results from the patient and control groups differed significantly in most of the recording protocols.
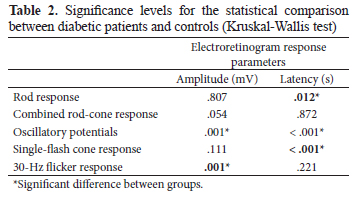
The analysis of the individual data showed that abnormal responses were more prevalent in the O1 OP (29/34 [85%]). Figure 4 shows the individual results of patients in each of the full-field electroretinographic recordings.
None of the full-field electroretinographic data correlated significantly with any of the clinical parameters (i.e., years since diagnosis, glycemia at the time of the test, and percentage of HbA).
Comparison between tests
Table 3 shows the classification of the performance of the diabetic patients in each test relative to the normal limits determined by the control group data. A result was considered abnormal if any of the parameters of the test were outside the normal limit calculated from the control group.
A greater number of individuals was classified with abnormal performance in both tests (16/34 [47%]) than in one test alone (13/34 [38%] and 5/34 [15%]). More subjects were abnormal only on the full-field electroretinogram (13/34 [38%]) than only in the color vision test (5/34 [15%]). No subject from the sample was normal in both tests.
Discussion
The elevated color vision thresholds and reduced or delayed retinal electrical responses confirm previous reports on early functional losses that are detectable prior to the clinical establishment of diabetic retinopathy (Ewing et al., 1998; Fletcher et al., 2007; Shirao & Kawasaki, 1998). However, the present study was the first to compare these responses in the same group of patients by employing a rigorous psychophysical procedure for the color vision evaluation and the standard electrophysiological exam.
The color vision data reported herein showed that both red/green and blue/yellow confusion axes were affected in diabetic patients without retinopathy. Only a few color vision studies have reported changes along both the red-green and blue/yellow axes in diabetic patients (Kurtenbach et al., 1994; Trick et al., 1988; Feitosa-Santana et al., 2006, 2010), and these findings diverge from the prevalent notion that diabetics have preferential or exclusive tritan defects, which was suggested by earlier studies (Roy, McCulloch, Hanna, & Mortimer, 1984; Fong et al., 1999; Lombrail, Cathelineau, Gervasis, & Thibult, 1984; Muntoni, Serra, Mascia, & Songini, 1982). A possible reason for the diffuse loss in color discrimination might be the high sensitivity of the test used for color vision assessment. Previous studies used different types of color vision tests, mostly the Farnsworth-Munsell 100 Hue test (i.e., an arrangement test that does not measure thresholds). The CCT has been shown to be more sensitive to detecting visual losses than the other available tests (Castelo-Branco et al., 2004; Costa et al., 2007; Ventura et al., 2003a,b, 2005a,b, 2007). The red-green defects observed in the present study may not have been detected previously because of the lower sensitivity of the prior tests.
The impaired red/green discrimination and blue-yellow loss in diabetic patients suggest the existence of different causes of the functional defect other than the susceptibility of S-cones and early yellowing of the lens, which were previously considered to be the causes of diabetic visual defects. According to the Verriest classification of color vision defects and the Kollner's rule red/green defects are attributable to damage of the inner retina, whereas tritan defects are attributable to photoreceptor damage (Pokorny & Smith, 1986).
The present data suggest that the observed color vision impairment is associated with the long-term effects of the disease despite the absence of clinically observable retinopathy. We found correlations between color vision thresholds and both the time since diagnosis and HbA levels but not glucose level at the time of examination. These results suggest that the longer duration of the disease is associated with greater chronic hyperglycemia and subsequently greater color vision defects.
Our full-field electroretinographic data also indicate the abnormal function of inner retina neurons reflected by the high incidence of abnormalities in OPs in 85.29% of the patients. These findings are consistent with the view that retinal neural dysfunction may precede clinical signs of vascular alterations detected by the fundus examination (Tzekov & Arden, 1999; Wachtmeister et al., 1998). A reduction or delay of the OP has been reported in diabetic patients with and without retinopathy (Greenstein, Holopigian, Hood, Seiple, & Carr, 2000; Holopigian et al., 1997; Scholl & Zrenner, 2000; Shirao & Kawasaki, 1998; Tzekov & Arden, 1999).
Color vision and full-field electroretinographic results and neural basis of the functional loss
Our color vision test results and full-electroretinographic findings suggest that early diabetic sensory abnormalities are more likely attributable to generalized neural-glial retinal dysfunction rather than specific dysfunction of a specific subsystem such as S-cones or the lens as reported in some studies (Cho et al., 2000; Greenstein et al., 2000; Holopigian et al., 1997; Yamamoto, Takeuchi, & Kamiyama, 1997-1998). Full-field electroretinography revealed changes in the electrical components related to the activity of photoreceptors and bipolar, amacrine, and ganglion cells. Together with previous reports of similar data (Tzekov & Arden, 1999; Ewing et al., 1998; Shirao & Kawasaki, 1998; Wachtmeister et al., 1998; Lovasik & Kergoat, 1993), the presentation of findings that argue against the prevailing view of diabetes as an essentially vascular retinal disease with a tritan color vision defect is important.
Numerous recent morphological and biochemical studies have reported the dysfunction or loss of several retinal cell types beginning in the very early stages of diabetes (Barber, 2003; El-Asrar, Dralands, Missotten, Al-Jadaan, & Geboes, 2004; Fletcher et al., 2007; Lieth, Gardner, Barber, & Antonetti, 2000) and emphasized the importance of approaching diabetes as a neural retinal disease. The present study combined psychophysical and electrophysiological results to corroborate the proposal of neural-based diabetic retinal damage.
Comparison between electroretinography and color vision assessments
Forty-seven percent of the patients presented abnormal results in both tests. The remaining subjects had either abnormal full-field electroretinograms only (38%) or abnormal CCT results only (15%). No subject in the sample had normal results on both tests. These data indicate that this combination of tests may be valuable for clinical use.
Most of the discordant results were cases in which the full-field electroretinogram was abnormal and the CCT was normal (38%). The basis of the discordance in screening for abnormal visual performance between the CCT and ffERG may have a straightforward spatial explanation. Full-field electroretinography reflects the activity of the entire retina including the center and periphery, and color vision thresholds can be mediated by patches of relatively normal retina that are stimulated by the 5-degree stimulus used in the CCT. Thus, abnormal full-field electroretinograms might be observed in subjects with normal color vision. These discordant results, however, may also have another explanation. The psychophysical test is primarily a foveal task that uses a 5-degree visual stimulus to measure color vision. If a sufficient proportion of the overall extrafoveal retina is compromised with relative sparing of the central retina, then the full-field electroretinogram would be abnormal, whereas the psychophysically assessed color vision is normal.
The other discordant result in which the full-field electroretinogram was normal and the CCT results were abnormal (15%) may have resulted from impairment that originated outside the retina.
The processing of psychophysical function measured in the present study depends on the entire visual pathway, and ffERG assesses only the function of the retina. In some individuals, retinal changes may be small or absent, but central changes could affect color vision measured by the CCT. Rectifying processes may also preserve color vision for other patients despite an abnormal full-field electroretinogram and mainly abnormal OP.
Acknowledgements
This work was supported by FAPESP and CNPq. M.G. and C.F.S. have a FAPESP graduate fellowship (02/06247-3) and D.F.V. is a CNPq Research Fellow.
Received 28 June 2012; received in revised form 13 June 2013; accepted 24 June 2013.
Available 18 November 2013.
Mirella Gualtieri, Marcos Lago, and Dora Fix Ventura, Psicologia Experimental, Universidade de São Paulo, São Paulo, Brazil. Cláudia Feitosa-Santana, Department of Psychology, Roosevelt University, Chicago, Illinois, USA. Mauro Nishi, Hospital Universitário, Universidade de São Paulo, São Paulo, Brazil and Departamento de Oftalmologia, Universidade Federal de São Paulo, São Paulo, Brazil.
- Asi, H., & Perlman, I. (1992). Relationships between the electroretinogram a-wave, b-wave and oscillatory potentials and their application to clinical diagnosis. Documenta Ophthalmologica, 79,125-139.
- Barber, A. J. (2003). A new view of diabetic retinopathy: a neurodegenerative disease of the eye. Progress in Neuro-Psychopharmacology and Biological Psychiatry, 27,283-290.
- Castelo-Branco, M., Faria, P., Forjaz, V., Kozak, L. R., & Azevedo, H. (2004). Simultaneous comparison of relative damage to chromatic pathways in ocular hypertension and glaucoma: Correlation with clinical measures. Investigative Ophthalmology and Visual Science, 45,499-505.
- Cho, N. C., Poulsen, G. L., Ver Hoeve, J. N., & Nork, T. M. (2000). Selective loss of S-cones in diabetic retinopathy. Archives of Ophthalmology, 118,1393-1400.
- Costa, M. F., Oliveira, A. G. F., Feitosa-Santana, C., Zatz, M., & Ventura, D. F. (2007). Red-green color vision impairment in Duchenne muscular dystrophy. American Journal of Human Genetics, 80,1064-1075.
- Costa, M. F., Ventura, D. F., Perazzolo, F., Murakoshi, M., & Silveira, L. C. L. (2006). Absence of binocular summation, eye dominance, and learning effects in color discrimination. Visual Neuroscience, 23,461-469.
- Doucet, J., Moore, N., Gancel, A., Courtois, H., & Schrub, J. C. (1991). Diabetic dyschromatopsia: A multifactorial approach in 100 diabetic patients. Diabetes & Metabolism, 17,31-37.
- El-Asrar, A. M. A., Dralands, L., Missotten, L., Al-Jadaan, I. A., & Geboes, K. (2004). Expression of apoptosis marked in the retinas of human subjects with diabetes. Investigative Ophthalmology & Visual Science, 45,2760-2766.
- Ewing, F. M. E., Deary, I. J., Strachan, M. W., & Frier, B. M. (1998). Seeing beyond retinopathy in diabetes: Electrophysiological and psychophysical abnormalities and alterations in vision. Endocrine Reviews, 19,462-476.
- Feitosa-Santana, C., Barboni, M. T. S., Oiwa, N. N., Paramei, G. V., Simoes, A. L., Da Costa, M. F., ... Ventura, D. F. (2008). Irreversible color vision losses in patients with chronic mercury vapor intoxication. Visual Neuroscience, 25,487-491.
- Feitosa-Santana, C., Oiwa, N. N., Paramei, G. V., Bimler, D., Costa, M. F., Lago, M., ... Ventura, D. F. (2006). Color space distortions in patients with type 2 diabetes mellitus. Visual Neuroscience, 23,663-668.
- Feitosa-Santana, C., Paramei, G. V., Nishi, M., Gualtieri, M., Costa, M. F., & Ventura, D. F. (2010). Color vision impairment in type 2 diabetes assessed by the D-15d test and the Cambridge Colour Test. Ophthalmic and Physiological Optics, 30,717-723.
- Fletcher, E. L., Phipps, J. A., Ward, M. M., Puthussery, T., & Wilkinson-Berka, J. L. (2007). Neuronal and glial cell abnormality as predictors of progression of diabetic retinopathy. Current Pharmaceutical Design, 13,2699-2712.
- Fong, D. S., Barton, F. B., Bresnick, G. H. (1999). Impaired color vision associated with diabetic retinopathy: Early Treatment Diabetic Retinopathy Study Report No. 15. American Journal of Ophthalmology, 128,612-617.
- Fristrom, B. (1998). Peripheral and central colour contrast sensitivity in diabetes. Acta Ophthalmologica Scandinavica, 76,541-545.
- Greenstein, V., Holopigian, K., Hood, D. C., Seiple, W., & Carr, R. E. (2000). The nature and extent of retinal dysfunction associated with diabetic macular edema. Investigative Ophthalmology & Visual Science, 41,3643-3654.
- Holopigian, K., Greenstein, V. C., Seiple, W., Hood, D. C., & Carr, R. E. (1997). Evidence for photoreceptor changes in patients with diabetic retinopathy. Investigative Ophthalmology & Visual Science, 38,2355-2365.
- Ismail, G. M., & Whitaker, D. (1998). Early detection of changes in visual function in diabetes mellitus. Ophthalmic and Physiological Optics, 18,3-12.
- Kurtenbach, A., Wagner, U., Neu, A., Schiefer, U., Ranke, M. B., & Zrenner, E. (1994). Brightness matching and colour discrimination in young diabetics without retinopathy. Vision Research, 34,115-122.
- Lieth, E., Gardner, T. W., Barber, A. J., & Antonetti, D. A. (2000). Retinal neurodegeneration: Early pathology in diabetes. Clinical and Experimental Ophthalmology, 28,3-8.
- Lombrail, P., Cathelineau, G., Gervasis, P., & Thibult, N. (1984). Abnormal color vision and reliable self-monitoring of blood glucose. Diabetes Care, 7,318-321.
- Lovasik, J. V., & Kergoat, H. (1993). Electroretinographic results and ocular vascular perfusion in type 1 diabetes. Investigative Ophthalmology & Visual Science, 34,1731-1743.
- Luu, C. D., Szental, J. A., Lee, S. Y., Lavanya, R., & Wong, T. Y. (2010). Correlation between retinal oscillatory potentials and retinal vascular calibre in type 2 diabetes. Investigative Ophthalmology & Visual Science, 51,482-486.
- Maar, N., Tittl, M., Stur, M., Zajic, B., & Reitner, A. (2001). A new colour vision arrangement test to detect functional changes in diabetic macular oedema. British Journal of Ophthalmology, 85,47-51.
- Mollon, J. D., & Reffin, J. P. (1989). A computer-controlled colour vision test that combines the principles of Chibret and Stilling. Journal of Physiology, 414, 5P.
- Muntoni, S., Serra, A., Mascia, C., & Songini, M. (1982). Dyschromatopsia in diabetes mellitus and its relation to metabolic control. Diabetes Care, 5,375-378.
- Pokorny, J., & Smith, V. C. (1986). Eye disease and color defects. Vision Research, 26,1573-1584.
- Roy, M. S., McCulloch, C., Hanna, A. K., & Mortimer, C. (1984). Colour vision in long-standing diabetes mellitus. Bristish Journal of Ophthalmology, 68,215-217.
- Scholl, H. P. N., & Zrenner, E. (2000). Electrophysiology in the investigation of acquired retinal disorders. Survey of Ophthalmology, 45,29-47.
- Shirao, Y., & Kawasaki, K. (1998). Electrical response from diabetic retina. Progress in Retina and Eye Research, 17,59-76.
- Tregear, S. J., Knowles, P. J., Ripley, L. G., & Casswell, A. G. (1997). Chromatic-contrast threshold impairment in diabetes. Eye, 11,537-546.
- Trick, G. L., Burde, R. M., Gordon, M. O., Santiago, J. V., & Kilo, C. (1988). The relationship between hue discrimination and contrast sensitivity deficits in patients with diabetes mellitus. Ophthalmology, 95,693-698.
- Tzekov, R., & Arden, G. B. (1999). The electroretinogram in diabetic retinopathy. Survey of Ophthalmology, 44,53-60.
- Ventura, D. F., Costa, M. T. V., Costa, M. F., Berezovsky, A., Salomão, S. R., Simões, A. L., ... Silveira, L. C. L. (2004). Multifocal and full-field electroretinogram changes associated with color-vision loss in mercury vapor exposure. Visual Neuroscience, 21,421-429.
- Ventura, D. F., Gualtieri, M., Oliveira, A. G. F., Costa, M. F., Quiros, P., Sadun, F., ... Carelli, V. (2007). Male prevalence for color vision defects in Leber's hereditary optic neuropathy asymptomatic carriers of the 11778/ND4 mutation. Investigative Ophtalmology & Visual Science, 48,2362-2370.
- Ventura, D. F., Nishi, M., Bernicki, M., Costa, M. F., Bonci, D., Gualtieri, M., & Souza, J. M. (2003a). Early vision loss in diabetic patients assessed by the Cambridge Colour Test. In J. D. Mollon, I. Pokorny, & K. Knoblauch (Eds.). Normal and defective colour vision (pp. 395-403). Oxford: Oxford University Press.
- Ventura, D. F., Quiros, P., Carelli, V., Salomão, S. R., Gualtieri, M., Oliveira, A. G. F., ... Sadun, A. A. (2005b). Chromatic and luminance contrast sensitivities in asymptomatic carriers from a large Brazilian pedigree of 11778 Leber hereditary optic neuropathy. Investigative Ophthalmology & Visual Science, 46,4809-4814.
- Ventura, D. F., Silveira, L. C. L., Nishi, M., da Costa, M. F., Gualtieri, M., Santos, R. M., ... de Souza, J. M. (2003b). Color vision loss in patients treated with chloroquine. Arquivos Brasileiros de Oftalmologia, 66,9-15.
- Ventura, D. F., Simoes, A. L., Tomaz, S., Costa, M. F., Lago, M., Costa, M. T. V., ... Silveira, L. C. L. (2005a). Colour vision and contrast sensitivity losses of mercury intoxicated industry workers in Brazil. Environmental Toxicology & Pharmacology, 19,523-529.
- Wachtmeister, L. (1998). Oscillatory potentials in the retina: What do they reveal. Progress in Retina and Eye Research, 14,485-521.
- Wachtmeister, L., & Dowling, J. E. (1978). The oscillatory potentials of the mudpuppy retina. Investigative Ophthalmology & Visual Science, 17,1176-1188.
- Yamamoto, S., Takeuchi, S., & Kamiyama, M. (1997-1998). The short wavelength-sensitive cone electroretinogram in diabetes: Relationship to systemic factors. Documenta Ophthalmologica, 94,193-200.
Correspondence:
Publication Dates
-
Publication in this collection
28 Jan 2014 -
Date of issue
2013
History
-
Received
28 June 2012 -
Accepted
24 June 2013 -
Reviewed
13 June 2013


