Abstract
The current study presents the results of tests conducted in 5 reinforced concrete slabs (415 cm x 415 cm x 7 cm) in order to experimentally check the possibility of reinforcing their upper surface, as well as to assess the adhesion between the old and the reinforcing concrete layers in the slab. The main variables were the concrete and reinforcement strength deficiencies. Reference slab “L1” was tested until reaching the failure load, whereas the others were tested until reaching certain load limit, reinforced and retested until reaching the failure load. All slabs failed under bending. The strengthening increased the failure load by 30% in slabs reinforced at minimum reinforcement rate when they were compared to similar non-reinforced slabs, regardless of the original concrete strength. None of the tests conducted in the reinforced slabs showed detachments or evidence of adhesion loss between the old and reinforcing concretes.
Keywords:
slab; reinforced concrete; strengthening; adherence
Resumo
Este trabalho apresenta os resultados dos ensaios de 5 lajes de concreto armado (415 cm x 415 cm x 7 cm) com o objetivo de se verificar experimentalmente a possibilidade de reforço pela face superior de lajes de concreto armado e também de se avaliar a aderência entre o concreto antigo da laje e a camada do concreto do reforço. As principais variáveis foram as deficiências da resistência do concreto e de armadura. A laje L1, de referência, foi ensaiada até a ruptura e as demais até um limite de carregamento quando foram reforçadas e reensaiadas até a ruptura. Todas as lajes romperam por flexão e nas lajes armadas com uma taxa mínima de armadura, o reforço elevou em até 30% a carga de ruptura em relação a uma laje similar sem reforço, independentemente da resistência original do concreto. Em todos os ensaios das lajes reforçadas não se detectou descolamentos ou evidências de perda de aderência entre o concreto antigo e o concreto do reforço.
Palavras-chave:
laje; concreto armado; reforço; aderência
1. Introduction
Over the years, the great demand for the application of reinforced concrete to buildings and other large construction works enabled the emergence of several issues concerning construction, component-material performance and lack of maintenance. More suitable, practical and low-cost solutions started being sought when the first pathologies in reinforced-concrete construction works were detected. Among the most frequent problems of reinforced concrete pieces, one can highlight the large deflections and cracks affecting slabs. Slab issues resulting from low reinforcement ratio, from the use of inadequate concrete and even from inappropriate slab height may lead to restrictions for use and to the need of strengthening.
Several materials can be used for strengthening depending on the adopted technique. The use of reinforced concrete demands deciding about aspects such as cement type, aggregate granulometry and steel grade. When glued-in steel sheets or carbon fibers are used for strengthening purposes, the process requires making special preparations before the gluing procedure is applied, as well as checking the compatibility between material demands and deformations. Weighing the probable causes and consequences associated with the herein proposed solution may improve or not the efficiency of the adopted strengthening method. Every decision, whether they are of structural character or related to actions involving corrosion processes affecting the reinforcement, to fire accidents or shocks, or even to foundation settlements, among others, should be based on the structure strengthening diagnosis. Each case will present one or more solutions depending on the use of appropriate and specific materials.
The surface treated with the new concrete must be rough; it cannot show remnant cement slurry from the old concrete, as well as dust, oil or grease, because these elements can hinder the attachment process. Surface preparation can be performed through electric or pneumatic hammers, manual chipping, mechanical milling machines, high-pressure hydro-demolition equipment (75.0 MPa) and, eventually, through dry or wet sand jet. Reinforcing a piece, column, beam or slab may imply the addition of a new concrete volume (layer) to the old concrete. By considerations, this concrete addition must be monolithic, i.e., the new and the old concrete must work together.
Clímaco [1[1] CLÍMACO, J. C. T., Repair of structural concrete involving the addition of new concrete, Ph.D. Thesis, Polytechnic of Central London, London, August, 1990, 239 p.] addresses several processes involving possible adhesion tests such as the direct tensile strength, according to which a special specimen is pulled off by the extremities until reaching the failure load; and the indirect tensile strength tests such as the one known as diametral compression, which was recommended by Prof. Lobo Carneiro. The direct tensile strength test results recorded for concrete cannot present lower values than the adhesion strength results recorded through the pull-off adhesion strength test.
The micro concrete fluid, also known as grout, is recommended for structural strengthening services due to its higher quality, as well as to the easy control of processes and materials. Strengthening using grout - which is a cement-based product - requires rough and saturated surfaces. Additives of any nature, accelerators, retarders, plasticizers or superplasticizers are relevant to the preparation of recovery materials. Active silica addition to concrete enhances the interface zone between slurry and aggregate; consequently, it improves adhesion, impermeability, axial compressive strength and the fresh concrete cohesion itself, thus avoiding exudation (Aitcin, [2[2] AÏTCIN, P. C., High-Performance Concrete. London, U. K., Editora E & FN SPON, 1st Edition, 1998, 591 p.]). The strengthening conducted on the upper surface of slabs requires the application of a high-performance concrete layer of varying thickness. The thickness variation gives a flat-convex lens shape to the reinforcing layer; therefore, the central area is thicker than the edges. Such variation is calculated based on span, reinforcement rate and demands.
The aim of the current study was to experimentally investigate and analyze the structural behavior of reinforced concrete slabs that were subjected to upper surface strengthening by testing real-scale molded pieces. The experiment focused on the efficiency of the strengthening process against the two most frequent slab pathologies, that are deficiencies in the reinforcement rate and in concrete compressive strength. It also investigated the adhesion between the old slab concrete and the concrete in the reinforcing layer (Campos [3[3] CAMPOS, C. O., Análise experimental de lajes de concreto armado reforçadas pela face superior. Dissertação (Mestrado em Engenharia Civil) - Escola de Engenharia Civil, Universidade Federal de Goiás, Goiânia, Setembro, 2000, 131 p.]).
2. Materials and experimental program
Five real-scale models (415 cm x 415 cm x 7 cm) were subjected to bending test in order to analyze the structural behavior of solid reinforced concrete slabs subjected to upper surface strengthening. The slabs, which were simply supported and evenly loaded on the upper surface, were reinforced in both directions and dimensioned according to NBR 6118/2014 [4[4] ASSOCIAÇÃO BRASILEIRA DE NORMAS TÉCNICAS NBR 6118 - Projeto de estruturas de concreto - Procedimento. Rio de Janeiro, 2014, 221 p.], by using the recommended overload for residential use (1.5 kN/m²). The main tested variables were reinforcement rate, ρ (0.076% and 0.164%) and concrete compressive strength, fc (10 MPa and 20 MPa).
Reference slab “L1” was tested until reaching the failure load in a single run. Slab L2 was built identical to L1, whereas slabs L3 and L4 were concreted and presented pathologies: the first showed reinforcement deficiency (L3, ρ = 0.076) and the second showed concrete strength deficiency (L4, fc = 10 MPa). An additional slab (L3a) was built to replace slab L3, which failed during the initial test. Slabs L2, L3, L3a and L4 were initially tested until reaching the loading-stop limit. The loading-stop limit, which is defined in order to set a condition characterized by intense cracking and large deflections, was based on three parameters: a) deformation in the main reinforcement reaching the yield point (10‰); b) crack opening according to the thresholds set by NBR 6118/2014 [4[4] ASSOCIAÇÃO BRASILEIRA DE NORMAS TÉCNICAS NBR 6118 - Projeto de estruturas de concreto - Procedimento. Rio de Janeiro, 2014, 221 p.]; c) vertical deflections according to the slab thickness magnitude order. Subsequently, the slabs, except for the failed L3, were unloaded, reinforced and tested until they reached the failure load.
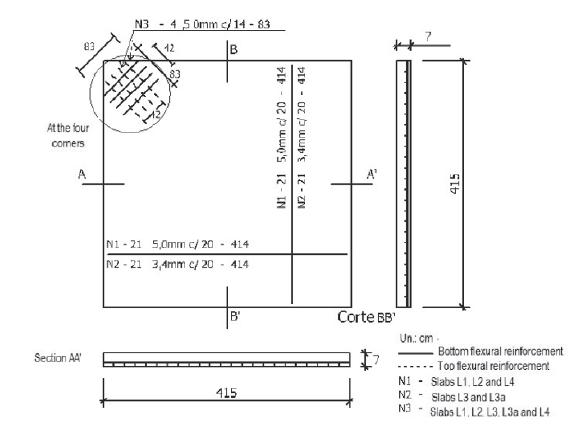
Strengthening lied on the application of a high-performance concrete layer, of varying thickness (2.0 cm in the edges and 4.0 cm in the center), on the upper surface of the slab. The concrete type used for strengthening and layer dimensions were kept constant in all reinforced slabs, which were renamed L2R, L3aR and L4R. Table 1 shows the test schedule and the main variables in the tested models, whereas Figure 1 presents the nominal dimensions and details of the reinforcement in the slabs.
The concrete used to manufacture slabs L1, L2, L3 and L3a was purchased from a pre-mixed concrete supplier, its 21-day compressive strength estimate was 20 MPa. The concrete used in slab L4, which had compressive strength estimate 10 MPa at the time the test was performed, was prepared in the Structures Laboratory - EEC / UFG and followed previously studied concrete ratios. Table 2 shows the concrete mix proportions used for slabs L1, L2, L3, L3a and L4. The concrete used to reinforce slabs L2R, L3aR and L4R was prepared at the slab concreting site, and followed previously studied concrete ratios. Ten cylindrical specimens (150 mm X 300 mm) were molded in all concrete pouring in order to characterize the material.
Mechanical analogical deflectometers were the instruments used in tests conducted to measure vertical deflections, whereas electrical resistance strain gages were used to measure steel and concrete deformations. A metal strip was positioned at the center of the slab (lower surface) in all tests, except for slab L1, in order to measure the approximate central deflection in the fracture after the mechanical deflectometers were removed. At least five Mitutoyo deflectometers, at precision 0.01 mm, were positioned on the lower surface of each slab. The deflections were measured in a single quadrant by positioning the devices on the central axis and in the diagonal of the slabs for symmetry purposes. Kiowa KLM PA 06 250BA 120L electric strain gages were also attached to the main flexural reinforcement, at 12 different points, of each slab. Two diametrically opposed strain gages per point were used in the lower and upper sides of the reinforcement in slabs L1 and L2. A single strain gage per point was used in the other slabs; it was fixed in the lower side of the reinforcement. Kiowa “KLM PA 06 201BA 120L” electrical strain gages were attached to four points on the concrete surface, and on the upper surface of all slabs, in order to measure the deformations. Figure 2 shows the position of the deflectometers and electrical strain gages fixed in the flexural reinforcement and on the concrete surface of the slabs.
Position of the deflectometers and electrical strain gages fixed in the flexural reinforcement and on the concrete surface of the slabs
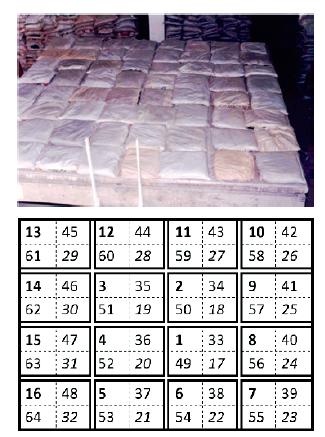
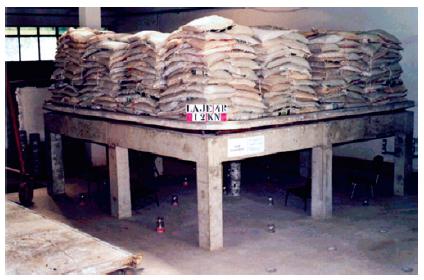
Slab L1 was loaded with 0.50 kN sandbags, whereas the other slabs were loaded with 0.25 kN bags. Each slab was initially divided in 16 squares measuring 1m2. Each loading stage occupied a quadrant of these squares. The bag placement sequence followed the previously established positioning instruction: bags placed from the center towards the edges, as shown Figure 3. The bags only touched each other inside each of the 16 squares in order to avoid the “bow effect”. Figure 4 shows the picture of the full load on slab L4R (after strengthening), with 12 layers and 4 stacks in each square did not touching the stacks in the neighboring squares.
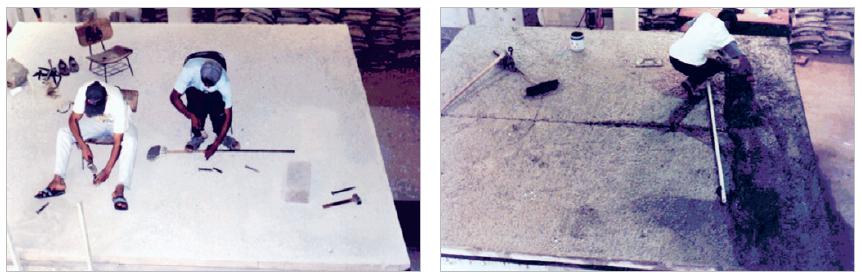
The strengthening was equally prepared for reinforced slabs L2R, L3aR and L4R. Firstly, a manual chipping was applied to their upper surface, with the aid of a pointer and a hammer, in order to create a rough surface without cement slurry. The chipped surface was washed with water by using a high-pressure pump to remove all loose powder and sand. A hydraulic jack was used to return the slabs to their original flat shape at the beginning of the tests. This operation was controlled through a stretched line fixed on the upper surface of the slab, in the center of the slab sides, and leveled through optical level (NA K1 - WILD). The strengthening procedure lied on applying a high-performance concrete layer, of varying thickness (2.0 cm in the edges and 4.0 cm in the center), to the upper surface of the slab. Figure 5 shows pictures of The manual chipping on the upper surface and the spreading of the strengthen layer.
The same high-performance concrete was used to strenght the three slabs. Right after the application and finishing of the reinforcing layer, when the concrete was still fresh, the slab was covered with wet burlap sacks, protected with polyethylene tarpaulin and kept under these conditions for 7 days, for curing purposes. Table 3 shows the concrete ratio used for strengthening.
Pull-off tests were carried out in some points of the reinforcing layer applied to the slabs, as well as in reference pieces, in order to assess adhesion strength between the reinforcing layer and the old concrete in the slab. A pair of reference pieces (50 cm x 50 cm x 7 cm) was molded for slabs L3aR and L4R. One piece of each pair just had the slab concrete, whereas the other piece also had a reinforcing layer. The same concrete, strengthening and techniques applied to the slabs were used in both pieces. These pieces were made for reference purposes, and they were not influenced by the deflections and cracks resulting from the loads applied to the slabs. Thirty-six (36) tests were performed in the strengthening of slab L2R , 28 tests were carried out in slab L3aR, and 23 were conducted in the strengthening of slab L4R, in randomly selected undamaged points. The reference pieces were subjected to 29 tests. The test procedure consisted in using a “hole saw” with diamond crown under water circulation to make a circle (50 mm internal diameter and depth of approximately 30 mm) below the reinforcing layer. Table 4 summarizes the number of pull-off tests performed in the current study.
A metal pull head plate was glued onto the specimens after they were cleaned and dried in order to distribute the applied tension. The tests were performed after the glue got hard - overall, one day after the metallic plate was glued. The pulling force was applied by using a mechanical analogical device; the force was increased by activating a crank using a fine-threaded screw, which compressed the double dynamometric ring. In turn, the ring reacted on the metallic plate glued to the strenghted layer (Figure 6). The mean test duration was 5 minutes.
3. Results and discussion
Table 5 shows the concrete cylindrical compression strength after 7 days of the pouring concrete and on the slab test day, as well as the modulus of elasticity of the concrete at the day the test was applied to the slabs. At least two flexural reinforcement samples per slab were subjected to axial traction in order to find the yield and breaking strengths, the modulus of elasticity and the specific deformation according to NBR 6892-1 / 2013 [5[5] ASSOCIAÇÃO BRASILEIRA DE NORMAS TÉCNICAS NBR 6892-1- Materiais metálicos - Ensaio de Tração Parte 1: Método de ensaio à temperatura ambiente. Rio de Janeiro, 2013, 70 p.]. The bars did not show defined yield strength in all tests. Table 6 shows the main steel characterization results.
Reference slab L1 failed when it was subjected to load 9.25 kN/m2. The remaining slabs, except for L3, were tested until the stop load was reached in the first test. Slabs L2 (fc = 20.8 MPa) and L4 (fc = 12.4 MPa), which presented 0.164% reinforcement rate, showed stop loads 6.50 kN/m2 and 4.75 kN/m2, respectively. Slab L3 was loaded up to 3.0 kN/m2 in order to cause maximum deterioration, then it failed, since a stop load ranging from 2.75 to 3.25 kN/m2 was predicted. Slab L3 results were kept for comparison purposes. Slab L3a was made to replace slab L3. The stop load for slab L3a was 2.25kN/m². Since the strengthening presented varying thickness along the slab, the effective height taken into consideration in the current study was measured in the region of maximum bending moment, in the center of the slabs. The failure loads of slabs L2R and L4R were very close to each other; 12.25 kN/m2 and 12.0 kN/m2, respectively. Slab L3aR, which had low reinforcement rate, failed at 3.25 kN/m2.
Table 7 summarizes and compare the main features and failure loads in slabs L1, L3, L2R, L3aR and L4R. Slabs L1 and L3 (without strengthening), as well as slabs L2R, L3aR and L4R (reinforced), failed under bending and showed large vertical deflections and high reinforcement yield on the lower surface, mainly in the central region. In addition to yield, the central bars failed in all tests. There was no evidence of crushing on the upper concrete surface after the tests were finished and the load was removed.
Reinforced slabs L2R and L4R showed higher failure loads (32% and 30%, respectively), whereas the failure loads of slabs L3 and L3aR were significantly lower than that of reference slab L1. The concrete compressive strength of slab L3 was similar to that of slab L1. However, its useful height and reinforcement rate were 14% and 50% lower than that of slab L1, respectively. Thus, slab L3 failed under bending when it was subjected to a load 68% lower than that applied to reference slab L1.
It was possible seeing reduced geometric reinforcement rate (from 0.14% in L1 to 0.09% and 0.10% in L2R and L4R, respectively), increased concrete strength (from 20.8 MPa in L1 to 51.9 MPa and 56.4 MPa in L2R and L4R, respectively) and, mainly, increased useful height (from 7.2 cm in L1 to 10.2 cm and 10.0 cm in L2R and L4R, respectively) by comparing slabs L2R and L4R to reference slab L1. The increased useful height, in this particular case, played a significant role in the respective 32% and 30% increase recorded for the failure loads of slabs L2R and L4R, when they were compared to slab L1.
Slab L3aR showed useful height 48% higher, concrete compressive strength in the reinforcing layer 2.8 times higher and geometric reinforcement rate lower than slab L1. Slab L3aR failed when it was subjected to 35% of the failure load applied to slab L1, regardless of reinforcing concrete layer application. This result shows that increasing the useful height and the concrete compressive strength of the reinforcing layer, without using the minimum flexural reinforcement rate, leads to an innocuous strengthening.
The comparison between reinforced slabs L2R and L4R reaffirmed useful height (d) as the most important parameter to set the ultimate load of reinforced slabs presenting similar reinforcement rates (0.09% and 0.10% respectively). Although slab L4, which was the basis of slab L4R, was made of low-strength concrete (fc = 12.4 MPa) - approximately 60% lower than that of slab L2 (20.7 MPa) -, its behavior at failure load was very similar to that of L2: ultimate load 12.25 kN/m² in slab L2R and 12.0 kN/m² in slab L4R. It showed little or no influence from the pulled-zone concrete on the failure load capacity of the reinforced slab. It is worth highlighting that slabs L2 and L4 showed distinct behavior until reaching the stop load in the initial test.
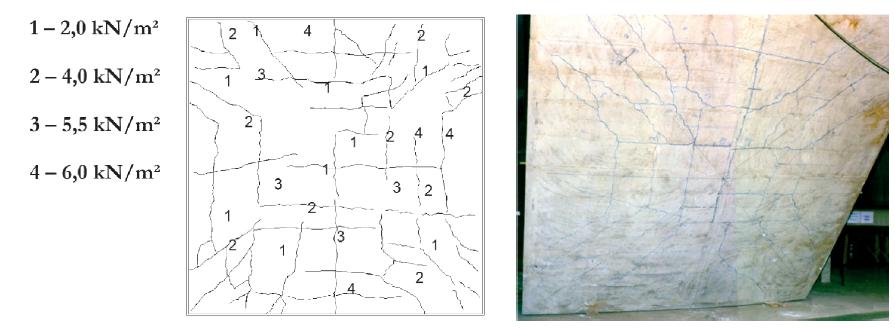
The first cracks visually observed in slabs L1 and L2 happened under loads 2.50 kN/m2 and 2.25 kN/m2, respectively. The first cracks were observed in slabs L3, L3a (with low reinforcement rate) and L4 (with low concrete compressive strength) when they were subjected to loads 1.25 kN/m2 (L3) and 1.0 kN/m2 (L3a and L4). The first cracks appeared in the central region towards the edges. Four (4) areas with failure lines passing through the center towards the edges were clearly defined in advanced loading stages. Figure 7 shows the slab L1 cracking scheme and a picture of the crack on the lower surface of slab L2R.
Figure 8 shows the graph of load x central deflection in all slabs. All the slabs showed increased deflections due to increased load. Slab L1 (effective height 7.1 cm) showed the largest central deflection among all slabs; it reached 12.5 cm for the failure load 9.25 kN/m². The central deflection values of non-reinforced slabs ranged from 6.5 cm (L3a, d = 6.0 cm) to 7.5 cm (L2, d = 6.3 cm), at stop loads 2.25 kN/m2 and 6.50 kN/m2, respectively, except for slab L3. Slab L3, which failed at 3.0 kN/m², showed 6.4 cm central deflection at load 2.75 kN/m². Reinforced slabs L2R (d = 10.3 cm) and L4R (d = 10.0 cm) failed at 11.0 cm and 9.5 cm vertical deflections, respectively, whereas slab L3aR (d = 10.5 cm) failed at 6.9 cm deflection. It was possible seeing that the slabs showing reinforcement deficiency (L3 and L3a) and the reinforced slab (L3aR) presented the largest deflections at the lowest loads. A second group, which comprised slabs L1, L2 (without strengthening and concrete deficiencies) and L4 (with concrete deficiency), showed deflections in the same order of magnitude, and with intermediate values, when they were compared to other slabs subjected to the same loads. The third group comprised reinforced slabs L2R and L4R, which showed similar behavior and presented the smallest deflections at loads higher than 2.0 kN/m². These smallest deflections took place due to the increased useful height deriving from concrete reinforcing layer application. Slab L3aR, which also received reinforcing layer similar to that of L2R and L4R, did not present the same deflection profile, probably because it was manufactured with flexural reinforcement deficiency.
Table 8 presents the central deflection results of all slabs at loads 1.5 kN/m², 3.0 kN/m², as well as the stop load (varying in each slab) and the load in the last reading before breaking. Slabs L1 and L2 (with reinforcement rates complying with the standard) met the NBR 6118/2014 [4[4] ASSOCIAÇÃO BRASILEIRA DE NORMAS TÉCNICAS NBR 6118 - Projeto de estruturas de concreto - Procedimento. Rio de Janeiro, 2014, 221 p.] requirements for maximum permissible vertical deflections. Slabs L3, L3a (with reinforcement deficiency) and L4 (with concrete strength deficiency) reached deflections that exceeded the standard limit (l/500 = 8.0 mm) at load 1.5 kN/m² (of design). Reinforced slabs L2R, L3aR and L4R showed 40%, 32% and 53% lower deflections, respectively, when they were subjected to the same stop load applied to the respective non-reinforced slabs. Such outcome evidences the strengthening efficiency in relation to the central vertical deflection.
By comparing slabs L1, L3 and L3a, which showed similar concrete strength values and useful height, it was possible seeing that slab L1 (with reinforcement rate 0.14%) showed just 3.2 mm deflection at 1.5 kN/m². This value was lower than half of the limit value imposed by the standard (NBR 6118/2014 [4[4] ASSOCIAÇÃO BRASILEIRA DE NORMAS TÉCNICAS NBR 6118 - Projeto de estruturas de concreto - Procedimento. Rio de Janeiro, 2014, 221 p.]). On the other hand, slabs L3 and L3a (which were composed of 50% of the reinforcement in slab L1) showed vertical deflections 8 to 14 times higher than that of L1.
The reinforcing concrete layer in Slab L3aR led to a new useful height (d = 10.5 cm) and to higher concrete strength in the compressed region (fc = 58.2 MPa). However, the lower geometric rate in this slab led to deflection values in the same order of magnitude of slabs L3 and L3a, fact that shows the importance of setting a minimum reinforcement rate to control vertical deflection, regardless of the strengthening.
The comparison between central deflections in slabs L1 (fc = 20.8 MPa) and L4 (fc = 12.4 MPa) showed the influence of concrete compressive strength on the central vertical deflection behavior. The 60% reduction in the concrete compressive strength led to deflections 4.3 times greater at load 1.5kN/m² and 18% greater at load 3 kN/m², thus indicating the early emergence of cracks in less resistant slabs.
Although slab L4R showed vertical deflection greater than that of slab L1, and smaller than that of slab L4 at load 1.5 kN/m2, it showed considerably smaller deflections than that of the same slabs at heavier loads. It evidences that the increased useful height resulting from the reinforcing layer helps overcoming losses deriving from the influence of concrete compressive strength in advanced loading stages.
The reinforced slabs increased the load limit in relation to the ultimate load; however, this fact did not change the vertical deflection in the initial loads, probably due to the steel cracking and deformation state resulting from the initial test.
Steel deformation measurements made through electrical strain gages attached to the strengthening are presented for each tested slab, except for the reinforced slabs, since the strain gages were requested in the initial test and many of them failed during loading until the test stopped. Two strain gages per point were used in slabs L1 and L2, one on the upper surface and the other one on the lower surface of the instrumented bar. The other slabs - L3, L3a and L4 - were instrumented with a single strain gage per point. Figures 9 and 10 show graphs representing load-versus-deformation in the reinforcement of slabs L1, L2, L3, L3a and L4 until reaching the failure (L1 and L3) or the stop load (L2, L3a and L4) points. The central strain gages showed deformations equivalent to the yield of bars in slab L3.
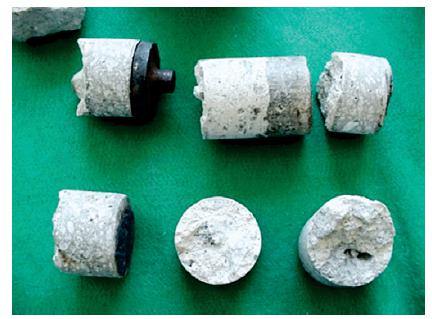
The adhesion between the old and the new strengthening concrete was assessed through pull-off test, wherein steel wafers (50 mm diameter circular cutouts) were glued to the strengthening surface. A total of 87 pull-off tests were carried out to check the reinforcing concrete adhesion to the old concrete. In addition, 29 tests were conducted in reference pieces. The results of the pull-off tests regarding the failure spot in the cutout specimen were presented in four different ways: a) failure at the old concrete-new concrete interface - OC/NC; b) failure in the old concrete of the slab - OC; c) failure in the new strengthening concrete - NC and; d) failure in the glue, between the concrete and wafer - GLUE. The failure in the old concrete-new concrete interface - OC/NC - rarely takes place integrally in the plane of the interface between concretes. In most cases, the failure partly involved the surface of the old-new concrete interface; as for the remaining cases, the failure involved the old concrete surface. None of the herein performed tests showed failure surface concomitantly involving part of the old-new concrete interface and the new concrete surface. Figure 11 shows a picture of the failed specimens and indicates the failure modes.
Results of reference pieces showed 5% variation in the reinforced pieces and 2% variation in the non-reinforced ones. However, the adhesion strength values showed differences of almost three times between the tested slabs. Table 9 shows the mean pull-off force values and the respective standard deviations (Sd) of the tests, the failure mechanism in each of the three reinforced slabs - L2R, L3aR and L4R -, as well as the results of the reference pieces. The general calculation of the means did not take into consideration the three points in the wafer glue where the failures occurred during the tests conducted in slab L2R. All reference specimens without reinforcing layer in slabs L3aR and L4R failed in the old concrete at mean values 1.13 MPa and 1.15 MPa, respectively. The mean adhesion strength in the other two reference pieces (with reinforcing layer) were 1.02 MPa and 1.07 MPa, respectively; there was predominant failure in the new-old concrete interface. The pull-off stress ranged from 0.49 MPa to 1.08 MPa in the tests conducted in slab L2R, from 0.36 MPa to 1.07 MPa in the tests conducted in slab L3aR, and from 0.43 MPa at 1.03 MPa in the tests conducted in slab L4R. Although slab results indicated broader limits, there was significant concentration of values in the range between 1.0 MPa and 1.1 MPa (Figure 12).
The values of pull-off tests conducted in the reinforced slabs may be justified by the bending cracks that took place on the lower surface of the slab during the initial tests until the stop load was reached, as well as by failures in the final tests. These cracks may have reached the old concrete, as well as the reinforcing concrete layer, through specimen cutout. Another factor that may have influenced the adhesion test results was the possible existence of small “holes” between the new concrete layer used as strengthening and the old concrete in the slab. Adhesion strength results (from 1.0 MPa to 1.10 MPa) found in the tests performed in the reinforced slabs (Figure 12) indicated adhesion strength compatible with the results of the pull-off tests conducted in the reference specimens (from 1.02 MPa to 1.15 MPa) (Table 9) when the possible influence of the damages caused to the slabs, after the failure load was applied (bending cracks, holes, etc.), was taken into account. It is worth emphasizing that the adhesion tests were conducted in slabs that failed after being subjected to loads up to eight times higher and to vertical deflections up to nine times higher than the design load and vertical deflection limit.
Figures 13a and 13b show the schematic drawing of the specimen cutout, which reached the bending cracks in the slab, as well as the picture of a demolished section in slab L4R focused on the presence of “holes”, respectively. It is worth highlighting that these “holes” were not found in most of the demolished slab sections. There was no visual sign of debonding in the new reinforcing concrete layer during the tests. It was possible seeing perfect adhesion between the old and the new concretes in most of the demolished slab sections (Figure 13c).
Schematic drawing of the specimen cutout (a), Picture of a demolished section in slab L4R (b) Picture of the perfect adherence between the strenghted concrete and the old concrete (c)
4. Conclusions
With respect to slabs originally reinforced at minimum reinforcement rate according to NBR 6118/2014 [4[4] ASSOCIAÇÃO BRASILEIRA DE NORMAS TÉCNICAS NBR 6118 - Projeto de estruturas de concreto - Procedimento. Rio de Janeiro, 2014, 221 p.], reinforcing layer application increased the ultimate failure load by up to 30% in comparison to similar non-reinforced slabs (L2R and L4R). Although the strengthening increased the ultimate failure load in slabs showing insufficient reinforcement rate (50% of the minimum rate required by the standard), it did not show the same efficiency level shown by L2R and L4R, because it was obviously limited by the amount of reinforcement (slab L3a). This effectiveness limit presented by the strengthening applied to the upper surface of the slab was caused by the amount of reinforcement; this limitation may evidence slab strengthening feasibility (or not) through the herein addressed process. All the tested slabs, whether they were reinforced or not, showed great ductility until the failure point, as well as deflections greater than the useful height; however, they failed when the reinforcement in the central region failed.
When slabs showing the minimum strengthening required by the standard were reinforced, they showed smaller vertical deflections at loads above the design loads or above the loads that caused the emergence of the first crack. However, even when the slabs showing reinforcement deficiency were reinforced, they always showed great deflections. Slabs L1 and L2, whose reinforcement rates complied with the standard, met the NBR 6118/2014 requirements for limit deflections. Slabs L3, L3a (with reinforcement deficiency) and L4 (with concrete strength deficiency) reached vertical deflections higher than the limit set by the standard l/500 (8.0 mm), when they were subjected to 1.5 kN/m² (design load). The reinforced slabs L2R, L3aR and L4R showed vertical deflections at least 30% lower when they were subjected to the same load applied to the respective non-reinforced slabs, fact that confirmed the strengthening efficiency linked to the central vertical deflection.
The different adhesion strength measurements made between the reinforcing concrete layer and the base concrete in the slab indicated strain in the order of 1.0 MPa. It was not possible setting the minimum adhesion. The effort made to produce good adhesion aimed at developing a monolithic strengthening in the old concrete of the base slab. None of the tests conducted in the reinforced slabs showed generalized detachment of the reinforcing layer. Even the fragments from the demolished slab showed perfect adherence between the old and the new concrete.
5. Acknowledgement
The author is grateful to Realmix, to IMPERCIA S.A and to Carlos Campos Consultoria Ltd. for making available some of the materials used in the current study and for helping in the concrete characterization tests, as well as to CNPq and Procad/Capes for the institutional support.
6. References
-
[1]CLÍMACO, J. C. T., Repair of structural concrete involving the addition of new concrete, Ph.D. Thesis, Polytechnic of Central London, London, August, 1990, 239 p.
-
[2]AÏTCIN, P. C., High-Performance Concrete. London, U. K., Editora E & FN SPON, 1st Edition, 1998, 591 p.
-
[3]CAMPOS, C. O., Análise experimental de lajes de concreto armado reforçadas pela face superior. Dissertação (Mestrado em Engenharia Civil) - Escola de Engenharia Civil, Universidade Federal de Goiás, Goiânia, Setembro, 2000, 131 p.
-
[4]ASSOCIAÇÃO BRASILEIRA DE NORMAS TÉCNICAS NBR 6118 - Projeto de estruturas de concreto - Procedimento. Rio de Janeiro, 2014, 221 p.
-
[5]ASSOCIAÇÃO BRASILEIRA DE NORMAS TÉCNICAS NBR 6892-1- Materiais metálicos - Ensaio de Tração Parte 1: Método de ensaio à temperatura ambiente. Rio de Janeiro, 2013, 70 p.
Publication Dates
-
Publication in this collection
Apr 2018
History
-
Received
05 Feb 2016 -
Accepted
20 June 2017