Abstract
Masonry is a construction system that has been used since the beginning of civilization and is still used throughout the world. The finite element method is a recent development that allows complex problems, including structural masonry problems, to be solved. A vast amount of literature exists on finite element modeling, using software such as ABAQUS, to represent experimental masonry models. Based on this established pattern, an experimental and analytical research program was designed and implemented. Thus, a set of tests was conducted to determine the compressive and tensile strengths of the masonry components, i.e., block, mortar, and grout. Bond wrench tests, diagonal tension tests, and horizontal joint shear tests were conducted to characterize the interface between the blocks and the mortar. A finite element model was then developed to represent the physical models and the general conclusion is that the finite element model was able to represent reasonably well the physical models.
Keywords:
masonry; concrete block; mortar; finite element analysis; block-mortar interface
Resumo
A alvenaria é um sistema construtivo que tem sido usado desde o início da civilização e ainda é usado em todo o mundo. O método dos elementos finitos é um desenvolvimento recente que permite resolver problemas complexos, incluindo problemas de alvenaria estrutural. Existe uma vasta quantidade de literatura sobre modelagem de elementos finitos, usando software como o ABAQUS, para representar modelos experimentais de alvenaria. Com base nesse padrão estabelecido, um programa de pesquisa experimental e analítica foi projetado e implementado. Assim, um conjunto de testes foi realizado para determinar as forças de compressão e tração dos componentes de alvenaria, isto é, bloco, argamassa e graute. Foram realizados ensaios tipo bond wrench, de tração diagonal e cisalhamento de juntas horizontais para caracterizar a interface entre os blocos e a argamassa. Um modelo de elementos finitos foi desenvolvido para representar os modelos físicos e a conclusão geral é que o modelo de elementos finitos foi capaz de representar razoavelmente bem os modelos físicos.
Palavras-chave:
alvenaria; bloco de concreto; análise em elementos finitos; interface de bloco-argamassa
1. Introduction
A substantial volume of knowledge has been established with respect to individual masonry components (units, mortars and grouts) as well as the interaction between these components. For example, Barbosa (2005[14] Barbosa, K. C. (2005). Avaliação Experimental do Fenômeno de Retração em Alvenaria de Blocos de Concreto. Dissertação (Mestrado). Programa de Pós-Graduação em Estruturas e Construção Civil - Universidade Federal de São Carlos (UFSCar) - SP. 252p.) investigated the shrinkage of concrete masonry units and of masonry walls constructed from those units; Santos (2014[44] Santos, E. A. F. (2014). Estudo da influência das propriedades elásticas da interface bloco-argamassa na rigidez de paredes de alvenaria. Dissertação (Mestrado)- Escola de Engenharia de São Carlos, Universidade de São Paulo, São Carlos. 277p.) examined the effects of the elastic properties of the block-grout interface on the stiffness of masonry walls; Izquierdo (2015[25] Izquierdo, O. S. (2015). Estudo da interface bloco/graute em elementos de alvenaria estrutural. Tese (Doutorado) - Escola de Engenharia de São Carlos, Universidade de São Paulo, São Carlos. 290p.) studied the interface between block and grout under direct compression and flexural compression; Barbosa (2000) and Madia (2012[34] Madia, F. C. A. R. (2012). Estudo de Pórticos Preenchidos com Alvenaria. Dissertação (Mestrado). Programa de Pós-Graduação em Estruturas e Construção Civil - Universidade Federal de São Carlos (UFSCar) - SP. 146p.) studied the behavior and interaction of infill masonry walls and the surrounding concrete elements; Capuzzo Neto (2000[20] Capuzzo Neto, V. (2000). Estudo teórico e experimental da interação de paredes de alvenaria estrutural submetidas a ações verticais. Dissertação (Mestrado) - Escola de Engenharia de São Carlos, Universidade de São Paulo, São Carlos, 111p.), Maluf (2007) and Lopes (2014) investigated the behavior of masonry walls under compressive loadings; and Silva (2014[46] Silva, W. J. (2014). Análise experimental e numérica da distribuição das ações verticais entre paredes de alvenaria estrutural com a utilização de modelo físico reduzido na escala 1:5. Tese de Doutorado - Departamento de Estruturas, Escola de Engenharia de São Carlos, Universidade de São Paulo, São Carlos - SP. 331 p.) determined the distribution of vertical loads on masonry walls using experimental and numerical models. Studies have also been conducted on the behavior of masonry structural elements. Examples include Landini (2001[29] Landini, F. S. (2001). Comportamento à flexão e ao esforço cortante de vigas em alvenaria estrutural. 2001. Dissertação (Mestrado). Faculdade Engenharia Civil - Universidade Estadual de Campinas (UNICAMP) - SP. 135p.) and Contadini (2014[21] Contadini, L. F. (2014). Análise teórica e experimental do comportamento de vigas de alvenaria estrutural armada sujeitas à flexão simples. Dissertação (Mestrado) - Departamento de Engenharia Civil - Universidade Estadual Júlio de Mesquita Filho (UNESP) - SP. 151p.) where the behavior of masonry beams under flexural loads was studied, while Landini (2001) and Pasquantonio (2015[40] Pasquantonio, R. D. (2015). Análise teórica e experimental de vigas de alvenaria estrutural sujeitas ao cisalhamento. Dissertação (Mestrado). Programa de Pós-Graduação em Estruturas e Construção Civil - Universidade Federal de São Carlos (UFSCar) - SP. 179p.) studied the behavior of masonry beams under shear loads.
Masonry has been used in the construction of tall buildings and in this application, masonry elements are subjected to high compressive stresses. Fortes (2017[23] Fortes, E. S. (2017). Caracterização da alvenaria estrutural de alta resistência. Tese (doutorado). Pós-Graduação em Estruturas e Construção Civil (UFSCar). 350p.) determined the properties of masonry constructed with high strength units, which can be used when masonry is subjected to high compressive stresses. While there is a large body of literature on experimental research on structural masonry components and elements, there is a distinct lack of research and thus understanding, on the interaction between masonry elements, e.g., a masonry beam connected to a masonry wall.
The increase in computational capability over the last forty years has led to a large base of numerical modeling of masonry structural elements together with increasing sophistication in the modeling. To capture the capacity and behavior of masonry accurately, these sophisticated models require many material parameters, which are extracted from experimental research endeavors. Due to a lack of standardization in testing, differences in the manufacture of local masonry components from local materials, and differences in local construction techniques and skills, there is a large dispersion worldwide in the values of the material parameters of interest for numerical modelling. This is especially true for the parameters that control the behavior of the interface between blocks and mortar in concrete masonry and the parameters that control the post-peak behavior.
Herein we present a summary of three tests, namely, the bond wrench, diagonal tension, and horizontal joint shear as conducted on masonry constructed with half-scale (1:2) concrete blocks with dimension of 203 × 102 × 102 (length × width × height) mm and type S mortar (1:0.5:4.5 PC:Lime:sand by volume); some masonry specimens were hollow while others were grouted. In addition to the results of these masonry tests, results of tests conducted to the determine the compressive strength of the masonry materials are also presented.
Results from the tests are used to extract the parameters that are required for accurate numerical modeling of masonry elements and structures constructed from these materials. In addition to the results obtained from the tests described herein, the results obtained by other authors, who conducted similar tests, are also presented.
2. Tests to characterize the masonry and materials
In this section, the three tests that were conducted as part of this research to characterize the behavior and capacity of the block-mortar interface are described. The difficulty in representing the masonry behavior accurately lies in representing properly the block-mortar interface (Oliveira 2014[39] Oliveira, L. M. F. (2014). Estudo Teórico E Experimental Do Comportamento Das Interfaces Verticais De Paredes Interconectadas De Alvenaria Estrutural. Tese de Doutorado - Departamento de Estruturas, Escola de Engenharia de São Carlos, Universidade de São Paulo, São Carlos - SP. 272 p., Bolhassani 2015[18] Bolhassani, M., Hamid, A. A., Lau, A. C. W., Moon, F. (2015). Simplified micro modeling of partially grouted masonry assemblages. Construction and Building Materials. v83. p159-173., Santos 2016[43] Santos, C. F. R. (2016). Avaliação numérica da interação de paredes de alvenaria estrutural submetidas às ações verticais. Viçosa. Dissertação (Mestrado) - Universidade Federal de Viçosa. 213p.).
The tests that were conducted to determine the compressive strengths of the masonry materials are also described.
2.1 Flexural strength test (bond wrench test) - AS 3700 (2001)
The objective of this test is to determine the flexural tensile strength of the mortar-block interface. The tests are performed on stack-bonded prisms of masonry constructed as follows:
-
Set the first block on a firm, clean, flat surface.
-
Place a mortar bed on the face of the block. Use full bedding for solid or cored units and face-shell bedding for hollow units.
-
Wait 30 sec. before placing the next block on the mortar.
-
Repeat steps 2 and 3.
-
Strike off excess mortar with a trowel without disturbing the blocks.
In cases where grouted prisms are used, the following extra requirements must be observed:
-
Clean out the cores so that no mortar extrusions remain on the internal surfaces and the cores are free of mortar droppings.
-
Fill the cores with grout and compact in layers during filling by rodding, finishing to a height 25 mm above the top surface of the prism.
-
One hour after filling, strike the surplus grout off level with the top surface.
After construction, the prisms are to be fully wrapped in a single vapor-proof sheet and left undisturbed until transported for testing. Testing of the prisms is conducted 7 days after construction or as soon as practicable after 7 days: grouted prisms are tested 28 days after filling the cores. Specimens are be transported to the testing location no more than 24 hours before the testing time.
The testing apparatus or wrench, must be able to do the following:
-
Apply a bending moment to the joint to be tested in the prism;
-
Have a retaining frame into which the prism is clamped;
-
Have the means of applying and measuring the load to determine the flexural stress at failure to an accuracy of within 0.01 MPa.
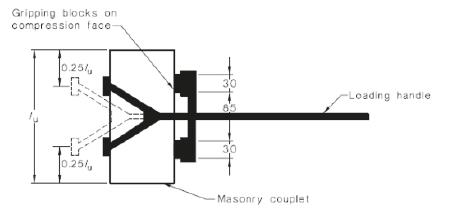
Sketches of a typical bond wrench apparatus are shown in Figures 1 and 2. The flexural moment is applied to the test joint by means of four gripping points at the quarter points along the length of the masonry unit on both the tension and compression faces. The wrench must have the following parameters calibrated:
-
The mass of the wrench (m1) to within ±25 g;
-
The distance from the inside face of the tension gripping block to the center of mass of the bond wrench, d1, to within ±2 mm;
-
The distance from the inside face to the tension gripping block to the loading handle (d2) to within ±2 mm.
The tensile strength of the specimen is calculated using Equation 1.
Where:
fsp - Flexural tensile strength of the specimen, MPa;
Msp - Bending moment about the centroid of the bedded the area of the test joint at failure, N∙mm. This bending moment is calculated as Msp = 9.81 * m2 * (d2 - (tu ⁄ 2)) + 9.81 * m1 * (d1 - (tu ⁄ 2));
Zd - Section modulus of the cross-sectional area Ad of the member;
Fsp - Total compressive force on the bedded area of the test joint, N. This compressive force is calculated as Fsp = 9.81 * (m1+ m2 + m3);
Ad - Cross-sectional area of the member, mm2;
m1, m2 and m3 - The mass of the wrench, the mass equivalent of the applied load and the mass of the block above the joint being tested, used in the flexural strength calculation, kg;
d1 - Distance from the inside edge of the tension gripping block to the center of mass, mm;
d2 - Distance from the inside edge of the tension gripping block to the loading handle, mm;
tu - Width of the masonry unit, mm.
2.2 Initial shear strength test - BS EN 1052-3 (2002)
Several authors (Araújo 2002[10] Araújo, A. F. (2002). Metodologia para Avaliação da Resistência de Aderência ao Cisalhamento de Prismas para Alvenaria Estrutural. Dissertação (Mestrado). Programa de Pós-Graduação em Engenharia de Estruturas, Universidade Federal de Minas Gerais (UFMG), Belo Horizonte. 149p., Oliveira 2014[39] Oliveira, L. M. F. (2014). Estudo Teórico E Experimental Do Comportamento Das Interfaces Verticais De Paredes Interconectadas De Alvenaria Estrutural. Tese de Doutorado - Departamento de Estruturas, Escola de Engenharia de São Carlos, Universidade de São Paulo, São Carlos - SP. 272 p., Drysdale et al. 1999[22] Drysdale, R. G., Hamid, A. A., and Baker,L.R., (1999). Masonry Structures Behavior and Design. Prentice Hall, New Jersey., Vermeltfoort 2012[49] Vermeltfoort, A. T. (2012). Shear Strength Variation due to Mortar Strength Variation and the use of a Triplet Shear Test Set-Up. 15th International Brick and Block Masonry Conference. Florianopolis.) have used the methodology presented in BS EN 1052-3 (2002) to determine the initial shear strength of mortar joints. The work presented herein follows this established pattern.
The initial shear strength of masonry is determined from the strength of small masonry specimens tested to failure. The specimens are tested in shear under four-point loading, with possible precompression perpendicular to the bed joints as shown in Figure 3.
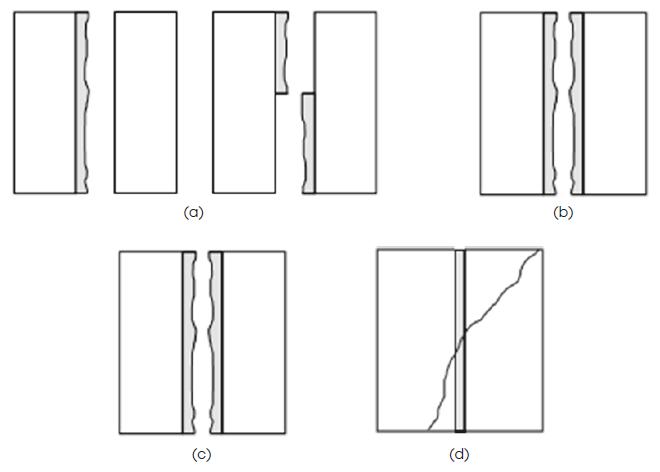
Four different failure modes, shown schematically in Figure 4, are considered to give valid results to the test:
-
Rupture 1 (R1) - Figure 4.a. Debonding - occurs due to failure of the adhesion between one of the units and the mortar or the splitting of the mortar into two parts. In both cases there is complete or partial detachment of the mortar from the unit;
-
Rupture 2 (R2) - Figure 4.b. Debonding with mortar rupture - there is debonding of the mortar from both units together with failure of the mortar itself;
-
Rupture 3 (R3) - Figure 4.c. Unit failure - is due to failure of a unit in the direction parallel to the applied load and fragments of the unit remain attached to the mortar;
-
Rupture (R4) - Figure 4.d. Diagonal fracture - is due to diagonal cracking of the units.
The initial shear strength of the joint is obtained by linear regression of the stress-strain response to zero normal stress.
The testing machine must be able to apply the load while the specimen is subject to a pre-compression load. Two types of specimens can be used: type A consists of a prism assembled with three blocks with equal heights that are less than or equal to 200 mm and type B consists of a prism assembled with two blocks with unequal heights that are greater than 200 mm. Research (Araújo 2002[10] Araújo, A. F. (2002). Metodologia para Avaliação da Resistência de Aderência ao Cisalhamento de Prismas para Alvenaria Estrutural. Dissertação (Mestrado). Programa de Pós-Graduação em Engenharia de Estruturas, Universidade Federal de Minas Gerais (UFMG), Belo Horizonte. 149p., Oliveira 2014[39] Oliveira, L. M. F. (2014). Estudo Teórico E Experimental Do Comportamento Das Interfaces Verticais De Paredes Interconectadas De Alvenaria Estrutural. Tese de Doutorado - Departamento de Estruturas, Escola de Engenharia de São Carlos, Universidade de São Paulo, São Carlos - SP. 272 p., Drysdale et al. 1999[22] Drysdale, R. G., Hamid, A. A., and Baker,L.R., (1999). Masonry Structures Behavior and Design. Prentice Hall, New Jersey., Vermeltfoort 2012[49] Vermeltfoort, A. T. (2012). Shear Strength Variation due to Mortar Strength Variation and the use of a Triplet Shear Test Set-Up. 15th International Brick and Block Masonry Conference. Florianopolis.) indicates that type A specimens are preferred.
Specimens must be constructed as follows:
-
Set the first block on a firm, clean, flat, level surface;
-
Place a mortar bed on the face of the block with a final mortar joint thickness between 8 and 15 mm. In the research presented herein, the mortar thickness was 10 mm;
-
Place the next block on the mortar joint checking for linear alignment and level;
-
Repeat steps 2 and 3;
-
Strike off excess mortar with a trowel without disturbing the blocks;
-
Take samples (cubes) of the mortar.
Immediately after assembling a specimen, pre-compress the specimen with a uniformly distributed mass to give a vertical stress between 2.0 × 10⁻³ N/mm2 and 5.0 × 10⁻³ N/mm2. Then cure the specimens and maintain them undisturbed until testing. When lime-based mortar is used, specimens should be covered with a polyethylene sheet to prevent the mortar from drying out during the curing period. Specimens are to be tested, as shown schematically in Figure 3, when they reach an age of 28 days ± 1 day, unless otherwise specified when lime-based mortar is used. The compressive strength of the mortar is to be determined at the same time as the prisms are tested.
The standard specifies three precompression stresses and for each, a minimum of three specimens must be tested. Precompression stresses (f pi ) are determined based on the compressive strength of the units used. For units with compressive strength less than 10 MPa, precompression stresses should be approximately 0.1, 0.3, and 0.5 MPa. For units with compressive strength greater than 10 MPa, precompression stresses should be doubled.
The rate at which shear stress should be applied to the specimens is between 0.1 (N/mm2)/min and 0.4 (N/mm2)/min.
The following parameters must be recorded during a test:
-
The cross-sectional area of the specimen parallel to the shear force (Ai) with an accuracy of 1%;
-
The maximum applied load (F i,max );
-
The precompression load;
-
The type of failure. If a specimen experiences rupture type R4, the standard recommends that further specimens be tested until three shear rupture of the other types are obtained.
For each specimen and precompression stress, the shear strength (f voi ) is calculated using Equation 2.
Shear strengths (f voi ) are plotted as a function of precompression stresses (f pi ) as shown in Figure 5 and a linear regression line is determined. The initial shear strength (τo ) is the y-intercept of the regression line while the angle of internal friction (α) can be determined from the slope of the regression line.
The characteristic value of the initial shear strength is f vok = 0.8 f vo and the characteristic angle of internal friction can be obtained from tan αk = 0.8 tan α.
2.3 Diagonal tension (shear) test - ASTM E519-02
This test was developed to determine more accurately the diagonal tensile (shear) strength of masonry than was possible with other available methods. The specimen size was selected as being the smallest that would be reasonably representative of a full-size masonry assemblage and that could be performed in the testing machines typical of laboratories.
The height and width of the specimen are 1200 mm and 1200 mm while the thickness depends on the thickness of the block. At least three specimens must be tested with all three constructed using the same type of block and mortar. When two types of mortar are to be evaluated, two sets of three specimens must be constructed.
Specimens should not be moved for at least seven days after construction and should be stored for at least 28 days in a controlled environment with temperature of 24 ± 8˚C and relative humidity between 25 and 75%.
In addition to testing the masonry specimen, the mortar and the block must be also tested according to the following:
-
Mortar - for each mortar type, three 50-mm cubes must be tested to determine the compressive strength of the mortar;
-
Units - at least six units must be tested to determine their compressive strength.
The procedure to test the specimens are as follows:
-
Placement of the loading shoes - the upper and lower loading shoes are centered on the upper and lower bearing surfaces of the testing machine and are placed on a diagonal of the specimen;
-
Specimen placement - the specimen is positioned such that the diagonal to be tested is centered with the axis of the testing machine. In some cases it is necessary to cap the specimen with gypsum in the lower loading shoe to obtain full contact between the shoe and the specimen;
-
Instrumentation - extensometers or LVTDs are to be used to measure the shortening or elongation of the two diagonals of the specimen.
The shear stress is calculated using Equation 3.
where:
Ss - shear stress, MPa;
P - applied load, N;
An - net area of the specimen, mm², calculated using equation 4.
where:
W - width of the specimen, mm;
h - height of the specimen, mm;
t - thickness of the specimen, mm;
n - percent of the gross area of the unit that is solid, expressed as a decimal.
The shear strain is calculated using Equation 5.
where:
γ - shearing strain, mm/mm;
ΔV - vertical shortening, mm;
ΔH - horizontal shortening, mm;
g - vertical gage length, mm;
ΔH must be based on the same gage length as for ΔV.
The modulus of rigidity or the modulus of elasticity in shear is calculated using Equation 6.
where:
G - modulus of rigidity, MPa.
2.4 Materials test
To determine the compressive strength of the masonry units, tests were conducted according to ASTM C140. Six specimens were tested as shown in Figure 6.a; the loading rate used was 1.27 mm/min. To determine the compressive strength of the mortar, tests were conducted as outlined in ASTM C109. Six specimens were tested as shown in Figure 6.b. To determine the compressive strength of the grout, tests were conducted as specified in ASTM C1019 and ASTM C39. Four specimens were tested as shown in Figure 6.c.
3. Specimen construction
The construction of the specimens for the bond wrench and shear strength tests and the construction of the wallettes for the diagonal tension tests are summarized in this section.
3.1 Bond wrench and shear strength specimens
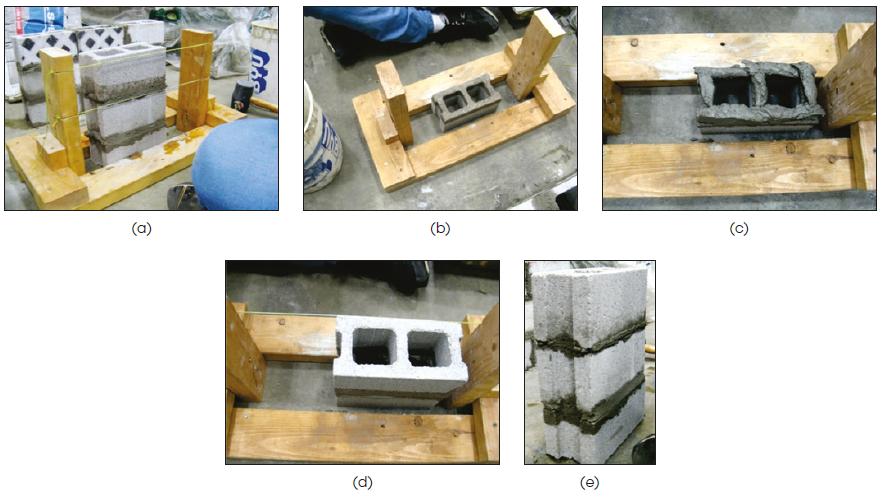
Prisms were constructed with three blocks for both types of test. A simple wood jig, shown in Figure 7.a, was built to facilitate the construction of the prisms.
The prisms were constructed as follows:
-
The top face of the block was moistened (to reduce absorption of the mortar water by the block) and the block was placed on the jig as shown in Figure 7.b;
-
A full bed of mortar was applied to the surface of the block as shown in Figure 7.c;
-
The next block was moistened and placed on the mortar bed as shown in Figure 7.d;
-
A line was used to aid the leveling the block and maintain the mortar bed thickness as close as possible to the specified thickness;
-
Steps 2 to 4 were repeated for the third block as shown in Figure 7.e;
-
The excess mortar was struck off with a trowel without disturbing the blocks.
3.2 Diagonal tension specimens
Ten wallettes were constructed: five hollow and five grouted. The wallettes were three blocks wide and six blocks high, constructed as follows:
-
The first course was constructed by buttering the webs of the blocks as shown in Figure 8.a;
-
The top face of the blocks was moistened, and a full bed of mortar applied as shown in Figure 8.b;
-
The second course of blocks was placed and the blocks leveled;
-
Steps 2 and 3 were repeated until the wallette was constructed. A complete wallette is shown in Figure 8.c.
Approximately 48 hours after being constructed, five wallettes were grouted as follows:
-
The grout space was cleaned from mortar droppings;
-
The wallettes were moistened;
-
Grout was placed in layers of approximately the height of the block. Each grout layer was rodded 15 times with a tamping rod. The first layer was rodded to its bottom while the other layers were rodded to about half of the previous layer;
-
The process was repeated for the other wallettes.
4. Test results
In this section, the results of the tests conducted are presented.
4.1 Materials
In Figure 9a the typical mode of failure of the blocks is shown, which was separation of the face shells. The average compressive strength of the blocks was approximately 18.4 MPa with a Coefficient of Variation of 8.8%, and the average modulus of elasticity of the blocks was 65.7 GPa with a Coefficient of Variation of 13.8%. In Figure 9b the typical mode of failure of the mortar cube is shown. The average compressive strength of the mortar was approximately 20.8 MPa with a Coefficient of Variation of 15.6%. In Figure 9c the typical mode of failure of the grout is shown. The average compressive strength of the grout was approximately 25.8 MPa with a Coefficient of Variation of 30.4%.
4.2 Bond wrench
The testing apparatus is shown in Figure 10 with a specimen ready for testing. The specimen was loaded by means of slowly placing sand in the bucket located on the right side of the loading apparatus as shown in Figure 10b. The mortar separated from either the loaded block, as shown in Figure 11a, or from the block below, as shown in Figure 11.b. Thirty joints were tested in total. The average tensile resistance of the mortar joint was 0.08 MPa with a coefficient of variation of approximately 29.5%.
4.3 Initial shear strength
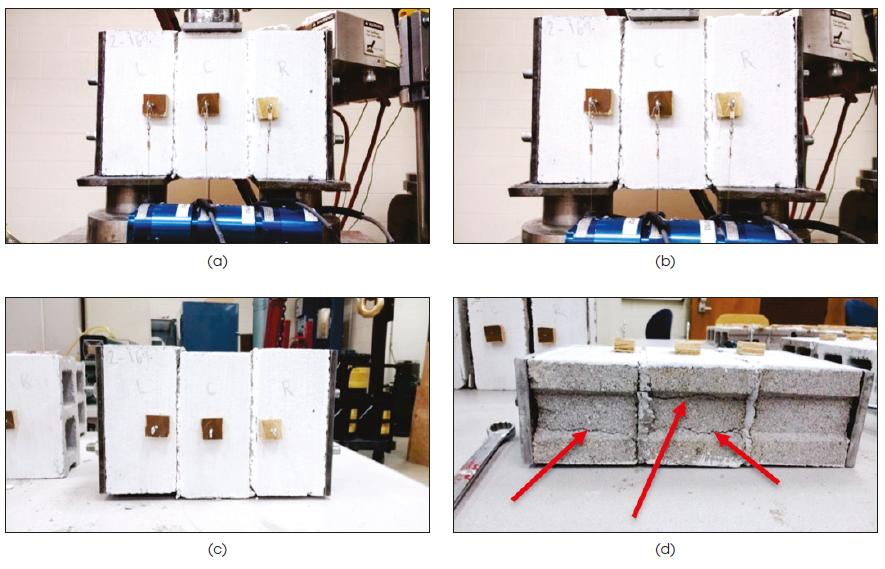
There were 30 specimens divided into three groups according to the precompression loading. Since the blocks used had a compressive strength greater than 10 MPa, precompression stresses were approximately 0.2, 0.6, and 1.0 MPa. A specimen ready to be tested is shown in Figure 12a while specimens after testing are shown in Figures 12b and c. The underside of the same specimen is shown in Figure 12d: the cracks through the webs that developed during the testing are visible.
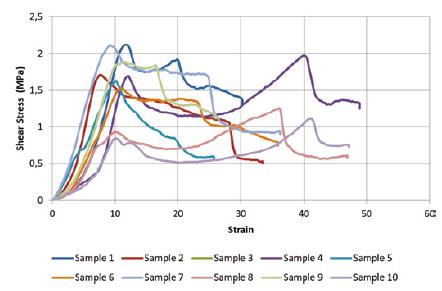
In Figures 13 to 15 the stress vs strain curves are presented for all specimens according to the applied precompression. Using the first peak stress and corresponding strain, an average shear strength and strain were determined; the values were approximately 0.52 MPa, 0.70 MPa and 1.01 MPa for each precompression level.
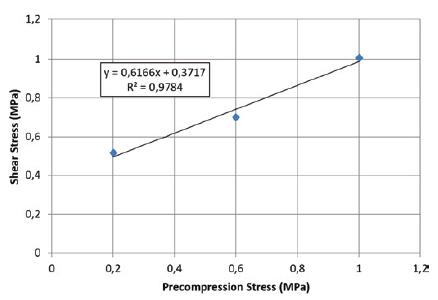
The average shear strength for each precompression stress as well as the regression line are shown graphically in Figure 16. The correlation between the regression line and the experimental data is excellent (R2 = 0.9884.) Thus, from the regression line, a reasonable value for the initial shear strength, i.e., the shear strength for no precompression, can be obtained. The initial shear strength, τo , is 0.37 MPa and tan φ is 0.61, which corresponds to an angle of internal friction (α) of 0.552 rad.
4.4 Diagonal tension (shear)
Tests were conducted as shown in Figure 17. The positioning of the specimen is important since misalignment of the specimen can cause shear or bending moment to be applied to the specimen, which are undesirable. Positioning of the instruments measuring the deformations is also important because the modulus of rigidity of the masonry will be based on these measurements.
The failure mode observed for all specimens, like that observed by others (Bolhassani et al. 2015[18] Bolhassani, M., Hamid, A. A., Lau, A. C. W., Moon, F. (2015). Simplified micro modeling of partially grouted masonry assemblages. Construction and Building Materials. v83. p159-173., Knox et al. 2018[28] Knox, C. L., Dizhur, D., Ingham, J. M. (2018). Experimental study on scale effects in clay brick masonry prisms and wall panels investigating compression and shear related properties. Construction and Building Materials. V163, p706-713.), was a crack along the vertical diagonal as shown in Figure 18.
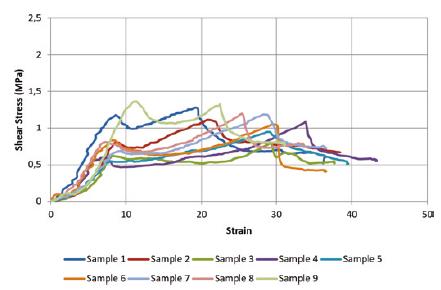
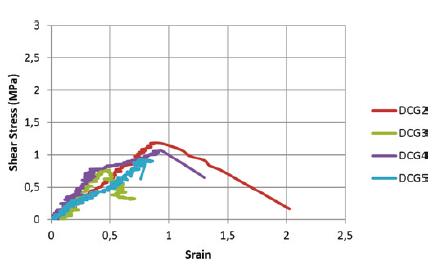
In Figures 19 and 20 the shear stress vs shear strain is shown for the hollow and grouted specimens, respectively. The average shear stress and modulus of rigidity of the hollow masonry are approximately 2.8 MPa (CV = 17.1%) and 3,390 MPa (CV = 29.2%), respectively. For the grouted masonry, the average shear stress and modulus of rigidity are approximately 1.0 MPa (CV = 17.0%) and 1,360 MPa (CV = 12.2%), respectively.
5. Analysis
In addition to the results obtained in this research, results from tests conducted by others are also presented and discussed.
5.1 Blocks
In Table 1, the results from compression tests conducted by several researchers on typical blocks, i.e., scale 1:1, and blocks of scales 1:2 and 1:3 are presented. The data show that the compressive strength of the block is independent of the block scale.
Using all the data obtained by others, the average compressive strength of the blocks is 24.2 MPa (CV = 46.9%) while the average compressive strength of the blocks used in this research is 18.4 MPa (CV = 8.8%), which is approximately 76% of 24.2 MPa.
Using the data for blocks of scale 1:2 only, as summarized in Table 2, the value obtained in this research represents approximately 82% of the average compressive strength obtained using the values obtained by others. When using the data for blocks of scale 1:1 only, as summarized in Table 3, the value obtained in this research represents approximately 83% of the average compressive strength obtained by others. This simple analysis shows that the ratio of the compressive strength of the blocks obtained herein to that obtained using results of tests conducted by others is independent of the block scale. Further, the analysis confirms that in order to model a particular form of masonry, the data associated with that masonry need to be used - a single set of data for example, will not represent all concrete blockwork from all over the world.
5.2 Initial shear strength
The parameters considered in this analysis are described below:
-
The initial shear strength and the angle of internal friction - these values are obtained from the regression of the average shear strength for each precompression stress;
-
Modulus of rigidity of the interface - this value is obtained from stress vs strain curve. Herein, the modulus of rigidity will be considered the same for both shear directions;
-
Modulus of rigidity of the interface - considering the modulus of elasticity of the block, the modulus of elasticity of the mortar, and the Poisson’s Ratio, this value will also be obtained using the equation proposed by Lourenço et al. (2004[33] Lourenço, P. B, Barros, J. A. O., Oliveira, J. T. (2004). Shear testing of stack bonded masonry, Construction and Building Materials. V18(2):125-132.).
In addition to the results obtained herein for the initial shear strength and the angle of internal friction, the results from tests conducted by five other researchers are considered. The initial shear strength and the angle of internal friction results are summarized in Table 4.
The ratios between the initial shear strength and angle of internal friction obtained in this research and those obtained from tests by other researchers are 0.40 and 0.67, respectively. Most likely the reason for the smaller values obtained herein is that half scale blocks were used; the blocks used for the specimens in the other tests were full scale. Such a difference was also observed by Mohammed et al. (2011[37] Mohammed,, A., Hughes, T. G., Mustapha, A. (2011). The effect of scale on the structural behaviour of masonry under compression. Construction and Building Materials. V25, p303-307.), who investigated the influence of size on the shear strength and angle of internal friction of blocks. Hughes (2010[24] Hughes, K. J. (2010). Behaviour of Reduced-Scale Reinforced Concrete Masonry Shear Walls and Components. Thesis. Macmaster University, Hamilton, Ontario, Canadá. 216p.) indicates that the size of the element may influence some properties of the material tested, as summarized in Table 5. Based on the values shown, the relationship between the shear strength for a half scale block and that of a full block is approximately 0.5; the same ratio is obtained for the angle of internal friction.
The values of modulus of rigidity for each level of precompression are summarized in Table 6.
In general, the stress-strain relationship is related to the size (or scale) of the block used and as the size increases or decreases, the behavior changes as depicted in Figure 21. Thus, the values obtained herein for the initial shear strength, the angle of internal friction, and the modulus of rigidity can be considered in good agreement with the values obtained when full scale blocks are used.
Lourenço et al. (2004[33] Lourenço, P. B, Barros, J. A. O., Oliveira, J. T. (2004). Shear testing of stack bonded masonry, Construction and Building Materials. V18(2):125-132.) developed an analytical tool to determine the modulus of rigidity based on thickness of the mortar joint, Poisson’s ratio, and the modulus of elasticity in the normal and in the transverse directions. The results of this analysis are summarized in Table 7 and the values obtained vary tremendously, again emphasizing the need for data for the particular masonry being modelled. These values have been used during numerical modeling, specifically for micro-modeling of the mortar-block interface.
5.3 Bond wrench
A literature search was conducted to find published results on the strength of the mortar to tension caused by flexure determined according to AS 3700 (2001). Unfortunately, not many published results were found, and the results obtained are for full scale blocks. The results are summarized in Table 8. When the number of specimens tested is less than 30, the standard specifies that the coefficient of variation must be less than 30%; the coefficient of variation for the results obtained during this research was 29.5%.
Pavía and Henley (2010[42] Pavía, S., Hanley, R. (2010). Flexural bond strength of natural hydraulic lime mortar and clay brick. Materials and Structures;43:913-922.) concluded that the mortar strength depends on various factors including the block geometry, the mortar type, and the curing time of the specimen. Barr et al. (2015[16] Barr, S., McCarter, W. J., Suryanto, B. (2015). Bond-strength performance of hydraulic lime and natural cement mortared sandstone masonry. Construction and Building Materials. V84, p128-135.) conducted tests immediately after, 1 minute after, and 15 minutes after construction of the specimens, and concluded that the strength of the mortar is a function of the water absorbed by the block. Thus, although the average value obtained herein is only about 40% of the average value obtained from the results of the tests conducted by other researchers; the value can still be considered satisfactory.
5.4 Diagonal tension
The results of the analysis are summarized in Table 9 for the hollow masonry and in Table 10 for the grouted masonry. There is a large scatter in the results obtained for hollow masonry. The reason is that only the mortar joint is resisting the applied load, and as mentioned earlier, mortar strength varies tremendously and is difficult to determine using current testing methods. For grouted masonry, however, the values are more consistent because the grout prevents large relative displacement between the block and the mortar at their interface. Thus, the specimens resist larger applied load but displace significantly less than their hollow counterparts. Although the grouted specimens can resist more load, the shear strength is lower than that of their hollow counterpart because the area resisting the shear is significantly larger than that of their hollow counterparts.
6. Concluding remarks
Based on the results and analysis presented, the following conclusion can be made:
1. Blocks
-
The stress-strain relationships of the tested blocks are in good agreement with each other;
-
The compressive strength of the block is independent of the block scale;
-
The modulus of elasticity of the block is within the values obtained by other researchers.
2. Initial shear strength
-
The higher precompression level appears to change the mode of failure of the specimens slightly. Cracks developed in the webs of the block at a precompression of 1.0 MPa but no cracks were observed for the other two smaller precompression levels;
-
Once one of the mortar joints fails, the central block of the specimen locks, causing an increase in capacity;
-
Considering the scale effect, the values for the initial shear strength and angle of internal friction obtained in this research are consistent with those obtained in other studies.
3. Bond wrench
-
The testing is very sensitive and must be conducted very carefully;
-
The rupture observed was consistent with that observed by others;
-
The flexural tensile strength of the block-mortar interface has significant variability;
-
The value obtained herein differs slightly from those obtained by other researchers.
4. Diagonal tension
-
The mode of rupture appears to be independent of the block scale used;
-
The mode of rupture is independent of the type of masonry. Both hollow and grouted masonry experienced the same type of failure;
-
The value obtained herein is slightly smaller than that obtained by other researchers due to the block size used;
-
The moduli of rigidity obtained herein are smaller than those obtained by other researchers due to the block size used;
-
The modulus of rigidity of hollow masonry varies tremendously because it is dependent significantly on the mortar-block interface strength.
5. Modelling
-
There is so much variation in the data that the values of the parameters needed to model a particular form of masonry should be determined for that masonry.
7. Acknowledgements
The authors are grateful for the financial support of CAPES (Coordenação de Aperfeiçoamento de Pessoal de Nível Superior) through the PDSE program (Programa de Doutorado Sanduíche no Exterior). Most specially the authors acknowledge the half-scale blocks donated by the Canadian Masonry Design Centre.
8. References
-
[1]Abdou, L., Ami Saada, R., Meftah, F., Mebarki, A. (2006). Experimental investigations of the joint-mortar behaviour. Mechanics Research Communications. V33. 370-384.
-
[2]Abdulla, K. F., Cunningham, L. S., Gillie, M. (2017). Simulating masonry wall behaviour using a simplified micro-model approach. Engineering Structures, 151, 349-365.
-
[3]Abdulla, K., Cunningham, L., Gillie, M. (2017b). Non-linear simulation of masonry behaviour under cyclic loads. Proceedings of the 2017 MACE PGR Conference. University of Manchester, Manchester.
-
[4]Almeida, J. A. P. P., Bordigoni, D., Pereira, E. B., Barros, J. A. O., Aprile, A. (2016). Assessment of the properties to characterise the interface between clay brick substrate and strengthening mortar. Construction and Building Materials. v103. p47-66.
-
[5]Alotaibi, K. S., Galal, K. (2018). Experimental study of CFRP confined reinforced concrete masonry columns tested under concentric and eccentric loading. Elsevier Journal of Composites Part B: Engineering, 155:257-271.
-
[6]American Society for Testing and Material (ASTM 2008). Standard test method for compressive strength of hydraulic cement mortars (using 2-in. or [50-mm] Cube specimens. ASTM-C109, West Conshohocken, PA.
-
[7]American Society for Testing and Material (ASTM 2009). Standard test method for sampling and testing concrete masonry units and related units. ASTM-C140, West Conshohocken, PA.
-
[8]American Society for Testing and Material (ASTM 2009). Standard test method for sampling and testing grout. ASTM-C1019, West Conshohocken, PA.
-
[9]American Society for Testing and Material (ASTM 2014). Standard test method for compressive strength of cylindrical concrete specimens. ASTM-C39, West Conshohocken, PA.
-
[10]Araújo, A. F. (2002). Metodologia para Avaliação da Resistência de Aderência ao Cisalhamento de Prismas para Alvenaria Estrutural. Dissertação (Mestrado). Programa de Pós-Graduação em Engenharia de Estruturas, Universidade Federal de Minas Gerais (UFMG), Belo Horizonte. 149p.
-
[11]AS 3700 (2001). Masonry Structures, Australian Standard (AS), Sydney, NSW.
-
[12]Banting, B., El-Dakhakhni, W. (2014). Seismic performance quantification of reinforced masonry structural walls with boundary elements. J. Struct. Eng., 140(5), 1-15.
-
[13]Barbosa, C. S. (2008). Resistência e deformabilidade de blocos vazados de concreto, prismas e paredes e suas correlações com as propriedades mecânicas dos materiais constituintes. Tese (Doutorado). Escola de Engenharia de São Carlos. Universidade de São Paulo, São Carlos, SP. 262p.
-
[14]Barbosa, K. C. (2005). Avaliação Experimental do Fenômeno de Retração em Alvenaria de Blocos de Concreto. Dissertação (Mestrado). Programa de Pós-Graduação em Estruturas e Construção Civil - Universidade Federal de São Carlos (UFSCar) - SP. 252p.
-
[15]Barbosa, P. C. (2000). Estudo da interação de paredes de alvenaria estrutural com vigas de concreto armado. Dissertação (Mestrado) - Escola de Engenharia de São Carlos, Universidade de São Paulo, São Carlos. 110p.
-
[16]Barr, S., McCarter, W. J., Suryanto, B. (2015). Bond-strength performance of hydraulic lime and natural cement mortared sandstone masonry. Construction and Building Materials. V84, p128-135.
-
[17]Bolhassani, M. (2015). Improvement of Seismic Performance of Ordinary Reinforced Partially Grouted Concrete Masonry Shear Walls. Dissertation. 401p. Faculty of Drexel University, Drexel University.
-
[18]Bolhassani, M., Hamid, A. A., Lau, A. C. W., Moon, F. (2015). Simplified micro modeling of partially grouted masonry assemblages. Construction and Building Materials. v83. p159-173.
-
[19]BS EN 1052-3:2002 - Methods of test for Masonry: Part 3: Determination of Initial Shear Strength, Brussels.
-
[20]Capuzzo Neto, V. (2000). Estudo teórico e experimental da interação de paredes de alvenaria estrutural submetidas a ações verticais. Dissertação (Mestrado) - Escola de Engenharia de São Carlos, Universidade de São Paulo, São Carlos, 111p.
-
[21]Contadini, L. F. (2014). Análise teórica e experimental do comportamento de vigas de alvenaria estrutural armada sujeitas à flexão simples. Dissertação (Mestrado) - Departamento de Engenharia Civil - Universidade Estadual Júlio de Mesquita Filho (UNESP) - SP. 151p.
-
[22]Drysdale, R. G., Hamid, A. A., and Baker,L.R., (1999). Masonry Structures Behavior and Design. Prentice Hall, New Jersey.
-
[23]Fortes, E. S. (2017). Caracterização da alvenaria estrutural de alta resistência. Tese (doutorado). Pós-Graduação em Estruturas e Construção Civil (UFSCar). 350p.
-
[24]Hughes, K. J. (2010). Behaviour of Reduced-Scale Reinforced Concrete Masonry Shear Walls and Components. Thesis. Macmaster University, Hamilton, Ontario, Canadá. 216p.
-
[25]Izquierdo, O. S. (2015). Estudo da interface bloco/graute em elementos de alvenaria estrutural. Tese (Doutorado) - Escola de Engenharia de São Carlos, Universidade de São Paulo, São Carlos. 290p.
-
[26]Kaaki, T. (2013). Behavior and Strength of Masonry Prisms Loaded in Compression. Thesis. Dalhousie University, Halifax, Nova Scotia, Canadá. 112p.
-
[27]Khalaf, F. M. (2005). New test for determination of masonry tensile bond strength. Journal of materials in civil engineering, 17(6), 725-732.
-
[28]Knox, C. L., Dizhur, D., Ingham, J. M. (2018). Experimental study on scale effects in clay brick masonry prisms and wall panels investigating compression and shear related properties. Construction and Building Materials. V163, p706-713.
-
[29]Landini, F. S. (2001). Comportamento à flexão e ao esforço cortante de vigas em alvenaria estrutural. 2001. Dissertação (Mestrado). Faculdade Engenharia Civil - Universidade Estadual de Campinas (UNICAMP) - SP. 135p.
-
[30]Lizárraga, J. F. and Pérez-Gavilán, J. J. (2017). Parameter estimation for nonlinear analysis of multi-perforated concrete masonry walls. Construction and Building Materials, 141, 353-365.
-
[31]Long, L., Hamid, A. A., Drysdale, R.G. (2005). Small-Scale Modelling of Concrete Masonry Using ½ - Scale Units: A Preliminary Study. 10th Canadian Masonry Symposium. Banff, Alberta. 2005
-
[32]Lopes, G. L., (2014) Estudo teórico e experimental de paredes esbeltas de alvenaria estrutural. Dissertação (Mestrado). Programa de Pós-Graduação em Estruturas e Construção Civil - Universidade Federal de São Carlos (UFSCar) - SP. 133p.
-
[33]Lourenço, P. B, Barros, J. A. O., Oliveira, J. T. (2004). Shear testing of stack bonded masonry, Construction and Building Materials. V18(2):125-132.
-
[34]Madia, F. C. A. R. (2012). Estudo de Pórticos Preenchidos com Alvenaria. Dissertação (Mestrado). Programa de Pós-Graduação em Estruturas e Construção Civil - Universidade Federal de São Carlos (UFSCar) - SP. 146p.
-
[35]Maluf D. R., (2007) Estudo de Painéis de Alvenaria Estrutural Sujeitos a Ações Perperncidculares ao Plano. Dissertação (Mestrado). Programa de Pós-Graduação em Estruturas e Construção Civil - Universidade Federal de São Carlos (UFSCar) - SP. 120p.
-
[36]Massart, T. J., Peerlings, R. H. J., Geers, M. G. D. (2004). Mesoscopic modeling of failure and damage-induced anisotropy in brick masonry. European Journal of Mechanics A/Solids. v23.
-
[37]Mohammed,, A., Hughes, T. G., Mustapha, A. (2011). The effect of scale on the structural behaviour of masonry under compression. Construction and Building Materials. V25, p303-307.
-
[38]Nasiri, E., Liu, Y. (2017). Development of a detailed 3D FE model for analysis of the in-plane behaviour of masonry infilled concrete frames. Engineering Structures. v143. p603-616.
-
[39]Oliveira, L. M. F. (2014). Estudo Teórico E Experimental Do Comportamento Das Interfaces Verticais De Paredes Interconectadas De Alvenaria Estrutural. Tese de Doutorado - Departamento de Estruturas, Escola de Engenharia de São Carlos, Universidade de São Paulo, São Carlos - SP. 272 p.
-
[40]Pasquantonio, R. D. (2015). Análise teórica e experimental de vigas de alvenaria estrutural sujeitas ao cisalhamento. Dissertação (Mestrado). Programa de Pós-Graduação em Estruturas e Construção Civil - Universidade Federal de São Carlos (UFSCar) - SP. 179p.
-
[41]Pasquantonio, R. D., Fonseca, F. S., Shrive, N. G., Parsekian, G. A. (2018). Caracterização De Alvenaria De Blocos De Concreto De Escala Reduzida. In: 60º Congresso Brasileiro Do Concreto, Foz Do Iguaçu. Anais do 60º Congresso Brasileiro Do Concreto. São Paulo: Ibracon. V. 1. P. 1-12.
-
[42]Pavía, S., Hanley, R. (2010). Flexural bond strength of natural hydraulic lime mortar and clay brick. Materials and Structures;43:913-922.
-
[43]Santos, C. F. R. (2016). Avaliação numérica da interação de paredes de alvenaria estrutural submetidas às ações verticais. Viçosa. Dissertação (Mestrado) - Universidade Federal de Viçosa. 213p.
-
[44]Santos, E. A. F. (2014). Estudo da influência das propriedades elásticas da interface bloco-argamassa na rigidez de paredes de alvenaria. Dissertação (Mestrado)- Escola de Engenharia de São Carlos, Universidade de São Paulo, São Carlos. 277p.
-
[45]Shabdin, M., Zargaran, M., Attari, N. K. (2018). Experimental diagonal tension (shear) test of Un-Reinforced Masonry (URM) walls strengthened with textile reinforced mortar (TRM). Construction and Building Materials, 164, 704-715.
-
[46]Silva, W. J. (2014). Análise experimental e numérica da distribuição das ações verticais entre paredes de alvenaria estrutural com a utilização de modelo físico reduzido na escala 1:5. Tese de Doutorado - Departamento de Estruturas, Escola de Engenharia de São Carlos, Universidade de São Paulo, São Carlos - SP. 331 p.
-
[47]Thamboo, J. A., Dhanasekar, M., Yan, C. (2013). Flexural and Shear Bond Characteristics of Thin Layer Polymer Cement Mortared Concrete Masonry. Construction and Building Materials. V46, p104-113.
-
[48]Vandoren, B., Proft, K., Simone, A., Sluys, L. J. (2013). Mesoscopic modelling of masonry using weak and strong discontinuities. Computer Methods in Applied Mechanics and Engineering. V255. p167-182.
-
[49]Vermeltfoort, A. T. (2012). Shear Strength Variation due to Mortar Strength Variation and the use of a Triplet Shear Test Set-Up. 15th International Brick and Block Masonry Conference. Florianopolis.
-
[50]Wierzbicki, J. C. (2010). Behavior of Reduced-Scale Fully Grouted Concrete Block Shear Walls. Dissertação (Mestrado). Macmaster University, Hamilton, Ontario, Canada. 205p.
Publication Dates
-
Publication in this collection
13 July 2020 -
Date of issue
May-Jun 2020
History
-
Received
29 May 2019 -
Accepted
13 Dec 2019 -
Published
26 May 2020

 AS 3700 (2001) - Adapted
 AS 3700 (2001) - Adapted
 BS EN 1052-3 (2002) - Adapted
 BS EN 1052-3 (2002) - Adapted
 BS EN 1052-3 (2002) - Adapted