Abstract
Crassostrea rhizophorae and C. gasar oysters are cultivated in the northeast region. Perkinsus parasites infect bivalves, and their effects on oysters from tropical regions are poorly understood. This study evaluated the impact of Perkinsus infection on the productive traits of native oysters. Oysters were sampled bimonthly during 7 months, from July 2010 to February 2011, to evaluate growth rate, mortality and shell color patterns (white and dark-gray) (n = 500), and to determine the prevalence and intensity of Perkinsus (n = 152). Perkinsus and Crassostrea species were determined using molecular tools. Results showed that most dark-gray (90%, n = 20) and white (67%, n = 18) oysters were C. gasar and C. rhizophorae, respectively. Oysters showed a high growth rate and moderate cumulative mortality (44%). C. gasar oysters grew better and showed lower mortality and lower incidence of Perkinsus compared to C. rhizophorae. The mean prevalence of Perkinsus was moderate (48%), but the infection intensity was light (2.2). Perkinsosis affected very small oysters (19.4 mm). In conclusion, native oysters, especially C. gasar, have a great potential for culture, mortality is not associated with perkinsosis, and the shell color of oysters can be used to improve selection for spats with better performance.
Keywords:
Oyster productive traits; Perkinsus marinus; Perkinsus beihaiensis; PCR-RFLP; ITS rDNA; 16S mtDNA
Resumo
Crassostrea rhizophorae e C. gasar são cultivadas na região Nordeste. Parasitas Perkinsus infectam bivalves e seus efeitos em ostras de regiões tropicais são pouco compreendidos. Este estudo avaliou o impacto da infecção por Perkinsus em parâmetros de produção de ostras nativas. Ostras foram coletadas bimestralmente durante 7 meses, de julho de 2010 a fevereiro de 2011, para avaliar crescimento, mortalidade e padrão de coloração da concha (branca e cinza-escura) (n = 500); além da presença e intensidade de Perkinsus (n = 152). Perkinsus e Crassostrea foram identificados por abordagem molecular. Os resultados mostraram que as ostras cinza-escuras (90%, n = 20) e brancas (67%, n = 18) eram C. gasar e C. rhizophorae, respectivamente. As ostras mostraram uma boa taxa de crescimento e mortalidade acumulada moderada (44%). C. gasar cresceu melhor com menor mortalidade e menor incidência de Perkinsus que C. rhizophorae. A prevalência média de Perkinsus foi moderada (48%), mas a intensidade de infecção foi leve (2,2). A perkinsiose afetou ostras pequenas (19,4 mm). Em conclusão, ostras nativas, especialmente C. gasar, têm grande potencial de produção; sem mortalidade associada à perkinsiose; e, a cor da concha pode ser usada para melhorar a seleção de sementes com melhor desempenho.
Palavras-chave:
Parâmetros de produção de ostras; Perkinsus marinus; Perkinsus beihaiensis; PCR-RFLP; ITS rDNA; 16S mtDNA
Introduction
Two mangrove oyster species, Crassostrea rhizophorae and C. gasar, inhabit the estuaries of the northeast region of Brazil. Additionally, they have wide geographical distribution, with C. rhizophorae inhabiting from the southern Caribbean to Uruguay and C. gasar from South America to Africa (LAPÈGUE et al., 2002Lapègue S, Boutet I, Leitão A, Heurtebise S, Garcia P, Thiriot-Quiévreux C, et al. Trans-Atlantic distribution of a mangrove oyster species revealed by 16S mtDNA and karyological analyses. Biol Bull 2002; 202(3): 232-242. PMid:12086994. http://dx.doi.org/10.2307/1543473.
http://dx.doi.org/10.2307/1543473...
).
Mangrove oysters are produced in the northeast region of Brazil using artisanal techniques, which include the sampling of naturally settled spats at different places in an estuary (bottom substrate, roots of mangrove tree, and culture structures) and hand-managing oysters for all culture stages. Estimates of the oyster production in northeastern Brazil are scarce and underestimated. In contrast, the state of Santa Catarina (SC, South Brazil) is the biggest national producer of bivalves (17,000 tons of Perna perna mussels and 3,000 tons of C. gigas) (SANTOS & COSTA, 2015Santos AA, Costa SW. Síntese informativa da maricultura. Santa Catarina: EPAGRI; 2015). The production of the exotic Japanese oyster C. gigas (POLI, 2004Poli CR. Cultivo de ostras do Pacífico. In: Poli CR, Poli AT, Andreatta E, Beltrame EC. Aquicultura: experiências brasileiras. Florianópolis: Multitarefa; 2004. p. 251-266.) depends on hatchery-reared spats and has a somewhat mechanized system. Since 1990, spats are annually produced by the Laboratory of Marine Mollusks at the Federal University of Santa Catarina and are sold to local farmers. In contrast, recently (2014), a private enterprise implemented a hatchery facility in the northeast region to produce spats of C. gasar (DA SILVA et al., 2016Da Silva PM, Costa CP, Araújo JPB, Queiroga FR, Wainberg AA. Epizootiology of Perkinsus sp. in Crassostrea gasar oysters in polyculture with shrimps in northeastern Brazil. Rev Bras Parasitol Vet 2016; 25(1): 37-45. PMid:27007244. http://dx.doi.org/10.1590/S1984-29612016011.
http://dx.doi.org/10.1590/S1984-29612016...
). However, the supply of continuous spats is not certain because of the high costs of running these facilities and the need for financial support.
Genetic variability among native mangrove oyster populations is high (LAZOSKI et al., 2011Lazoski C, Gusmão J, Boudry P, Solé-Cava AM. Phylogeny and phylogeography of Atlantic oyster species: Evolutionary history, limited genetic connectivity and isolation by distance. Mar Ecol Prog Ser 2011; 426: 197-212. http://dx.doi.org/10.3354/meps09035.
http://dx.doi.org/10.3354/meps09035...
), which is reflected by the wide variation in shell morphology and shell color. Additionally, due to their phenotypic plasticity, distinguishing between the two sympatric oyster species by morphological characteristics becomes very difficult. Therefore, Rios (2009)Rios EC. Compendium of brazilian sea shells. Rio Grande: Evangraf; 2009. considered mangrove oysters from Brazil to be the same species (C. rhizophorae). By contrast, Absher (1989)Absher TM. Populações naturais de ostras do gênero Crassostrea do litoral do Paraná—Desenvolvimento larval, recrutamento e crescimento [thesis]. São Paulo: Universidade de São Paulo; 1989. observed some differences in growth rates and larval morphology among sympatric lineages of Crassostrea, which supports the existence of two species, C. rhizophorae and C. gasar. Notwithstanding, observations by oyster farmers indicate two macroscopically distinguishable shell color patterns, white and dark-gray. They noticed potentially different performances of these oysters in culture as well. White oysters seemed to take a longer time to reach commercial size (pers. comm.). Since the shell color patterns of these oysters could represent different oyster species, choosing the correct species for production is desirable, especially considering the lack of hatchery-reared spats. Nevertheless, the performances of these two oyster species in culture have never been directly compared.
In Brazil, C. gigas production is already consolidated, while native oyster production is still in the exploratory phase. Recently, some studies were conducted in order to evaluate oyster maturation (RAMOS et al., 2014Ramos CO, Gomes CHAM, Magalhães ARM, Santos AI, Melo CMR. Maturation of the mangrove oyster Crassostrea gasar at different temperatures in the laboratory. J Shellfish Res 2014; 33(1): 187-194. http://dx.doi.org/10.2983/035.033.0118.
http://dx.doi.org/10.2983/035.033.0118...
), larval settlement (SILVEIRA et al., 2011Silveira RC, Silva FC, Gomes CHM, Ferreira JF, Melo CMR. Larval settlement and spat recovery rates of the oyster Crassostrea brasiliana (Lamarck, 1819) using different systems to induce metamorphosis. Braz J Biol 2011; 71(2): 557-562. PMid:21755177. http://dx.doi.org/10.1590/S1519-69842011000300029.
http://dx.doi.org/10.1590/S1519-69842011...
) and performance in culture (LOPES et al., 2013Lopes GR, Gomes CHAM, Tureck CR, Melo CMR. Growth of Crassostrea gasar cultured in marine and estuary environments in Brazilian waters. Pesq Agropecu Bras 2013; 48(8): 975-982. http://dx.doi.org/10.1590/S0100-204X2013000800024.
http://dx.doi.org/10.1590/S0100-204X2013...
).
Perkinsosis is a disease caused by protozoan parasites from the Perkinsus genus, which includes two species, Perkinsus marinus and P. olseni, which are responsible for mortality in their hosts, consisting of C. virginica and Ruditapes spp. (VILLALBA et al., 2011Villalba A, Gestal C, Casas SM, Figueras A. Perkinsosis en moluscos. In: Figueras A, Novoa B. Enfermedades de moluscos bilvalvos de interés en acuicultura. Madrid: Fundación Observatorio Español de Acuicultura; 2011. p. 181-242.). Perkinsus spp. were recently reported in Brazil, infecting C. rhizophorae and C. gasar oysters and Anomalocardia brasiliana clams from the northeastern region (DA SILVA et al., 2013Da Silva PM, Vianna RT, Guertler C, Ferreira LP, Santana LN, Fernández-Boo S, et al. First report of the protozoan parasite Perkinsus marinus in South America, infecting mangrove oysters Crassostrea rhizophorae from the Paraíba River (NE, Brazil). J Invertebr Pathol 2013; 113(1): 96-103. PMid:23439264. http://dx.doi.org/10.1016/j.jip.2013.02.002.
http://dx.doi.org/10.1016/j.jip.2013.02....
; FERREIRA et al., 2015Ferreira LP, Sabry RC, Da Silva PM, Gesteira TCV, Romão LS, Paz MP, et al. First report of Perkinsus beihaiensis in wild clams Anomalocardia brasiliana (Bivalvia: Veneridae) in Brazil. Exp Parasitol 2015; 150: 67-70. PMid:25088443. http://dx.doi.org/10.1016/j.exppara.2014.07.012.
http://dx.doi.org/10.1016/j.exppara.2014...
; LUZ & BOEHS, 2016Luz MSA, Boehs G. Perkinsus beihaiensis infectando a ostra Crassostrea rhizophorae em cultivo e em estoque natural na Baía de Camamu, Bahia, Brasil. Braz J Vet Res Anim Sci 2016; 53(2): 191-198. http://dx.doi.org/10.11606/issn.1678-4456.v53i2p191-198.
http://dx.doi.org/10.11606/issn.1678-445...
; QUEIROGA et al., 2013Queiroga FR, Marques-Santos LF, Hégaret H, Soudant P, Farias ND, Schlindwein AD, et al. Immunological responses of the mangrove oysters Crassostrea gasar naturally infected by Perkinsus sp. in the Mamanguape Estuary, Paraíba state (Northeastern, Brazil). Fish Shellfish Immunol 2013; 35(2): 319-327. PMid:23664909. http://dx.doi.org/10.1016/j.fsi.2013.04.034.
http://dx.doi.org/10.1016/j.fsi.2013.04....
, 2015Queiroga FR, Vianna RT, Vieira CB, Farias ND, Da Silva PM. Parasites infecting the cultured oyster Crassostrea gasar (Adanson, 1757) in Northeast Brazil. Parasitology 2015; 142(6): 756-766. PMid:25553815. http://dx.doi.org/10.1017/S0031182014001863.
http://dx.doi.org/10.1017/S0031182014001...
; SABRY et al., 2009Sabry RC, Rosa RD, Magalhães ARM, Barracco MA, Gesteira TCV, Da Silva PM. First report of Perkinsus sp. infecting mangrove oysters Crassostrea rhizophorae from the Brazilian coast. Dis Aquat Organ 2009; 88(1): 13-23. PMid:20183961. http://dx.doi.org/10.3354/dao02136.
http://dx.doi.org/10.3354/dao02136...
, 2013Sabry RC, Gesteira TCV, Magalhães ARM, Barracco MA, Guertler C, Ferreira LP, et al. Parasitological survey of mangrove oyster, Crassostrea rhizophorae, in the Pacoti River Estuary, Ceará State, Brazil. J Invertebr Pathol 2013; 112(1): 24-32. PMid:23147104. http://dx.doi.org/10.1016/j.jip.2012.10.004.
http://dx.doi.org/10.1016/j.jip.2012.10....
). P. marinus and P. olseni are both notifiable to the World Organisation for Animal Health (OIE) and were reported to infect C. gasar oysters from the estuary of the São Francisco River, Sergipe State (DA SILVA et al., 2014Da Silva PM, Scardua MP, Vianna RT, Mendonça RC, Vieira CB, Dungan CF, et al. Two Perkinsus spp. infect Crassostrea gasar oysters from cultured and wild populations of the Rio São Francisco estuary, Sergipe, northeastern Brazil. J Invertebr Pathol 2014; 119: 62-71. PMid:24780219. http://dx.doi.org/10.1016/j.jip.2014.04.005.
http://dx.doi.org/10.1016/j.jip.2014.04....
).
Little is known about the dynamics of Perkinsus spp. infection in tropical bivalve species under cultured conditions (DA SILVA et al., 2014Da Silva PM, Scardua MP, Vianna RT, Mendonça RC, Vieira CB, Dungan CF, et al. Two Perkinsus spp. infect Crassostrea gasar oysters from cultured and wild populations of the Rio São Francisco estuary, Sergipe, northeastern Brazil. J Invertebr Pathol 2014; 119: 62-71. PMid:24780219. http://dx.doi.org/10.1016/j.jip.2014.04.005.
http://dx.doi.org/10.1016/j.jip.2014.04....
, 2016Da Silva PM, Costa CP, Araújo JPB, Queiroga FR, Wainberg AA. Epizootiology of Perkinsus sp. in Crassostrea gasar oysters in polyculture with shrimps in northeastern Brazil. Rev Bras Parasitol Vet 2016; 25(1): 37-45. PMid:27007244. http://dx.doi.org/10.1590/S1984-29612016011.
http://dx.doi.org/10.1590/S1984-29612016...
; LUZ & BOEHS, 2016Luz MSA, Boehs G. Perkinsus beihaiensis infectando a ostra Crassostrea rhizophorae em cultivo e em estoque natural na Baía de Camamu, Bahia, Brasil. Braz J Vet Res Anim Sci 2016; 53(2): 191-198. http://dx.doi.org/10.11606/issn.1678-4456.v53i2p191-198.
http://dx.doi.org/10.11606/issn.1678-445...
). No differences in P. beihaiensis prevalence was observed among cultured (61%) and wild (77%) C. rhizophorae oysters from Bahia state (LUZ & BOEHS, 2016Luz MSA, Boehs G. Perkinsus beihaiensis infectando a ostra Crassostrea rhizophorae em cultivo e em estoque natural na Baía de Camamu, Bahia, Brasil. Braz J Vet Res Anim Sci 2016; 53(2): 191-198. http://dx.doi.org/10.11606/issn.1678-4456.v53i2p191-198.
http://dx.doi.org/10.11606/issn.1678-445...
), while prevalence varied in oysters (cultured 80% and wild 57%) from the Sergipe state, probably because in the latter region, there are two species of Perkinsus and Crassostrea oysters (DA SILVA et al., 2014Da Silva PM, Scardua MP, Vianna RT, Mendonça RC, Vieira CB, Dungan CF, et al. Two Perkinsus spp. infect Crassostrea gasar oysters from cultured and wild populations of the Rio São Francisco estuary, Sergipe, northeastern Brazil. J Invertebr Pathol 2014; 119: 62-71. PMid:24780219. http://dx.doi.org/10.1016/j.jip.2014.04.005.
http://dx.doi.org/10.1016/j.jip.2014.04....
).
For the oyster industry, it is imperative to know the impact of Perkinsus spp. on the productive traits of oysters, such as growth and mortality, during the complete cultured period. For the first time, Da Silva et al. (2016)Da Silva PM, Costa CP, Araújo JPB, Queiroga FR, Wainberg AA. Epizootiology of Perkinsus sp. in Crassostrea gasar oysters in polyculture with shrimps in northeastern Brazil. Rev Bras Parasitol Vet 2016; 25(1): 37-45. PMid:27007244. http://dx.doi.org/10.1590/S1984-29612016011.
http://dx.doi.org/10.1590/S1984-29612016...
evaluated the incidence of Perkinsus sp. in C. gasar oysters from spats reared in a hatchery facility to adult (commercial size) during growth in shrimp ponds. Mortality was not estimated. However, the effects of Perkinsus spp. on oysters cultured in Brazilian estuaries and marine environments were never analyzed.
The aim of the present study was to investigate oyster growth and mortality, identify the oyster species according to the shell color patterns and assess the impact of Perkinsus spp. on oysters during the entire outgrowth period.
Materials and Methods
Experimental design for oyster on growing
Oysters were cultured in a suspended - fixed system in the estuary of the River São Francisco (10° 32' 0.60” S, 36° 29' 36.24” W) in the Sergipe state of northeastern Brazil (Figure 1).
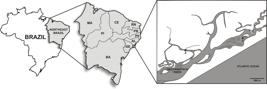
Map of Brazil showing the Northeastern region, the estuary of the São Francisco River and the sampling site (*1) where oysters were cultivated.
In July 2010, spats (n = 1,000) were obtained from a natural settlement on culture structures (ropes, bags, and stakes) and distributed into two nurseries bags (1 m2) with 500 oysters on each. Oyster spats (n = 50 per bag) were sampled for their initial biometry (shell height and whole weight), determination of their shell color (white or dark-gray) and Perkinsus spp. diagnosis by PCR (n = 12; Table 1).
Number of oysters used for Perkinsus diagnosis and the identification of parasite and host species. Sequenced samples were the same used for PCR-RFLP.
Oysters were sampled bimonthly (September, October, and December 2010 and February 2011) in duplicates (n = 50) or quadruplicates (n = 25), totalizing 100 oysters per month to estimate the shell height, whole weight as well as the oyster shell color. For Perkinsus spp. diagnosis by Ray’s fluid thioglycollate medium (RFTM) oysters were sampled in duplicates (n = 15) or quadruplicates (n = 10), totalizing 30 or 40 oysters per month.
The mortality rate was estimated as the proportion of dead oysters at each bimonthly sample, in duplicates (n = 50) or quadruplicates (n = 25), totalizing 100 oysters per month and the cumulative mortality was the sum of the mortality rates. The shell color of dead oysters was also recorded.
Perkinsus spp. diagnosis
Gills were excised from each oyster and divided into two fragments, which were (i) incubated in RFTM (RAY, 1966Ray SM. A review of the culture method of detecting Dermocystidium marinum with suggested modifications and precautions. Proc Nat Shellfish Assoc 1966; 54: 55-69.) and (ii) preserved in 96% ethanol for molecular diagnosis. After 7 days of incubation in RFTM at room temperature in darkness, the gills were chopped, stained with lugol and analyzed for the presence and intensity of Perkinsus hypnospores. Oysters were classified using the Mackin (1962)Mackin J. Oyster disease caused by Dermocystidium marinum and other microorganisms in Louisiana. Publ Inst Mar Sci 1962; 7: 132-299. intensity scale adapted by Da Silva et al. (2013)Da Silva PM, Vianna RT, Guertler C, Ferreira LP, Santana LN, Fernández-Boo S, et al. First report of the protozoan parasite Perkinsus marinus in South America, infecting mangrove oysters Crassostrea rhizophorae from the Paraíba River (NE, Brazil). J Invertebr Pathol 2013; 113(1): 96-103. PMid:23439264. http://dx.doi.org/10.1016/j.jip.2013.02.002.
http://dx.doi.org/10.1016/j.jip.2013.02....
, including uninfected (level 0) or infected oysters (1- very lightly, 2- lightly, 3- moderately and 4-heavily).
The mean of the infection was estimated as the sum of the infection intensity levels (1-4) divided by the number of infected oysters at each sampling time (BUSH et al., 1997Bush AO, Lafferty KD, Lotz JM, Shostak AW. Parasitology meets ecology on its own terms: Margolis et al. revisited. J Parasitol 1997; 83(4): 575-583. PMid:9267395. http://dx.doi.org/10.2307/3284227.
http://dx.doi.org/10.2307/3284227...
). The prevalence of Perkinsus sp. infections was estimated as the proportion of infected oysters at each sampling time.
PCR assays
The oyster gill samples (50 - 80 mg) were submitted for DNA extraction with a DNAzol (Invitrogen, Brazil) reagent, according to the manufacturer’s instructions (Table 1).
To identify the species of Perkinsus, the ITS regions of the Perkinsus spp. gene complexes were amplified from the isolated DNAs using the genus-specific primers PerkITS-85 and PerkITS-750 (CASAS et al., 2002Casas SM, La Peyre JF, Reece KS, Azevedo C, Villalba A. Continuous in vitro culture of the carpet shell clam Tapes decussatus protozoan parasite Perkinsus atlanticus. Dis Aquat Organ 2002; 52(3): 217-231. PMid:12553450. http://dx.doi.org/10.3354/dao052217.
http://dx.doi.org/10.3354/dao052217...
). These primer pairs were used to amplify a specific region of the internal transcriber spacer (ITS) of the small subunit of ribosomal RNA (SSU rRNA) in the genomic DNA. DNA samples from in vitro cell cultures of P. olseni, from P. marinus-infected oysters (GenBank JX144335) (DA SILVA et al., 2013Da Silva PM, Vianna RT, Guertler C, Ferreira LP, Santana LN, Fernández-Boo S, et al. First report of the protozoan parasite Perkinsus marinus in South America, infecting mangrove oysters Crassostrea rhizophorae from the Paraíba River (NE, Brazil). J Invertebr Pathol 2013; 113(1): 96-103. PMid:23439264. http://dx.doi.org/10.1016/j.jip.2013.02.002.
http://dx.doi.org/10.1016/j.jip.2013.02....
) and from P. beihaiensis-infected oysters (GenBank FJ472346) (SABRY et al., 2009Sabry RC, Rosa RD, Magalhães ARM, Barracco MA, Gesteira TCV, Da Silva PM. First report of Perkinsus sp. infecting mangrove oysters Crassostrea rhizophorae from the Brazilian coast. Dis Aquat Organ 2009; 88(1): 13-23. PMid:20183961. http://dx.doi.org/10.3354/dao02136.
http://dx.doi.org/10.3354/dao02136...
) were used as controls for the PCR and PCR-RFLP analyses.
To identify the species of Crassostrea, PCR reactions were performed as previously described (DA SILVA et al., 2013Da Silva PM, Vianna RT, Guertler C, Ferreira LP, Santana LN, Fernández-Boo S, et al. First report of the protozoan parasite Perkinsus marinus in South America, infecting mangrove oysters Crassostrea rhizophorae from the Paraíba River (NE, Brazil). J Invertebr Pathol 2013; 113(1): 96-103. PMid:23439264. http://dx.doi.org/10.1016/j.jip.2013.02.002.
http://dx.doi.org/10.1016/j.jip.2013.02....
). The primer pairs (16SAR - 16SBR) were used to amplify a region of the mitochondrial DNA of the large subunit of ribosomal RNA (16S). DNA samples of C. gasar, C. rhizophorae and C. gigas oysters were used as controls for the PCR and PCR-RFLP analyses.
For both PCRs, the reactions were done in a total volume of 25 µl, containing 1 µl of genomic DNA (50 ng), buffer at 1x concentration, MgCl2 at 1.5 mM, 0.2 mM nucleotides, 0.4 µM of primers, and 0.04 U/µl of Taq DNA polymerase (Invitrogen, Brazil). PCR products were electrophoresed on 1.5% agarose gels, stained with ethidium bromide, and visualized by UV illumination.
Restriction Fragment Length Polymorphism (RFLP) analysis
The freshly amplified ITS region of Perkinsus rDNA from DNA samples of 25 Perkinsus-infected oysters (Table 1) and control DNA samples (P. olseni, P. marinus, P. beihaiensis) were digested with the enzyme HinfI (ABOLLO et al., 2006Abollo E, Casas SM, Ceschia G, Villalba A. Differential diagnosis of Perkinsus species by polymerase chain reaction-restriction fragment length polymorphism assay. Mol Cell Probes 2006; 20(6): 323-329. PMid:16846717. http://dx.doi.org/10.1016/j.mcp.2006.04.001.
http://dx.doi.org/10.1016/j.mcp.2006.04....
; QUEIROGA et al., 2015Queiroga FR, Vianna RT, Vieira CB, Farias ND, Da Silva PM. Parasites infecting the cultured oyster Crassostrea gasar (Adanson, 1757) in Northeast Brazil. Parasitology 2015; 142(6): 756-766. PMid:25553815. http://dx.doi.org/10.1017/S0031182014001863.
http://dx.doi.org/10.1017/S0031182014001...
) following the manufacturer’s protocols (Fermentas, Brazil). Similarly, PCR–RFLP analysis was performed to identify oyster species among 25 Perkinsus sp.-infected oysters and 13 uninfected individuals from all sampling dates and color patterns, including white (18) and dark-gray (20) (Table 1). The freshly amplified 16S mtDNA products were digested with the enzyme AluI (Fermentas, Brazil) (DA SILVA et al., 2013Da Silva PM, Vianna RT, Guertler C, Ferreira LP, Santana LN, Fernández-Boo S, et al. First report of the protozoan parasite Perkinsus marinus in South America, infecting mangrove oysters Crassostrea rhizophorae from the Paraíba River (NE, Brazil). J Invertebr Pathol 2013; 113(1): 96-103. PMid:23439264. http://dx.doi.org/10.1016/j.jip.2013.02.002.
http://dx.doi.org/10.1016/j.jip.2013.02....
). Restriction patterns were compared with those obtained from the control species (Perkinsus spp. and Crassostrea spp.). Ten microliters of digestion products were resolved on an 8% polyacrylamide gel and then stained with ethidium bromide.
DNA sequencing and phylogenetic analyses
The freshly amplified ITS region of Perkinsus rDNA and Crassostrea 16S mtDNA from 12 DNA samples each (Table 1) were sequenced by ACTGene Análises Moleculares Ltda. (Centro de Biotecnologia, UFRGS, Porto Alegre, RS, Brazil) using the automatic sequencer ABI-PRISM 3100 Genetic Analyzer (Applied Biosystems). Samples were prepared following the protocol recommended by the manufacturer.
Sequences of rDNA-ITS of Perkinsus and 16S mtDNA of Crassostrea were aligned using ClustalW (THOMPSON et al., 1994Thompson JD, Higgins DG, Gibson TJ. CLUSTAL W: improving the sensitivity of progressive multiple sequence alignment through sequence weighting, position-specific gap penalties and weight matrix choice. Nucleic Acids Res 1994; 22(22): 4673-4680. PMid:7984417. http://dx.doi.org/10.1093/nar/22.22.4673.
http://dx.doi.org/10.1093/nar/22.22.4673...
) in BioEdit 5.0.9 (HALL, 1999Hall T. BioEdit: a user-friendly biological sequence alignment editor and analysis program for Windows 95/98/NT. Nucleic Acids Symp Ser 1999; 41: 95-98.). Parsimony bootstrap analyses were done with MEGA 7.0 (KUMAR et al., 2016Kumar S, Stecher G, Tamura K. MEGA7: molecular evolutionary genetics analysis version 7.0 for bigger dataset. Mol Biol Evol 2016; 33(7): 1870-1874. PMid:27004904. http://dx.doi.org/10.1093/molbev/msw054.
http://dx.doi.org/10.1093/molbev/msw054...
) with 100 random additions of 1,000 replicates. Bootstrap support values above 50% (Perkinsus) and 70% (Crassostrea) were calculated. The ITS tree was rooted with the P. qugwadi ITS-region sequence (GenBank no. AF151528), and the 16S mtDNA tree was rooted with Saccostrea glomerata (GenBank no. AF458911) and Ostrea edulis (GenBank no. JF808187). The nucleotide sequences reported in this paper are available in GenBank under the accession numbers MF595808 – MF595812 (P. beihaiensis); MF595813 – MF595819 (P. marinus); MF663010 – MF663016 (C. gasar); MF663017 – MF663018 (C. gigas) and MF663019 – MF663025 (C. rhizophorae).
Results
Oyster growth and mortality
The oysters were cultivated for 7 months. The initial mean length and weight of the spats were 28.7 ± 1.06 mm and 4.1 ± 0.44 g, respectively. Oysters grew from July to October; although they continued to grow in length, their weight decreased from October (73.8 ± 4.92 g) to December (34.8 ± 1.55 g). At the end of the growing period, the oysters reached a mean length of 69.0 ± 1.07 mm and weight of 50.0 ± 1.68 g (Figure 2). This growth corresponded to an average monthly growth of 5.8 mm and 6.6 g. Regarding the oysters with different color patterns, the dark-gray oysters grew significantly (P<0.05) larger (70.0 ± 1.17 mm and 51.9 ± 1.76 g) than the white oysters (64.2 ± 2.30 mm and 43.1 ± 4.16 g).

Mean length (mm) and whole weight (g) of oysters. Oysters were sampled in duplicates (n = 50) or quadruplicates (n = 25), totalizing 100 oysters per month.
The highest monthly mortality rate was in September, two months following deployment. The cumulative mortality at the end of the study was 43.6%. The white oysters showed a higher cumulative mortality (52.4%) than the dark-gray oysters (34.8%) (Figure 3).

Total cumulative mortality of the oysters (%) and by oyster shell color (white and dark-gray). Mortality was estimated in duplicates (n = 50) or quadruplicates (n = 25), totalizing 100 oysters per month.
Incidence of Perkinsus spp. during on growing
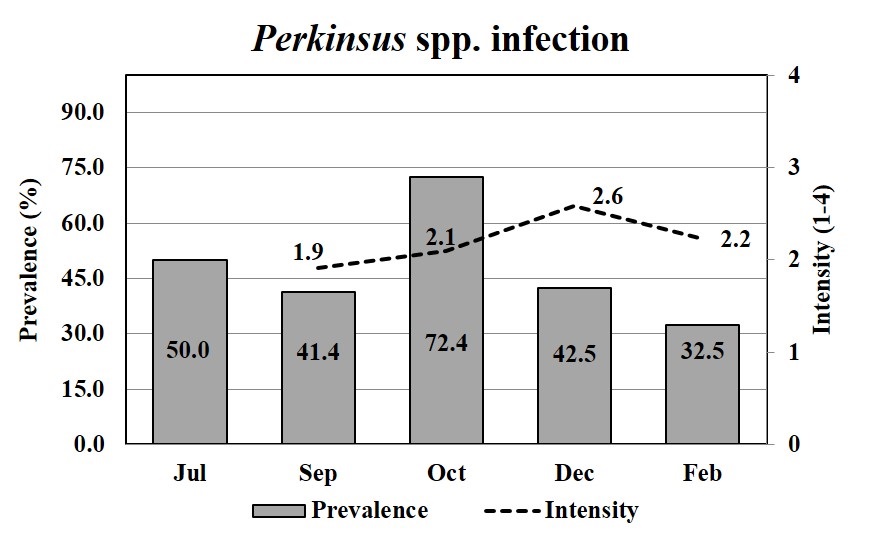
The mean prevalence of Perkinsus spp. was moderate (47.8%) during the growing period, except in October when it increased to 72.4% (Figure 4). The mean intensity of the Perkinsus sp. was 2.2, which corresponded to a light intensity over a 4-point scale. The prevalence of Perkinsus spp. infecting oysters (spats), in July, which was estimated by PCR, was 50% (Figure 4). The smallest infected oyster was 19.4 mm.
The prevalence of Perkinsus spp. (bar) and mean infection intensities (line) in Crassostrea spp. oysters through oyster growth. Oysters were analyzed by RFTM in duplicates (15) or quadruplicates (10), totalizing 30 or 40 oysters per month; except in July, when oysters (n = 12) were analyzed by PCRs.
The incidence of Perkinsus spp. in oysters according to shell color was determined. The white oysters were more affected by perkinsosis (19 from 34, 55.9%) than dark-gray oysters (50 from 116, 43.1%).
Identification of Crassostrea oysters by PCR-RFLP
Thirty-eight oysters with distinct shell color patterns (18 white and 20 dark-gray) were collected throughout the study period and analyzed by PCR-RFLP in order to identify the oyster species (Table 1).
Two distinct fragmentation patterns of the 16S mtDNA using the endonuclease AluI were obtained (Table 2). In 24 oysters, the digestion produced one large fragment of ∼250 bp and a group of unresolved fragments smaller than 100 bp, corresponding to C. gasar. Of these, 18 were dark-gray oysters (90%) (Table 2). In 14 oysters, the restrictive pattern showed one large fragment with slightly more than 400 bp and a group of unresolved fragments of less than 100 bp, corresponding to C. rhizophorae. Of these, 12 were white oysters (66.7%) (Table 2).
Susceptibility of Crassostrea spp. to Perkinsus spp.
Twenty-five oysters collected throughout the study period were analyzed by PCR-RFLP in order to identify the parasite and the host species in the same sample (Table 1).
Two distinct rDNA ITS fragmentation patterns were obtained with HinfI, which corresponded to P. marinus and P. beihaiensis (Table 3). Eleven samples showed the P. marinus pattern, which was four fragments of approximately 365, 150, 98 and 56 bp. Seven samples showed the P. beihaiensis pattern, which was a group of four fragments with the sizes ranging from 100 to 200 bp (quadruplet) and one smaller than ∼10 bp. Seven oysters shared both patterns, indicating dual-infection (Table 3). P. marinus infected more C. rhizophorae, while P. beihaiensis infected more C. gasar oysters (Table 3).
Identification of parasite species by PCR-RFLP in relation to the oyster species. Percentages were calculated considering the rows (Perkinsus spp.) or (/) columns (Crassostrea spp.).
The intensity of infection according to the Perkinsus spp. was also determined. The results indicated that P. marinus seems to have a greater capacity to proliferate and reach heavier infection intensities (56%) in the host than P. beihaiensis (13.9%) (Table 4).
Identification of parasite species by PCR-RFLP in relation with the parasite burden on the host.
The smallest white and dark-gray infected oysters had shell heights of 19.4 mm and 25.6 mm, respectively.
Phylogenetic analysis
The results of the 16S mtDNA phylogenetic analyses of the 12 Crassostrea spp. and the ITS sequences of the 12 Perkinsus spp. obtained during this study were 100% coincident with the species identifications from the PCR-RFLP analyses, since the sequences were grouped into monophyletic clades. C. rhizophorae and C. gasar had bootstrap support values of 96% and 99%, respectively (Figure 5) and P. marinus and P. beihaiensis had bootstrap support values of 99% and 90%, respectively (Figure 6).

Phylogram showing the results of the maximum parsimony analyses on Crassostrea spp. 16S mtDNA sequences. Bootstrap support values are indicated at the nodes. Sequences from this study are indicated by GenBank accession number (in bold). Sequences MF663016 (C. gasar), MF663025 (C. rhizophorae) and MF663017 - MF663018 (C. gigas from Santa Catarina State) were the controls used for PCR-RFLP.

Phylogram showing the results of the maximum parsimony analyses on Perkinsus spp. ITS region sequences. Bootstrap support values are indicated at the nodes. Sequences from this study are indicated by GenBank accession number (in bold).
Discussion
The present study evaluated, for the first time, the impact of perkinsosis on the productive traits of Crassostrea spp. oysters cultured in Brazil as well as the susceptibility of two native oyster species, C. rhizophorae and C. gasar to P. beihaiensis and P. marinus infection.
Comparison of the productive traits among the native oyster population cultivated in Brazil is a challenge because of the wide differences in experimental conditions employed, including the spats origins (mangrove or hatchery), starting spats size, time of culture, culture methods, and geographical location. Oysters from the present study showed a similar growth rate (5.8 mm and 6.6 g per month) compared to C. gasar oysters grown in shrimp ponds in the neighboring state of Rio Grande do Norte (5.2 mm per month) (DA SILVA et al., 2016Da Silva PM, Costa CP, Araújo JPB, Queiroga FR, Wainberg AA. Epizootiology of Perkinsus sp. in Crassostrea gasar oysters in polyculture with shrimps in northeastern Brazil. Rev Bras Parasitol Vet 2016; 25(1): 37-45. PMid:27007244. http://dx.doi.org/10.1590/S1984-29612016011.
http://dx.doi.org/10.1590/S1984-29612016...
). Moreover, the growth rate was better than oysters growing in shrimp ponds in the Sergipe state (2.37 mm per month) (ROSA, 2014Rosa LC. Crescimento e sobrevivência da ostra Crassostrea brasiliana (Lamarck, 1819) mantida em um viveiro de cultivo de camarão. Arq Ciênc 2014; 47(1): 64-68.) as well as in the marine and estuarine environments of South Brazil using spats produced in a hatchery facility (LOPES et al., 2013Lopes GR, Gomes CHAM, Tureck CR, Melo CMR. Growth of Crassostrea gasar cultured in marine and estuary environments in Brazilian waters. Pesq Agropecu Bras 2013; 48(8): 975-982. http://dx.doi.org/10.1590/S0100-204X2013000800024.
http://dx.doi.org/10.1590/S0100-204X2013...
; PEREIRA et al., 2001Pereira OM, Machado IC, Henriques MB, Yamanaka N. Crescimento da ostra Crassostrea brasiliana semeada sobre tabuleiro em diferentes densidades na região estuarino-lagunar de Cananéia-SP (25ºS, 48ºW). B Inst Pesca 2001; 27(2): 163-174.). The latter authors reported oyster growth rates of 2.6 mm, 3.1 mm and 3.9 g per month.
A decrease of the mean whole weight observed in December and February compared with October could be related to spawning events, which caused an important decrease in body weight, as already described in C. rhizophorae from Brazil (NASCIMENTO & PEREIRA, 1980Nascimento IA, Pereira SA. Changes in the condition index for mangrove oysters (Crassostrea rhizophorae) from Todos os Santos Bay, Salvador, Brazil. Aquaculture 1980; 20(1): 9-15. http://dx.doi.org/10.1016/0044-8486(80)90057-5.
http://dx.doi.org/10.1016/0044-8486(80)9...
; REBELO et al., 2005Rebelo MF, Amaral MCR, Pfeiffer WC. Oyster condition index in Crassostrea rhizophorae (Guilding, 1828) from a heavy-metal polluted coastal laggon. Braz J Biol 2005; 65(2): 345-351. PMid:16097738. http://dx.doi.org/10.1590/S1519-69842005000200019.
http://dx.doi.org/10.1590/S1519-69842005...
). Cultured C. gasar oysters became mature and present several spawning peaks during most parts of the year (PAIXÃO et al., 2013Paixão L, Ferreira MA, Nunes Z, Fonseca-Sizo F, Rocha R. Effects of salinity and rainfall on the reproductive biology of the mangrove oyster (Crassostrea gasar): Implications for the collection of broodstock oysters. Aquaculture 2013; 380-383: 6-12. http://dx.doi.org/10.1016/j.aquaculture.2012.11.019.
http://dx.doi.org/10.1016/j.aquaculture....
; RAMOS et al., 2014Ramos CO, Gomes CHAM, Magalhães ARM, Santos AI, Melo CMR. Maturation of the mangrove oyster Crassostrea gasar at different temperatures in the laboratory. J Shellfish Res 2014; 33(1): 187-194. http://dx.doi.org/10.2983/035.033.0118.
http://dx.doi.org/10.2983/035.033.0118...
). It is important to consider that the oyster growth data presented here represents the mean of two different oyster species, which were likely pulled down by the species with the worst performance. Indeed, white oysters grew worse than dark-gray oysters.
The mean cumulative mortality observed was moderately high (43.6%) for native Crassostrea spp. oysters produced in Brazil. Studies developed in the south of Brazil (Santa Catarina State) showed low mortality rates (7.5%) when using culture hatchery-reared Crassostrea spp. spats (MACCACCHERO et al., 2007Maccacchero GB, Ferreira JF, Guzenski J. Influence of stocking density and culture management on growth and mortality of the mangrove native oyster Crassostrea sp. in southern Brazil. Biotemas 2007; 20(3): 47-53.) and cumulative mortalities ranged from 10 to 36% when using 50 mm mangrove-obtained spats (PEREIRA et al., 2001Pereira OM, Machado IC, Henriques MB, Yamanaka N. Crescimento da ostra Crassostrea brasiliana semeada sobre tabuleiro em diferentes densidades na região estuarino-lagunar de Cananéia-SP (25ºS, 48ºW). B Inst Pesca 2001; 27(2): 163-174.). Notably, in the present study, white oysters showed higher cumulative mortality (52.4%) than dark-gray oysters (34.8%) under the same culture conditions.
The restriction patterns and the analyzed 16S mtDNA sequences indicated that most white oysters belong to C. rhizophorae species and dark-gray oysters belong to C. gasar species. Therefore, C. gasar showed better performance in culture than C. rhizophorae, reaching larger sizes and showing higher survival. These results corroborate the assumption of producers and suggest that C. rhizophorae is less suitable for culture, demanding, for example, some genetic improvement.
The prevalence of Perkinsus spp. was moderate (45.7%). Although, in October, after three months of culture, when oysters were 48.3 mm long, the prevalence reached the maximum value (72.4%). This high prevalence was not associated with mortality this month (17.8%) because the highest monthly mortality rate (22.5%) was observed in the previous month. In addition, the light infection (level 2) in oyster tissues during the whole culture period did not support the hypothesis that Perkinsus infection caused oyster mortality. A period of high Perkinsus infection intensity commonly precedes or is concomitant with a mortality event (VILLALBA et al., 2011Villalba A, Gestal C, Casas SM, Figueras A. Perkinsosis en moluscos. In: Figueras A, Novoa B. Enfermedades de moluscos bilvalvos de interés en acuicultura. Madrid: Fundación Observatorio Español de Acuicultura; 2011. p. 181-242.).
The present study also highlights that very young oysters were already infected by Perkinsus spp. and that the infection persisted in the population until harvest. These facts suggest that the parasite is well established in the population and that it is a result of the proximity of older, infected oysters that allows parasite transmission (BEN-HORIN et al., 2015Ben-Horin T, Bidegain G, Huey L, Narvaez DA, Bushek D. Parasite transmission through suspension feeding. J Invertebr Pathol 2015; 131: 155-176. PMid:26210495. http://dx.doi.org/10.1016/j.jip.2015.07.006.
http://dx.doi.org/10.1016/j.jip.2015.07....
). Spats (3 - 15 mm) of clams Ruditapes philippinarum also acquired infection with Perkinsus spp. (P. olseni dominant) after immersion challenge with zoospores and suffered a high mortality (SHIMOKAWA et al., 2010Shimokawa J, Yoshinaga T, Ogawa K. Experimental evaluation of the pathogenicity of Perkinsus olseni in juvenile Manila clams Ruditapes philippinarum. J Invertebr Pathol 2010; 105(3): 347-351. PMid:20807538. http://dx.doi.org/10.1016/j.jip.2010.08.007.
http://dx.doi.org/10.1016/j.jip.2010.08....
; WAKI et al., 2012Waki T, Shimokawa J, Watanabe S, Yoshinaga T, Ogawa K. Experimental challenges of wild Manila clams with Perkinsus species isolated from naturally infected wild Manila clams. J Invertebr Pathol 2012; 111(1): 50-55. PMid:22687350. http://dx.doi.org/10.1016/j.jip.2012.05.009.
http://dx.doi.org/10.1016/j.jip.2012.05....
). Concerning P. marinus, infection in C. virginica oysters smaller than 30 mm is rare (BURRESON, 1991Burreson EM. Effects of Perkinsus marinus infection in the Eastern oyster, Crassostrea virginica: I. Susceptibility of native and MSX-resistant stocks. J Shellfish Res 1991; 10(2): 417-423.). The same result was found in Crassostrea corteziensis infected by P. marinus of the Pacific coast of Mexico, whose prevalence was almost insignificant in oysters of 20 – 49 mm (CÁCERES-MARTÍNEZ et al., 2016Cáceres-Martínez J, Madero-López LH, Padilla-Lardizábal G, Vásquez-Yeomans R. Epizootiology of Perkinsus marinus, parasite of the pleasure oyster Crassostrea corteziensis, in the Pacific coast of Mexico. J Invertebr Pathol 2016; 139: 12-18. PMid:27403560. http://dx.doi.org/10.1016/j.jip.2016.07.003.
http://dx.doi.org/10.1016/j.jip.2016.07....
). Our results are in contrast with the latter results because 50% of oysters in our study were already infected with 29 mm (July spats). Moreover, the present result does not support the hypothesis that larger and older oysters are more infected because of their higher filtration rate and consequently higher parasite acquisition (BURRESON & RAGONE-CALVO, 1996Burreson EM, Ragone-Calvo LM. Epizootiology of Perkinsus marinus disease of oysters in Chesapeake Bay, with emphasis on data since 1985. J Shellfish Res 1996; 15(1): 17-34.; CÁCERES-MARTÍNEZ et al., 2016Cáceres-Martínez J, Madero-López LH, Padilla-Lardizábal G, Vásquez-Yeomans R. Epizootiology of Perkinsus marinus, parasite of the pleasure oyster Crassostrea corteziensis, in the Pacific coast of Mexico. J Invertebr Pathol 2016; 139: 12-18. PMid:27403560. http://dx.doi.org/10.1016/j.jip.2016.07.003.
http://dx.doi.org/10.1016/j.jip.2016.07....
; VILLALBA et al., 2005Villalba A, Casas SM, López C, Carballal MJ. Study of perkinsosis in the carpet shell clam Tapes decussatus in Galicia (NW Spain). II. Temporal pattern of disease dynamics and association with clam mortality. Dis Aquat Organ 2005; 65(3): 257-267. PMid:16119895. http://dx.doi.org/10.3354/dao065257.
http://dx.doi.org/10.3354/dao065257...
).
The restriction patterns and analyzed ITS sequences identified two Perkinsus species (P. marinus and P. beihaiensis). This result allowed study of the differential susceptibility of Brazilian sympatric oysters to Perkinsus spp. infection. Interestingly, C. rhizophorae seemed to be more susceptible (55.9%) to Perkinsus spp. infection than C. gasar (43.1%). Herein, we put in evidence that C. rhizophorae is more affected by P. marinus, whose proliferation seemed to be more favored because more cases of heavy intensities were found. In turn, C. gasar is more likely to be infected by P. beihaiensis, whose proliferation seems to be more limited because fewer cases reached heavy intensities. Queiroga et al. (2015)Queiroga FR, Vianna RT, Vieira CB, Farias ND, Da Silva PM. Parasites infecting the cultured oyster Crassostrea gasar (Adanson, 1757) in Northeast Brazil. Parasitology 2015; 142(6): 756-766. PMid:25553815. http://dx.doi.org/10.1017/S0031182014001863.
http://dx.doi.org/10.1017/S0031182014001...
found the opposite, that P. beihaiensis reached moderate and heavy intensities in C. gasar, while P. marinus seemed to be more limited. These results suggest that, when two susceptible host species are present, the progression of the two Perkinsus species can be modified in order to favor parasite progression in the most susceptible oyster species. Despite the knowledge that P. marinus causes outbreaks in C. virginica oysters from the East Coast of the USA (BURRESON & RAGONE-CALVO, 1996Burreson EM, Ragone-Calvo LM. Epizootiology of Perkinsus marinus disease of oysters in Chesapeake Bay, with emphasis on data since 1985. J Shellfish Res 1996; 15(1): 17-34.), P. marinus was not associated with mortality in other susceptible oyster species (Crassostrea and Saccostrea) (CÁCERES-MARTÍNEZ et al., 2010Cáceres-Martínez J, Vásquez-Yeomans R, Padilla-Lardizábal G. Parasites of the pleasure oyster Crassostrea corteziensis cultured in Nayarit, Mexico. J Aquat Anim Health 2010; 22(3): 141-151. PMid:21192543. http://dx.doi.org/10.1577/H09-052.1.
http://dx.doi.org/10.1577/H09-052.1...
, 2012Cáceres-Martínez J, Ortega MG, Vásquez-Yeomans R, García TJP, Stokes NA, Carnegie RB. Natural and cultured populations of the mangrove oyster Saccostrea palmula from Sinaloa, Mexico, infected by Perkinsus marinus. J Invertebr Pathol 2012; 110(3): 321-325. PMid:22465628. http://dx.doi.org/10.1016/j.jip.2012.03.019.
http://dx.doi.org/10.1016/j.jip.2012.03....
, 2016Cáceres-Martínez J, Madero-López LH, Padilla-Lardizábal G, Vásquez-Yeomans R. Epizootiology of Perkinsus marinus, parasite of the pleasure oyster Crassostrea corteziensis, in the Pacific coast of Mexico. J Invertebr Pathol 2016; 139: 12-18. PMid:27403560. http://dx.doi.org/10.1016/j.jip.2016.07.003.
http://dx.doi.org/10.1016/j.jip.2016.07....
; MOSS et al., 2008Moss JA, Xiao J, Dungan CF, Reece KS. Description of Perkinsus beihaiensis n. sp., a new Perkinsus sp. parasite in oysters of Southern China. J Eukaryot Microbiol 2008; 55(2): 117-130. PMid:18318865. http://dx.doi.org/10.1111/j.1550-7408.2008.00314.x.
http://dx.doi.org/10.1111/j.1550-7408.20...
).
In contrast, the pathogenicity of P. beihaiensis is poorly studied. Moss et al. (2008)Moss JA, Xiao J, Dungan CF, Reece KS. Description of Perkinsus beihaiensis n. sp., a new Perkinsus sp. parasite in oysters of Southern China. J Eukaryot Microbiol 2008; 55(2): 117-130. PMid:18318865. http://dx.doi.org/10.1111/j.1550-7408.2008.00314.x.
http://dx.doi.org/10.1111/j.1550-7408.20...
noted some histopathological effects of P. beihaiensis in the digestive system (stomach, intestine and digestive gland) of Crassostrea hongkongensis from China, including cases of moribund oysters with heavy infections. Similar symptoms were observed in C. rhizophorae (SABRY et al., 2009Sabry RC, Rosa RD, Magalhães ARM, Barracco MA, Gesteira TCV, Da Silva PM. First report of Perkinsus sp. infecting mangrove oysters Crassostrea rhizophorae from the Brazilian coast. Dis Aquat Organ 2009; 88(1): 13-23. PMid:20183961. http://dx.doi.org/10.3354/dao02136.
http://dx.doi.org/10.3354/dao02136...
) and C. gasar (QUEIROGA et al., 2015Queiroga FR, Vianna RT, Vieira CB, Farias ND, Da Silva PM. Parasites infecting the cultured oyster Crassostrea gasar (Adanson, 1757) in Northeast Brazil. Parasitology 2015; 142(6): 756-766. PMid:25553815. http://dx.doi.org/10.1017/S0031182014001863.
http://dx.doi.org/10.1017/S0031182014001...
) from Brazil. In contrast, Sanil et al. (2012)Sanil NK, Suja G, Lijo J, Vijayan KK. First report of Perkinsus beihaiensis in Crassostrea madrasensis from the Indian subcontinent. Dis Aquat Organ 2012; 98(3): 209-220. PMid:22535871. http://dx.doi.org/10.3354/dao02440.
http://dx.doi.org/10.3354/dao02440...
reported some digestive tubule lesions in Crassostrea madrasensis, but these lesions were not directly associated with P. beihaiensis.
In Brazil, a natural population of C. rhizophorae oysters (State of Paraiba, NE Brazil) is dramatically affected (prevalence up 100% and moderate intensities, level 3) by P. marinus (DA SILVA et al., 2013Da Silva PM, Vianna RT, Guertler C, Ferreira LP, Santana LN, Fernández-Boo S, et al. First report of the protozoan parasite Perkinsus marinus in South America, infecting mangrove oysters Crassostrea rhizophorae from the Paraíba River (NE, Brazil). J Invertebr Pathol 2013; 113(1): 96-103. PMid:23439264. http://dx.doi.org/10.1016/j.jip.2013.02.002.
http://dx.doi.org/10.1016/j.jip.2013.02....
). This oyster species is also susceptible to P. beihaiensis, with very low prevalence (not exceeding 10%) and mostly light intensities (DANTAS-NETO et al., 2015Dantas-Neto MP, Sabry RC, Ferreira LP, Romão LS, Maggioni R. Perkinsus sp. infecting the oyster Crassostrea rhizophorae from estuaries of the septentrional Northeast, Brazil. Braz J Biol 2015; 75(4): 1030-1034. PMid:26675922. http://dx.doi.org/10.1590/1519-6984.06314.
http://dx.doi.org/10.1590/1519-6984.0631...
; SABRY et al., 2009Sabry RC, Rosa RD, Magalhães ARM, Barracco MA, Gesteira TCV, Da Silva PM. First report of Perkinsus sp. infecting mangrove oysters Crassostrea rhizophorae from the Brazilian coast. Dis Aquat Organ 2009; 88(1): 13-23. PMid:20183961. http://dx.doi.org/10.3354/dao02136.
http://dx.doi.org/10.3354/dao02136...
, 2013Sabry RC, Gesteira TCV, Magalhães ARM, Barracco MA, Guertler C, Ferreira LP, et al. Parasitological survey of mangrove oyster, Crassostrea rhizophorae, in the Pacoti River Estuary, Ceará State, Brazil. J Invertebr Pathol 2013; 112(1): 24-32. PMid:23147104. http://dx.doi.org/10.1016/j.jip.2012.10.004.
http://dx.doi.org/10.1016/j.jip.2012.10....
).
In conclusion, the occurrence of some variability in productive traits and Perkinsus spp. susceptibility between native oyster species was demonstrated. One oyster species, i.e., C. gasar, on average, showed a significantly better performance through growth. Perkinsosis did not cause mortality in any stage of oyster culture. The results obtained with the best-performing oyster species suggest that even under perkinsosis pressure and premature infection, farming in northeast Brazil is feasible and can be profitable using appropriate oyster spats and species.
Acknowledgements
This research received financial support from CNPq (474976/2011-4), CNPq/MPA (406170/2012-6) and CAPES (CIMAR 2202/2014). We are also grateful to the oyster producer Miguel Ferreira dos Santos.
References
- Abollo E, Casas SM, Ceschia G, Villalba A. Differential diagnosis of Perkinsus species by polymerase chain reaction-restriction fragment length polymorphism assay. Mol Cell Probes 2006; 20(6): 323-329. PMid:16846717. http://dx.doi.org/10.1016/j.mcp.2006.04.001
» http://dx.doi.org/10.1016/j.mcp.2006.04.001 - Absher TM. Populações naturais de ostras do gênero Crassostrea do litoral do Paraná—Desenvolvimento larval, recrutamento e crescimento [thesis]. São Paulo: Universidade de São Paulo; 1989.
- Ben-Horin T, Bidegain G, Huey L, Narvaez DA, Bushek D. Parasite transmission through suspension feeding. J Invertebr Pathol 2015; 131: 155-176. PMid:26210495. http://dx.doi.org/10.1016/j.jip.2015.07.006
» http://dx.doi.org/10.1016/j.jip.2015.07.006 - Burreson EM. Effects of Perkinsus marinus infection in the Eastern oyster, Crassostrea virginica: I. Susceptibility of native and MSX-resistant stocks. J Shellfish Res 1991; 10(2): 417-423.
- Burreson EM, Ragone-Calvo LM. Epizootiology of Perkinsus marinus disease of oysters in Chesapeake Bay, with emphasis on data since 1985. J Shellfish Res 1996; 15(1): 17-34.
- Bush AO, Lafferty KD, Lotz JM, Shostak AW. Parasitology meets ecology on its own terms: Margolis et al. revisited. J Parasitol 1997; 83(4): 575-583. PMid:9267395. http://dx.doi.org/10.2307/3284227
» http://dx.doi.org/10.2307/3284227 - Cáceres-Martínez J, Madero-López LH, Padilla-Lardizábal G, Vásquez-Yeomans R. Epizootiology of Perkinsus marinus, parasite of the pleasure oyster Crassostrea corteziensis, in the Pacific coast of Mexico. J Invertebr Pathol 2016; 139: 12-18. PMid:27403560. http://dx.doi.org/10.1016/j.jip.2016.07.003
» http://dx.doi.org/10.1016/j.jip.2016.07.003 - Cáceres-Martínez J, Ortega MG, Vásquez-Yeomans R, García TJP, Stokes NA, Carnegie RB. Natural and cultured populations of the mangrove oyster Saccostrea palmula from Sinaloa, Mexico, infected by Perkinsus marinus. J Invertebr Pathol 2012; 110(3): 321-325. PMid:22465628. http://dx.doi.org/10.1016/j.jip.2012.03.019
» http://dx.doi.org/10.1016/j.jip.2012.03.019 - Cáceres-Martínez J, Vásquez-Yeomans R, Padilla-Lardizábal G. Parasites of the pleasure oyster Crassostrea corteziensis cultured in Nayarit, Mexico. J Aquat Anim Health 2010; 22(3): 141-151. PMid:21192543. http://dx.doi.org/10.1577/H09-052.1
» http://dx.doi.org/10.1577/H09-052.1 - Casas SM, La Peyre JF, Reece KS, Azevedo C, Villalba A. Continuous in vitro culture of the carpet shell clam Tapes decussatus protozoan parasite Perkinsus atlanticus. Dis Aquat Organ 2002; 52(3): 217-231. PMid:12553450. http://dx.doi.org/10.3354/dao052217
» http://dx.doi.org/10.3354/dao052217 - Da Silva PM, Costa CP, Araújo JPB, Queiroga FR, Wainberg AA. Epizootiology of Perkinsus sp. in Crassostrea gasar oysters in polyculture with shrimps in northeastern Brazil. Rev Bras Parasitol Vet 2016; 25(1): 37-45. PMid:27007244. http://dx.doi.org/10.1590/S1984-29612016011
» http://dx.doi.org/10.1590/S1984-29612016011 - Da Silva PM, Scardua MP, Vianna RT, Mendonça RC, Vieira CB, Dungan CF, et al. Two Perkinsus spp. infect Crassostrea gasar oysters from cultured and wild populations of the Rio São Francisco estuary, Sergipe, northeastern Brazil. J Invertebr Pathol 2014; 119: 62-71. PMid:24780219. http://dx.doi.org/10.1016/j.jip.2014.04.005
» http://dx.doi.org/10.1016/j.jip.2014.04.005 - Da Silva PM, Vianna RT, Guertler C, Ferreira LP, Santana LN, Fernández-Boo S, et al. First report of the protozoan parasite Perkinsus marinus in South America, infecting mangrove oysters Crassostrea rhizophorae from the Paraíba River (NE, Brazil). J Invertebr Pathol 2013; 113(1): 96-103. PMid:23439264. http://dx.doi.org/10.1016/j.jip.2013.02.002
» http://dx.doi.org/10.1016/j.jip.2013.02.002 - Dantas-Neto MP, Sabry RC, Ferreira LP, Romão LS, Maggioni R. Perkinsus sp. infecting the oyster Crassostrea rhizophorae from estuaries of the septentrional Northeast, Brazil. Braz J Biol 2015; 75(4): 1030-1034. PMid:26675922. http://dx.doi.org/10.1590/1519-6984.06314
» http://dx.doi.org/10.1590/1519-6984.06314 - Ferreira LP, Sabry RC, Da Silva PM, Gesteira TCV, Romão LS, Paz MP, et al. First report of Perkinsus beihaiensis in wild clams Anomalocardia brasiliana (Bivalvia: Veneridae) in Brazil. Exp Parasitol 2015; 150: 67-70. PMid:25088443. http://dx.doi.org/10.1016/j.exppara.2014.07.012
» http://dx.doi.org/10.1016/j.exppara.2014.07.012 - Hall T. BioEdit: a user-friendly biological sequence alignment editor and analysis program for Windows 95/98/NT. Nucleic Acids Symp Ser 1999; 41: 95-98.
- Kumar S, Stecher G, Tamura K. MEGA7: molecular evolutionary genetics analysis version 7.0 for bigger dataset. Mol Biol Evol 2016; 33(7): 1870-1874. PMid:27004904. http://dx.doi.org/10.1093/molbev/msw054
» http://dx.doi.org/10.1093/molbev/msw054 - Lapègue S, Boutet I, Leitão A, Heurtebise S, Garcia P, Thiriot-Quiévreux C, et al. Trans-Atlantic distribution of a mangrove oyster species revealed by 16S mtDNA and karyological analyses. Biol Bull 2002; 202(3): 232-242. PMid:12086994. http://dx.doi.org/10.2307/1543473
» http://dx.doi.org/10.2307/1543473 - Lazoski C, Gusmão J, Boudry P, Solé-Cava AM. Phylogeny and phylogeography of Atlantic oyster species: Evolutionary history, limited genetic connectivity and isolation by distance. Mar Ecol Prog Ser 2011; 426: 197-212. http://dx.doi.org/10.3354/meps09035
» http://dx.doi.org/10.3354/meps09035 - Lopes GR, Gomes CHAM, Tureck CR, Melo CMR. Growth of Crassostrea gasar cultured in marine and estuary environments in Brazilian waters. Pesq Agropecu Bras 2013; 48(8): 975-982. http://dx.doi.org/10.1590/S0100-204X2013000800024
» http://dx.doi.org/10.1590/S0100-204X2013000800024 - Luz MSA, Boehs G. Perkinsus beihaiensis infectando a ostra Crassostrea rhizophorae em cultivo e em estoque natural na Baía de Camamu, Bahia, Brasil. Braz J Vet Res Anim Sci 2016; 53(2): 191-198. http://dx.doi.org/10.11606/issn.1678-4456.v53i2p191-198
» http://dx.doi.org/10.11606/issn.1678-4456.v53i2p191-198 - Maccacchero GB, Ferreira JF, Guzenski J. Influence of stocking density and culture management on growth and mortality of the mangrove native oyster Crassostrea sp. in southern Brazil. Biotemas 2007; 20(3): 47-53.
- Mackin J. Oyster disease caused by Dermocystidium marinum and other microorganisms in Louisiana. Publ Inst Mar Sci 1962; 7: 132-299.
- Moss JA, Xiao J, Dungan CF, Reece KS. Description of Perkinsus beihaiensis n. sp., a new Perkinsus sp. parasite in oysters of Southern China. J Eukaryot Microbiol 2008; 55(2): 117-130. PMid:18318865. http://dx.doi.org/10.1111/j.1550-7408.2008.00314.x
» http://dx.doi.org/10.1111/j.1550-7408.2008.00314.x - Nascimento IA, Pereira SA. Changes in the condition index for mangrove oysters (Crassostrea rhizophorae) from Todos os Santos Bay, Salvador, Brazil. Aquaculture 1980; 20(1): 9-15. http://dx.doi.org/10.1016/0044-8486(80)90057-5
» http://dx.doi.org/10.1016/0044-8486(80)90057-5 - Paixão L, Ferreira MA, Nunes Z, Fonseca-Sizo F, Rocha R. Effects of salinity and rainfall on the reproductive biology of the mangrove oyster (Crassostrea gasar): Implications for the collection of broodstock oysters. Aquaculture 2013; 380-383: 6-12. http://dx.doi.org/10.1016/j.aquaculture.2012.11.019
» http://dx.doi.org/10.1016/j.aquaculture.2012.11.019 - Pereira OM, Machado IC, Henriques MB, Yamanaka N. Crescimento da ostra Crassostrea brasiliana semeada sobre tabuleiro em diferentes densidades na região estuarino-lagunar de Cananéia-SP (25ºS, 48ºW). B Inst Pesca 2001; 27(2): 163-174.
- Poli CR. Cultivo de ostras do Pacífico. In: Poli CR, Poli AT, Andreatta E, Beltrame EC. Aquicultura: experiências brasileiras Florianópolis: Multitarefa; 2004. p. 251-266.
- Queiroga FR, Marques-Santos LF, Hégaret H, Soudant P, Farias ND, Schlindwein AD, et al. Immunological responses of the mangrove oysters Crassostrea gasar naturally infected by Perkinsus sp. in the Mamanguape Estuary, Paraíba state (Northeastern, Brazil). Fish Shellfish Immunol 2013; 35(2): 319-327. PMid:23664909. http://dx.doi.org/10.1016/j.fsi.2013.04.034
» http://dx.doi.org/10.1016/j.fsi.2013.04.034 - Queiroga FR, Vianna RT, Vieira CB, Farias ND, Da Silva PM. Parasites infecting the cultured oyster Crassostrea gasar (Adanson, 1757) in Northeast Brazil. Parasitology 2015; 142(6): 756-766. PMid:25553815. http://dx.doi.org/10.1017/S0031182014001863
» http://dx.doi.org/10.1017/S0031182014001863 - Ramos CO, Gomes CHAM, Magalhães ARM, Santos AI, Melo CMR. Maturation of the mangrove oyster Crassostrea gasar at different temperatures in the laboratory. J Shellfish Res 2014; 33(1): 187-194. http://dx.doi.org/10.2983/035.033.0118
» http://dx.doi.org/10.2983/035.033.0118 - Ray SM. A review of the culture method of detecting Dermocystidium marinum with suggested modifications and precautions. Proc Nat Shellfish Assoc 1966; 54: 55-69.
- Rebelo MF, Amaral MCR, Pfeiffer WC. Oyster condition index in Crassostrea rhizophorae (Guilding, 1828) from a heavy-metal polluted coastal laggon. Braz J Biol 2005; 65(2): 345-351. PMid:16097738. http://dx.doi.org/10.1590/S1519-69842005000200019
» http://dx.doi.org/10.1590/S1519-69842005000200019 - Rios EC. Compendium of brazilian sea shells Rio Grande: Evangraf; 2009.
- Rosa LC. Crescimento e sobrevivência da ostra Crassostrea brasiliana (Lamarck, 1819) mantida em um viveiro de cultivo de camarão. Arq Ciênc 2014; 47(1): 64-68.
- Sabry RC, Gesteira TCV, Magalhães ARM, Barracco MA, Guertler C, Ferreira LP, et al. Parasitological survey of mangrove oyster, Crassostrea rhizophorae, in the Pacoti River Estuary, Ceará State, Brazil. J Invertebr Pathol 2013; 112(1): 24-32. PMid:23147104. http://dx.doi.org/10.1016/j.jip.2012.10.004
» http://dx.doi.org/10.1016/j.jip.2012.10.004 - Sabry RC, Rosa RD, Magalhães ARM, Barracco MA, Gesteira TCV, Da Silva PM. First report of Perkinsus sp. infecting mangrove oysters Crassostrea rhizophorae from the Brazilian coast. Dis Aquat Organ 2009; 88(1): 13-23. PMid:20183961. http://dx.doi.org/10.3354/dao02136
» http://dx.doi.org/10.3354/dao02136 - Sanil NK, Suja G, Lijo J, Vijayan KK. First report of Perkinsus beihaiensis in Crassostrea madrasensis from the Indian subcontinent. Dis Aquat Organ 2012; 98(3): 209-220. PMid:22535871. http://dx.doi.org/10.3354/dao02440
» http://dx.doi.org/10.3354/dao02440 - Santos AA, Costa SW. Síntese informativa da maricultura. Santa Catarina: EPAGRI; 2015
- Shimokawa J, Yoshinaga T, Ogawa K. Experimental evaluation of the pathogenicity of Perkinsus olseni in juvenile Manila clams Ruditapes philippinarum. J Invertebr Pathol 2010; 105(3): 347-351. PMid:20807538. http://dx.doi.org/10.1016/j.jip.2010.08.007
» http://dx.doi.org/10.1016/j.jip.2010.08.007 - Silveira RC, Silva FC, Gomes CHM, Ferreira JF, Melo CMR. Larval settlement and spat recovery rates of the oyster Crassostrea brasiliana (Lamarck, 1819) using different systems to induce metamorphosis. Braz J Biol 2011; 71(2): 557-562. PMid:21755177. http://dx.doi.org/10.1590/S1519-69842011000300029
» http://dx.doi.org/10.1590/S1519-69842011000300029 - Thompson JD, Higgins DG, Gibson TJ. CLUSTAL W: improving the sensitivity of progressive multiple sequence alignment through sequence weighting, position-specific gap penalties and weight matrix choice. Nucleic Acids Res 1994; 22(22): 4673-4680. PMid:7984417. http://dx.doi.org/10.1093/nar/22.22.4673
» http://dx.doi.org/10.1093/nar/22.22.4673 - Villalba A, Casas SM, López C, Carballal MJ. Study of perkinsosis in the carpet shell clam Tapes decussatus in Galicia (NW Spain). II. Temporal pattern of disease dynamics and association with clam mortality. Dis Aquat Organ 2005; 65(3): 257-267. PMid:16119895. http://dx.doi.org/10.3354/dao065257
» http://dx.doi.org/10.3354/dao065257 - Villalba A, Gestal C, Casas SM, Figueras A. Perkinsosis en moluscos. In: Figueras A, Novoa B. Enfermedades de moluscos bilvalvos de interés en acuicultura Madrid: Fundación Observatorio Español de Acuicultura; 2011. p. 181-242.
- Waki T, Shimokawa J, Watanabe S, Yoshinaga T, Ogawa K. Experimental challenges of wild Manila clams with Perkinsus species isolated from naturally infected wild Manila clams. J Invertebr Pathol 2012; 111(1): 50-55. PMid:22687350. http://dx.doi.org/10.1016/j.jip.2012.05.009
» http://dx.doi.org/10.1016/j.jip.2012.05.009
Publication Dates
-
Publication in this collection
09 Nov 2017 -
Date of issue
Oct-Dec 2017
History
-
Received
18 May 2017 -
Accepted
04 Oct 2017