
Abstract
Babesiosis is an economically important infectious disease affecting cattle worldwide. In order to longitudinally evaluate the humoral immune response against Babesia bovis and the merozoite surface antigen diversity of B. bovis among naturally infected calves in Taiaçu, Brazil, serum and DNA samples from 15 calves were obtained quarterly, from their birth to 12 months of age. Anti-B. bovis IgG antibodies were detected by means of the indirect fluorescent antibody test (IFAT) and enzyme-linked immunosorbent assay (ELISA). The polymerase chain reaction (PCR) was used to investigate the genetic diversity of B. bovis, based on the genes that encode merozoite surface antigens (MSA-1, MSA-2b and MSA-2c). The serological results demonstrated that up to six months of age, all the calves developed active immunity against B. bovis. Among the 75 DNA samples evaluated, 2, 4 and 5 sequences of the genes msa-1, msa-2b and msa-2c were obtained. The present study demonstrated that the msa-1 and msa-2b genes sequences amplified from blood DNA of calves positive to B. bovis from Taiaçu were genetically distinct, and that msa-2c was conserved. All animals were serologically positive to ELISA and IFAT, which used full repertoire of parasite antigens in despite of the genetic diversity of MSAs.
Keywords:
Bovine babesiosis; MSA; genetic diversity; serology
Resumo
A babesiose é uma doença infecciosa economicamente importante que afeta o gado bovino em todo o mundo. Para avaliar longitudinalmente a resposta imune humoral contra B. bovis e a diversidade genética de antígenos de superfície de merozoítos de B. bovis, entre bezerros naturalmente infectados em Taiaçu, Brasil, amostras de soro e DNA de 15 bezerros, foram obtidos trimestralmente, desde o nascimento até aos 12 meses de idade. Os anticorpos IgG para B. bovis foram detectados pelos testes de Imunofluorescência Indireta e Ensaio de Imunoadsorção Enzimático Indireto. A Reação em Cadeia da Polimerase foi utilizada para investigar a diversidade genética de B. bovis, com base em genes que codificam antígenos de superfície de merozoítos (MSA-1, MSA-2b e MSA-2c). Os resultados da sorologia demonstraram que até seis meses de idade todos os bezerros desenvolveram imunidade ativa contra B. bovis. Entre as 75 amostras de DNA avaliadas, foram obtidas 2, 4 e 5 sequências dos genes msa-1, msa-2b e msa-2c. O presente trabalho demonstrou que as sequências dos genes msa-1 e msa-2b amplificadas do DNA do sangue de amostras positivas a B. bovis de bezerros de Taiaçu foram geneticamente distintas, e msa-2c conservadas. Todos os animais foram soropositivos ao ELISA e ao IFAT, os quais utilizaram o repertório completo de antígenos parasitários, apesar da diversidade genética dos MSAs.
Palavras-chave:
Babesiose bovina; MSA; diversidade genética; sorologia
Introduction
Bovine babesiosis is an economically important hemoparasitosis affecting cattle worldwide (MTSHALI & MTSHALI, 2013Mtshali MS, Mtshali PS. Molecular diagnosis and phylogenetic analysis of Babesia bigemina and Babesia bovis hemoparasites from cattle in South Africa. BMC Vet Res 2013; 9(1): 154. PMid:23927555. http://dx.doi.org/10.1186/1746-6148-9-154.
http://dx.doi.org/10.1186/1746-6148-9-15...
). It is transmitted by ticks of the family Ixodidae, especially those belonging to the subgenus Rhipicephalus (Boophilus) spp. (SMITH et al., 2000Smith RD, Evans DE, Martins JR, Ceresér VH, Correa BL, Petraccia C, et al. Babesiosis (Babesia bovis) stability in unstable environments. Ann N Y Acad Sci 2000; 916(1): 510-520. PMid:11193666. http://dx.doi.org/10.1111/j.1749-6632.2000.tb05330.x.
http://dx.doi.org/10.1111/j.1749-6632.20...
). In Brazil, bovine babesiosis is caused by the apicomplexan intraerythrocytic protozoa parasites Babesia bovis and B. bigemina, which are agents of huge economic importance in tropical and subtropical regions (JULIANO et al, 2007Juliano RS, Machado RZ, Fioravanti MCS, Andrade GM, Jayme VS. Soroepidemiologia da babesiose em rebanho de bovinos da raça Curraleiro. Cienc Rural 2007; 37(5): 1387-1392. http://dx.doi.org/10.1590/S0103-84782007000500026.
http://dx.doi.org/10.1590/S0103-84782007...
; SIVAKUMAR et al, 2013Sivakumar T, Okubo K, Igarashi I, Silva WK, Kothalawala H, Silva SSP, et al. Genetic diversity of merozoite surface antigens in Babesia bovis detected from Sri Lankan cattle. Infect Genet Evol 2013; 19: 134-140. PMid:23851021. http://dx.doi.org/10.1016/j.meegid.2013.07.001.
http://dx.doi.org/10.1016/j.meegid.2013....
). Among the agents causing bovine babesiosis, B. bovis is regarded as the most pathogenic species, causing high mortality among susceptible cattle (GAFFAR et al., 2004Gaffar FR, Yatsuda AP, Franssen FF, Vries E. Erythrocyte invasion by Babesia bovis merozoites is inhibited by polyclonal antisera directed against peptides derived from a homologue of Plasmodium falciparum apical membrane antigen 1. Infect Immun 2004; 72(5): 2947-2955. PMid:15102807. http://dx.doi.org/10.1128/IAI.72.5.2947-2955.2004.
http://dx.doi.org/10.1128/IAI.72.5.2947-...
; BROWN et al., 2006Brown WC, Norimine J, Goff WL, Suarez CE, McElwain TF. Prospects for recombinant vaccines against Babesia bovis and related parasites. Parasite Immunol 2006; 28(7): 315-327. PMid:16842268. http://dx.doi.org/10.1111/j.1365-3024.2006.00849.x.
http://dx.doi.org/10.1111/j.1365-3024.20...
).
Cattle that recover from infection with Babesia, either naturally or following chemotherapeutic intervention, generally maintain persistent presence of the parasite, but are protected against the disease if they become reinfected (BOCK et al., 2004Bock RE, Jackson L, De Vos AJ, Jorgensen W. Babesiosis of cattle. Parasitology 2004;129(7 Suppl): S247-S269. PMid:15938514. http://dx.doi.org/10.1017/S0031182004005190.
http://dx.doi.org/10.1017/S0031182004005...
).
Previous studies have shown differences between B. bovis strains with distinct biological characteristics. In particular, genetic and antigenic differences have been observed among merozoite surface antigens (MSAs) of B. bovis isolates in Australia (BERENS et al., 2005Berens SJ, Brayton KA, Molloy JB, Bock RE, Lew AE, McElwain TF. Merozoite surface antigen 2 proteins of Babesia bovis vaccine breakthrough isolates contain a unique hypervariable region composed of degenerate repeats. Infect Immun 2005; 73(11): 7180-7189. PMid:16239512. http://dx.doi.org/10.1128/IAI.73.11.7180-7189.2005.
http://dx.doi.org/10.1128/IAI.73.11.7180...
), Mexico (BORGONIO et al., 2008Borgonio V, Mosqueda J, Genis AD, Falcon A, Alvarez JA, Camacho M, et al. msa-1 and msa-2c gene analysis and common epitopes assessment in Mexican Babesia bovis isolates. Ann N Y Acad Sci 2008; 1149(1): 145-148. PMid:19120194. http://dx.doi.org/10.1196/annals.1428.035.
http://dx.doi.org/10.1196/annals.1428.03...
), Mongolia (ALTANGEREL et al., 2012Altangerel K, Sivakumar T, Battsetseg B, Battur B, Ueno A, Igarashi I, et al. Phylogenetic relationships of Mongolian Babesia bovis isolates based on the merozoite surface antigen (MSA)-1, MSA-2b, and MSA-2c genes. Vet Parasitol 2012; 184(2-4): 309-316. PMid:22004913. http://dx.doi.org/10.1016/j.vetpar.2011.09.021.
http://dx.doi.org/10.1016/j.vetpar.2011....
), Sri Lanka (SIVAKUMAR et al, 2013Sivakumar T, Okubo K, Igarashi I, Silva WK, Kothalawala H, Silva SSP, et al. Genetic diversity of merozoite surface antigens in Babesia bovis detected from Sri Lankan cattle. Infect Genet Evol 2013; 19: 134-140. PMid:23851021. http://dx.doi.org/10.1016/j.meegid.2013.07.001.
http://dx.doi.org/10.1016/j.meegid.2013....
), Thailand (SIMKING et al., 2013Simking P, Saengow S, Bangphoomi K, Sarataphan N, Wongnarkpet S, Inpankaew T, et al. The molecular prevalence and MSA-2b gene-based genetic diversity of Babesia bovis in dairy cattle in Thailand. Vet Parasitol 2013; 197(3-4): 642-648. PMid:23953761. http://dx.doi.org/10.1016/j.vetpar.2013.07.015.
http://dx.doi.org/10.1016/j.vetpar.2013....
), Brazil (NAGANO et al., 2013Nagano D, Sivakumar T, Macedo AC, Inpankaew T, Alhassan A, Igarashi I, et al. The Genetic Diversity of Merozoite Surface Antigen 1 (MSA-1) among Babesia bovis detected from Cattle Populations in Thailand, Brazil and Ghana. J Vet Med Sci 2013; 75(11): 1463-1470. PMid:23856760. http://dx.doi.org/10.1292/jvms.13-0251.
http://dx.doi.org/10.1292/jvms.13-0251...
), Israel (MOLAD et al., 2014Molad T, Fleiderovitz L, Leibovich B, Wolkomirsky R, Erster O, Roth A, et al. Genetic polymorphism of Babesia bovis merozoite surface antigens-2 (MSA-2) isolates from bovine blood and Rhipicephalus annulatus ticks in Israel. Vet Parasitol 2014; 205(1-2): 20-27. PMid:25149097. http://dx.doi.org/10.1016/j.vetpar.2014.07.016.
http://dx.doi.org/10.1016/j.vetpar.2014....
) and the Philippines (TATTIYAPONG et al., 2014Tattiyapong M, Sivakumar T, Ybanez AP, Ybanez RHD, Perez ZO, Guswanto A, et al. Diversity of Babesia bovis merozoite surface antigen genes in the Philippines. Parasitol Int 2014; 63(1): 57-63. PMid:24042058. http://dx.doi.org/10.1016/j.parint.2013.09.003.
http://dx.doi.org/10.1016/j.parint.2013....
). B. bovis merozoites are known to present at least five glycoproteins on their surfaces, which belong to a family of variable merozoite surface antigens (VMSAs) (FLORIN-CHRISTENSEN et al., 2002Florin-Christensen M, Suarez C, Hines SA, Palmer GH, Brown WC, McElwain TF. The Babesia bovis merozoite surface antigen 2 locus contains four tandemly arranged and expressed genes encoding immunologically distinct proteins. Infect Immun 2002; 70(7): 3566-3575. PMid:12065497. http://dx.doi.org/10.1128/IAI.70.7.3566-3575.2002.
http://dx.doi.org/10.1128/IAI.70.7.3566-...
). It has been proposed that members of the VMSA family play key roles in the initial attachment of merozoites and sporozoites in the erythrocyte host cell during invasion into intermediate hosts (MOSQUEDA et al., 2002Mosqueda J, McElwain TF, Palmer GH. Babesia bovis merozoite surface antigen 2 proteins are expressed on the merozoite and sporozoite surface, and specific antibodies inhibit attachment and invasion of erythrocytes. Infect Immun 2002; 70(11): 6448-6455. PMid:12379726. http://dx.doi.org/10.1128/IAI.70.11.6448-6455.2002.
http://dx.doi.org/10.1128/IAI.70.11.6448...
; YOKOYAMA et al., 2006Yokoyama N, Okamura M, Igarashi I. Erythrocyte invasion by Babesia parasites: current advances in the elucidation of the molecular interactions between the protozoan ligands and host receptors in the invasion stage. Vet Parasitol 2006; 138(1-2): 22-32. PMid:16504403. http://dx.doi.org/10.1016/j.vetpar.2006.01.037.
http://dx.doi.org/10.1016/j.vetpar.2006....
).
The VMSA family of B. bovis includes the genes msa-1, msa-2a1, msa-2a2, msa-2b and msa-2c (FLORIN-CHRISTENSEN et al., 2002Florin-Christensen M, Suarez C, Hines SA, Palmer GH, Brown WC, McElwain TF. The Babesia bovis merozoite surface antigen 2 locus contains four tandemly arranged and expressed genes encoding immunologically distinct proteins. Infect Immun 2002; 70(7): 3566-3575. PMid:12065497. http://dx.doi.org/10.1128/IAI.70.7.3566-3575.2002.
http://dx.doi.org/10.1128/IAI.70.7.3566-...
; SUAREZ et al., 2000Suarez CE, Florin-Christensen M, Hines SA, Palmer GH, Brown WC, McElwain TF. Characterization of allelic variation in the Babesia bovis merozoite surface antigen 1 (MSA-1) locus and identification of a cross-reactive inhibition-sensitive MSA-1 epitope. Infect Immun 2000; 68(12): 6865-6870. PMid:11083806. http://dx.doi.org/10.1128/IAI.68.12.6865-6870.2000.
http://dx.doi.org/10.1128/IAI.68.12.6865...
). These antigens are highly immunogenic and contain neutralization-sensitive epitopes (HINES et al., 1992Hines SA, Palmer GH, Jasmer DP, McGuire TC, McElwain TF. Neutralization-sensitive merozoite surface antigens of Babesia bovis encoded by members of a polymorphic gene family. Mol Biochem Parasitol 1992; 55(1-2): 85-94. PMid:1279421. http://dx.doi.org/10.1016/0166-6851(92)90129-8.
http://dx.doi.org/10.1016/0166-6851(92)9...
). They have therefore been considered to be candidate antigens for developing subunit vaccines against B. bovis (HINES et al., 1992Hines SA, Palmer GH, Jasmer DP, McGuire TC, McElwain TF. Neutralization-sensitive merozoite surface antigens of Babesia bovis encoded by members of a polymorphic gene family. Mol Biochem Parasitol 1992; 55(1-2): 85-94. PMid:1279421. http://dx.doi.org/10.1016/0166-6851(92)90129-8.
http://dx.doi.org/10.1016/0166-6851(92)9...
; SUAREZ et al., 2000Suarez CE, Florin-Christensen M, Hines SA, Palmer GH, Brown WC, McElwain TF. Characterization of allelic variation in the Babesia bovis merozoite surface antigen 1 (MSA-1) locus and identification of a cross-reactive inhibition-sensitive MSA-1 epitope. Infect Immun 2000; 68(12): 6865-6870. PMid:11083806. http://dx.doi.org/10.1128/IAI.68.12.6865-6870.2000.
http://dx.doi.org/10.1128/IAI.68.12.6865...
). However, these surface antigens are genetically diverse among the different isolates of B. bovis, which results in antigenic differences among distinct B. bovis isolates. In Australia, MSA analysis revealed marked differences between vaccine strains and outbreak isolates (BERENS et al., 2005Berens SJ, Brayton KA, Molloy JB, Bock RE, Lew AE, McElwain TF. Merozoite surface antigen 2 proteins of Babesia bovis vaccine breakthrough isolates contain a unique hypervariable region composed of degenerate repeats. Infect Immun 2005; 73(11): 7180-7189. PMid:16239512. http://dx.doi.org/10.1128/IAI.73.11.7180-7189.2005.
http://dx.doi.org/10.1128/IAI.73.11.7180...
; LEROITH et al., 2005LeRoith T, Brayton KA, Molloy JB, Bock RE, Hines SA, Lew AE, et al. Sequence variation and immunologic cross-reactivity among Babesia bovis merozoite surface antigen 1 proteins from vaccine strains and vaccine breakthrough isolates. Infect Immun 2005; 73(9): 5388-5394. PMid:16113254. http://dx.doi.org/10.1128/IAI.73.9.5388-5394.2005.
http://dx.doi.org/10.1128/IAI.73.9.5388-...
). Although, the study performed by Shkap et al. (1994)Shkap V, Pipano E, McElwain TF, Herzberg U, Krigel Y, Fish F, et al. Cross-protective immunity induced by Babesia bovis clones with antigenically unrelated variable merozoite surface antigens. Vet Immunol Immunopathol 1994; 41(3-4): 367-374. PMid:7941314. http://dx.doi.org/10.1016/0165-2427(94)90108-2.
http://dx.doi.org/10.1016/0165-2427(94)9...
demonstrated cross protection elicited by live vaccines despite the presence of high polymorphisms in the msa-1 and msa-2 genes. On the other hand, the study done by Wilkowsky et al. (2003)Wilkowsky SE, Farber M, Echaide I, Echaide ST, Zamorano PI, Dominguez M, et al. Babesia bovis merozoite surface protein-2c (MSA-2c) contains highly immunogenic, conserved B-cell epitopes that elicit neutralization-sensitive antibodies in cattle. Mol Biochem Parasitol 2003; 127(2): 133-141. PMid:12672522. http://dx.doi.org/10.1016/S0166-6851(02)00329-8.
http://dx.doi.org/10.1016/S0166-6851(02)...
indicate that the msa-2c gene product from the Argentine R1A strain is highly antigenic, is expressed on the surface of merozoites, contains widely conserved B-cell epitopes, elicits high levels of IgG2 antibodies in cattle upon immunization, and plays a significant functional role in the process of erythrocyte invasion. Importantly, these findings indicate that MSA-2c is a novel potential vaccine candidate and diagnostic antigen, Therefore MSAs may be useful as genetic markers, since the genetic diversity among them may reflect differences in the immune response of host animals (BORGONIO et al., 2008Borgonio V, Mosqueda J, Genis AD, Falcon A, Alvarez JA, Camacho M, et al. msa-1 and msa-2c gene analysis and common epitopes assessment in Mexican Babesia bovis isolates. Ann N Y Acad Sci 2008; 1149(1): 145-148. PMid:19120194. http://dx.doi.org/10.1196/annals.1428.035.
http://dx.doi.org/10.1196/annals.1428.03...
; GENIS et al., 2009Genis AD, Perez J, Mosqueda JJ, Alvarez A, Camacho M, Muñoz ML, et al. Using msa-2b as a molecular maker for genotyping Mexican isolates of Babesia bovis. Infect Genet Evol 2009; 9(6): 1102-1107. PMid:19931189. http://dx.doi.org/10.1016/j.meegid.2009.03.012.
http://dx.doi.org/10.1016/j.meegid.2009....
).
In Brazil, bovine babesiosis is considered to be an endemic disease (SANTOS et al., 2001Santos HQ, Linhares GFC, Madruga CR. Estudo da prevalência de anticorpos Anti-Babesia bovis e Anti-Babesia bigemina em bovinos de leite da microrregião de Goiânia determinada pelos testes de imunofluorescência indireta e ELISA. Cienc Anim Bras 2001; 2(2): 133-137.; FOLLY et al., 2009Folly MM, Pereira MAVC, Emmott VP, Vita GF, Madruga CR. Ocorrência de Babesia sp. em bezerros mestiços, por meio de testes sorológicos, em Campos dos Goytacazes, RJ, Brasil. Rev Bras Saúde Prod An 2009; 10(1): 44-51.), and the seroprevalence to B. bovis ranges from 56.4 to 97.9% (TRINDADE et al., 2010Trindade HI, Silva GRA, Teixeira MCA, Sousa MG, Machado RZ, Freitas FLC, et al. Detection of antibodies against Babesia bovis and Babesia bigemina in calves from the region of Araguaína, State of Tocantins, Brazil. Rev Bras Parasitol Vet 2010; 19(3): 169-173. PMid:20943021. http://dx.doi.org/10.1590/S1984-29612010000300008.
http://dx.doi.org/10.1590/S1984-29612010...
). The epidemiological status of the disease varies between unstable and stable areas. Some studies have revealed areas of instability, where the serological prevalence is below 75% (BARROS et al., 2005Barros SL, Madruga CR, Araújo FR, Menk CF, Almeida MAO, Melo EPS, et al. Serological survey of Babesia bovis, Babesia bigemina, and Anaplasma marginale antibodies in cattle from the semi-arid region of the state of Bahia, Brazil, by enzyme-linked immunosorbent assays. Mem Inst Oswaldo Cruz 2005; 100(6): 513-517. PMid:16302060. http://dx.doi.org/10.1590/S0074-02762005000600003.
http://dx.doi.org/10.1590/S0074-02762005...
; SOUZA et al., 2013Souza FAL, Braga JFV, Pires LV, Carvalho CJS, Costa ÈA, Ribeiro MFB, et al. Babesiosis and anaplasmosis in dairy cattle in Northeastern Brazil. Pesq Vet Bras 2013; 33(9): 1057-1061. http://dx.doi.org/10.1590/S0100-736X2013000900002.
http://dx.doi.org/10.1590/S0100-736X2013...
). On the other hand, seroprevalence is above 75% in regions of enzootic stability (FOLLY et al., 2009Folly MM, Pereira MAVC, Emmott VP, Vita GF, Madruga CR. Ocorrência de Babesia sp. em bezerros mestiços, por meio de testes sorológicos, em Campos dos Goytacazes, RJ, Brasil. Rev Bras Saúde Prod An 2009; 10(1): 44-51.; TRINDADE et al., 2010Trindade HI, Silva GRA, Teixeira MCA, Sousa MG, Machado RZ, Freitas FLC, et al. Detection of antibodies against Babesia bovis and Babesia bigemina in calves from the region of Araguaína, State of Tocantins, Brazil. Rev Bras Parasitol Vet 2010; 19(3): 169-173. PMid:20943021. http://dx.doi.org/10.1590/S1984-29612010000300008.
http://dx.doi.org/10.1590/S1984-29612010...
; COSTA et al., 2015Costa FB, Melo SA, Araújo FR, Ramos CAN, Carvalho-Neta AV, Guerra RMSNC. Serological, parasitological and molecular assessment of Babesia bovis and Babesia bigemina in cattle from state of Maranhão. Rev Caatinga 2015; 28(2): 217-224.). However, a study conducted in the state of Mato Grosso do Sul, in central-western Brazil, an area considered to be enzootically stable, showed decreased levels of anti-B. bovis colostral antibodies in calves between 3 and 4 months after birth. During this period, clinical babesiosis may occur due to low humoral immune response (MADRUGA et al., 1984Madruga CR, Aycardi E, Kessler RH, Schenk MAM, Figueiredo GR, Curvo JBE. Níveis de anticorpos anti-Babesia bigemina e Babesia bovis, em bezerros da raça Nelore, Ibagé e cruzamentos de Nelore. Pesq Agropec Bras 1984; 19(9): 1163-1168.).
The losses due to bovine babesiosis associated with Rhipicephalus (Boophilus) microplus may be severe. They have been estimated as nearly 3.5 million dollars per annum, mainly in areas of enzootic instability (GRISI et al., 2014Grisi L, Leite RC, Martins JRS, Barros ATM, Andreotti R, Cançado PHD, et al. Reassessment of the potential economic impact of cattle parasites in Brazil. Rev Bras Parasitol Vet 2014; 23(2): 150-156. PMid:25054492. http://dx.doi.org/10.1590/S1984-29612014042.
http://dx.doi.org/10.1590/S1984-29612014...
). Although several studies on the prevalence of anti-B. bovis antibodies in dairy cattle have been conducted in Brazil, only limited studies assessing the frequency of anti-B. bovis antibodies in calves from birth to 12 months of age have been conducted. Moreover, studies regarding the genetic diversity of B. bovis in Brazil are quite scarce. In the state of Bahia, in northeastern Brazil, high genetic diversity of B. bovis based on MSA-1 sequences has been reported, thus highlighting the importance of conducting extensive studies on this topic before designing immune control strategies in this country (NAGANO et al., 2013Nagano D, Sivakumar T, Macedo AC, Inpankaew T, Alhassan A, Igarashi I, et al. The Genetic Diversity of Merozoite Surface Antigen 1 (MSA-1) among Babesia bovis detected from Cattle Populations in Thailand, Brazil and Ghana. J Vet Med Sci 2013; 75(11): 1463-1470. PMid:23856760. http://dx.doi.org/10.1292/jvms.13-0251.
http://dx.doi.org/10.1292/jvms.13-0251...
).
The present study aimed to investigate the genetic diversity of B. bovis and the frequency of antibodies to B. bovis in calves from birth to 12 months of age, in a dairy cattle herd located in southeastern Brazil.
Materials and Methods
Study design
A longitudinal study was conducted on a dairy herd in Taiaçu (latitude 21º15'40” S, longitude 48º29'47” W and altitude 735 m), located in the state of São Paulo, in southeastern Brazil. This experimental study covered both seasons of a 12-month period: the rainy season (between October and March, in which the mean temperature and precipitation are 24.4°C and 187 mm, respectively) and the dry season (between April and September, in which the mean temperature and precipitation are 20.9°C and 30 mm, respectively). From June 2013 to June 2014, fifteen female calves (Bos taurus taurus x Bos taurus indicus) were evaluated every three months, from birth until they reached 12 months of age. In this herd in Taiaçu, the young animals up to 4 months of age were kept in individual stalls, with access to a pasture area of Tifton 85 grass (Cynodon dactylon). When the calves reached 5 months of age, they were transferred to a rotation area comprising Brachiaria brizantha pasture. All the animals were dewormed and de-ticked monthly, using levamisole phosphate (10mg/kg, Ripercol®, Fort Dodge, Brazil) and cypermethrin (150mg/kg, Colosso®, Ouro Fino, Brazil), respectively.
The first blood sampling was performed after the calves had ingested the colostrum, i.e. not more than one hour after their birth, followed by sequential sampling at the ages of 3, 6, 9 and 12 months, respectively, totaling 75 blood samples. All the animals had a healthy appearance at the time of sample collection. Approximately 10 mL of blood was collected from the coccygeal or jugular vein of each animal, into two types of Vacutainer tubes: one containing buffered ethylenediaminetetraacetic acid (EDTA) and the other without anticoagulant. The samples were kept at 4°C during transportation to the laboratory. In order to obtain serum samples, blood samples collected without EDTA were incubated at room temperature for 1 h and were then centrifuged at 1000 ×g for 15 minutes. The blood samples with EDTA were stored at -20°C until DNA extraction was performed.
This project was approved by the university’s Ethics Committee under the protocol number #017259/14.
Blood smears
Thin blood smears were prepared using peripheral blood. They were air-dried, fixed in methanol, stained with Giemsa and analyzed for the presence of B. bovis in the erythrocytes at 100X magnification.
Serological tests
Indirect fluorescent antibody test (IFAT)
The serum samples were subjected to a previously described protocol for anti-B. bovis and anti-B. bigemina IgG antibody detection (MACHADO et al., 1994Machado RZ, Valadão CAA, Melo WR, Alessi AC. Isolation of Babesia bigemina and Babesia bovis merozoites by ammonium chloride lysis of infected erythocytes. Braz J Med Biol Res 1994; 27(11): 2591-2598. PMid:7549981.; BARCI et al., 1994Barci LAG, Oliveira MR, Machado RZ, Oliveira DA, Araújo Filho RS. Epidemiologia da babesiose bovina no estado de São Paulo. I. Estudo em rebanhos produtores de leite tipo B do município de Pindamonhangaba, vale do Paraíba. Rev Bras Parasitol Vet 1994; 3(2): 79-82.). The antigenic substrate used in the serological reactions was prepared in accordance with the protocol described by Machado et al. (1994)Machado RZ, Valadão CAA, Melo WR, Alessi AC. Isolation of Babesia bigemina and Babesia bovis merozoites by ammonium chloride lysis of infected erythocytes. Braz J Med Biol Res 1994; 27(11): 2591-2598. PMid:7549981.. This consisted of blood smears containing erythrocytes parasitized by B. bovis or B. bigemina that had been obtained from splenectomized calves experimentally infected by B. bovis or B. bigemina. The IFAT slides were analyzed under an epifluorescence microscope (Olympus BX60, Tokyo, Japan) and results were scored as positive or negative based upon the fluorescence emission observed on the positive and negative control tests, respectively.
Enzyme-linked immunosorbent assay (ELISA)
The serum samples were also tested for the presence of IgG antibodies against B. bovis and B. bigemina by means of the indirect enzyme-linked immunosorbent assay (ELISA), using crude soluble antigen, as previously described by Machado et al. (1997)Machado RZ, Montassier HJ, Pinto AA, Lemos EG, Machado MRF, Valadão IFF, et al. An enzyme-linked immunosorbent assay (ELISA) for the detection of antibodies against Babesia bovis in cattle. Vet Parasitol 1997; 71(1): 17-26. PMid:9231985. http://dx.doi.org/10.1016/S0304-4017(97)00003-4.
http://dx.doi.org/10.1016/S0304-4017(97)...
. The cutoff value for the optical density (OD) at 405 ƞm was determined to be two and a half times (2.5X) the mean value in the negative control serum (0.233 OD for B. bovis and 0.275 OD for B. bigemina). Absorbance values at or above this value were considered positive (MACHADO et al., 1997Machado RZ, Montassier HJ, Pinto AA, Lemos EG, Machado MRF, Valadão IFF, et al. An enzyme-linked immunosorbent assay (ELISA) for the detection of antibodies against Babesia bovis in cattle. Vet Parasitol 1997; 71(1): 17-26. PMid:9231985. http://dx.doi.org/10.1016/S0304-4017(97)00003-4.
http://dx.doi.org/10.1016/S0304-4017(97)...
).
Conventional polymerase chain reaction (cPCR)
DNA extraction
DNA was extracted from 200µL of each blood sample using the DNeasy® Blood & Tissue Kit (Qiagen®, Valencia, California, USA), in accordance with the manufacturer’s instructions. The DNA concentration and absorbance ratio (260/280 nm) were measured using a spectrophotometer (Nanodrop, Thermo Scientific, USA), and the DNA was then stored at -20 °C until use in amplification reactions.
PCR amplification of target B. bovis MSAs
Primers previously designed by Tattiyapong et al. (2014)Tattiyapong M, Sivakumar T, Ybanez AP, Ybanez RHD, Perez ZO, Guswanto A, et al. Diversity of Babesia bovis merozoite surface antigen genes in the Philippines. Parasitol Int 2014; 63(1): 57-63. PMid:24042058. http://dx.doi.org/10.1016/j.parint.2013.09.003.
http://dx.doi.org/10.1016/j.parint.2013....
were used in order to amplify B. bovis MSA gene fragments (MSA-1, MSA-2b and MSA- 2c). For all the MSA genes, a common reverse primer (MSAr) was used based on the conserved nature of the GPI-anchor region of these genes (SIVAKUMAR et al., 2013Sivakumar T, Okubo K, Igarashi I, Silva WK, Kothalawala H, Silva SSP, et al. Genetic diversity of merozoite surface antigens in Babesia bovis detected from Sri Lankan cattle. Infect Genet Evol 2013; 19: 134-140. PMid:23851021. http://dx.doi.org/10.1016/j.meegid.2013.07.001.
http://dx.doi.org/10.1016/j.meegid.2013....
).
Two forward primers in different PCR sets were used for msa-1 amplification. One of them (5-AGTACTTACCTTTTTAATGACAGCCG-3`) targeted some of the Australian MSA-1 sequences (DQ028741, DQO28743, DQ028746 and DQ028747), while the other one (5’-ATGGCTACGTTTGCTCTTTTCATTTCAGC-3’) targeted the remaining msa-1gene sequences retrieved from GenBank.
PCR amplification of the target genes was performed as previously described by Tattiyapong et al. (2014)Tattiyapong M, Sivakumar T, Ybanez AP, Ybanez RHD, Perez ZO, Guswanto A, et al. Diversity of Babesia bovis merozoite surface antigen genes in the Philippines. Parasitol Int 2014; 63(1): 57-63. PMid:24042058. http://dx.doi.org/10.1016/j.parint.2013.09.003.
http://dx.doi.org/10.1016/j.parint.2013....
, with minor modifications. Briefly, 5µL of target DNA was used as a template in 25µL reaction mixtures containing 10X PCR buffer, 1.5mM of MgCl2, 0.8mM of deoxynucleotide triphosphate mixture (Invitrogen, Carlsbad, California, USA), 1.5U of Taq DNA polymerase (Invitrogen, Carlsbad, California, USA), 0.4µM of the forward and reverse primers (Integrated Technologies, Coralville, Iowa, USA) and ultra-pure sterile water (Promega, Madison, Wisconsin, USA). The PCR cycling conditions were modified slightly, as follows: an initial denaturation at 95°C for 5 min was followed by 45 cycles, each consisting of a denaturing step at 95°C for 30 s, an annealing step at 56° for 1 min for MSA-1 and MSA-2b, and at 58.1°C for 1min for MSA-2c, an extension step at 72°C for 2min, and then a final elongation step at 72°C for 5min. A bovine blood sample positive for B. bovis (GenBank accession number KU522551) and ultra-pure sterile water (Promega, Madison, Wisconsin, USA) were used as positive and negative amplification controls, respectively.
The PCR products were subjected to agarose gel electrophoresis with ethidium bromide staining and were viewed under UV light (Chemic Doc Imaging System, Bio Rad). All PCR products showing high intensity of bands with expected sizes were purified using Silica Bead DNA Gel Extraction Kit (Fermentas, São Paulo, SP, Brazil). The PCR products were directly purified and subject to DNA sequencing using the same amplification primers as sequencing primers.
Sequence analysis
The genetic diversity of the sequences determined in the present study was analyzed using the DnaSP v5 software (LIBRADO & ROZAS, 2009Librado P, Rozas J. DnaSP v5: a software for comprehensive analysis of DNA polymorphism data. Bioinformatics 2009; 25(11): 1451-1452. PMid:19346325. http://dx.doi.org/10.1093/bioinformatics/btp187.
http://dx.doi.org/10.1093/bioinformatics...
). The identity values among the nucleotide sequences were assessed by means of the BLASTn tool of the NCBI GenBank database. In addition, the nucleotide sequences of the MSA-1, MSA-2b and MSA-2c gene fragments were converted into amino acid sequences by means of the Expasy-Translate tool. The percentage of similarity between the Taiaçu sequences was calculated using the EMBOSS Needle Pairwise Sequences Alignment software.
Phylogenetic analysis
Three purified amplified DNA fragments from each positive sample were subjected to sequence confirmation in an automatic sequencer (ABI Prism 310 Genetic Analyzer; Applied Biosystems/Perkin Elmer) in both directions by means of Sanger’s method (SANGER et al., 1977Sanger F, Nicklen S, Coulson AR. DNA sequencing with chain-terminating inhibitors. Proc Natl Acad Sci USA 1977; 74(12): 5463-5467. PMid:271968. http://dx.doi.org/10.1073/pnas.74.12.5463.
http://dx.doi.org/10.1073/pnas.74.12.546...
). The electropherogram quality was analyzed using the Phred Phrap software (EWING et al., 1998Ewing B, Hillier L, Wendl MC, Green P. Base-calling of automated sequencer traces using phred. I. Accuracy assessment. Genome Res 1998; 8(3): 175-185. PMid:9521921. http://dx.doi.org/10.1101/gr.8.3.175.
http://dx.doi.org/10.1101/gr.8.3.175...
). In this, only nucleotide sequences above 400 bp in size and Phred quality ≥ 20 were used. Quality scores were assigned to each base call in automated sequencer traces. Additionally, consensus sequences were obtained through analysis on the sense and antisense sequences using the Phred Phrap software. Initially, MSA-1, MSA-2b and MSA-2c sequences were individually aligned with sequences available in GenBank using Clustal/W (THOMPSON et al., 1994Thompson JD, Higgins DG, Gibson TJ. CLUSTAL W: improving the sensitivity of progressive multiple sequence alignment through sequence weighting, position-specific gap penalties and weight matrix choice. Nucleic Acids Res 1994; 22(22): 4673-4680. PMid:7984417. http://dx.doi.org/10.1093/nar/22.22.4673.
http://dx.doi.org/10.1093/nar/22.22.4673...
). Subsequently, sequences were cut to the same length (the size of the smallest sequence) and finally were manually adjusted in Bioedit v. 7.0.5.3 (HALL, 1999Hall TA. BioEdit: a user friendly biological sequence alignment editor and analysis program for windows 95/98/NT. Nucleic Acids Symp Ser 1999; 41: 95-98.). Phylogenetic analyses based on maximum likelihood criterion (ML) were inferred by means of RAxML-HPC BlackBox 7.6.3 (STAMATAKIS et al., 2008Stamatakis A, Hoover P, Rougemont J, Renner S. A rapid bootstrap algorithm for the RAxML Web servers. Syst Biol 2008; 57(5): 758-771. PMid:18853362. http://dx.doi.org/10.1080/10635150802429642.
http://dx.doi.org/10.1080/10635150802429...
) through the CIPRES Science Gateway (MILLER et al., 2011Miller MA, Pfeiffer W, Schwartz T. The CIPRES science gateway: a community resource for phylogenetic analyses [online]. New Orleans: CIPRES; 2011 [cited 2017 Feb 8]. Available from: https://www.phylo.org
https://www.phylo.org...
). The Akaike information criterion available in Mega 5.05 was applied to identify the most appropriate model of nucleotide substitution.
B-cell epitope prediction
The B-cell epitopes in MSA-1, MSA-2b and MSA-2c amino acid sequences were predicted by the method of Kolaskar & Tongaonkar (1990)Kolaskar AS, Tongaonkar PC. A semi-empirical method for prediction of antigenic determinants on protein antigens. FEBS Lett 1990; 276(1-2): 172-174. PMid:1702393. http://dx.doi.org/10.1016/0014-5793(90)80535-Q.
http://dx.doi.org/10.1016/0014-5793(90)8...
.
Results
Blood smears
Seventy-five blood smears prepared from all the animals surveyed were observed under an optical microscope. None of them was positive for B. bovis.
Serological tests
At the second sampling time, three calves (20%) were seropositive for B. bovis and nine calves (60%) for B. bigemina according to IFAT; however, all the calves presented antibodies levels for B. bovis and B. bigemina that were below the ELISA cutoff value at that time. At six months of age, 93.3% and 100% of the calves were seropositive for B. bovis and 100% for B. bigemina according to IFAT and ELISA, respectively. At 9 and 12 months of age, all the calves (100%) were seropositive for B. bovis and B. bigemina in both IFAT and ELISA (Table 1). At the time of blood collection, no clinical signs suggestive of babesiosis were seen, although low infestation by Rhipicephalus (Boophilus) microplus ticks was observed in all animals during all sampling time.
Comparison between IFAT and ELISA for detecting antibodies against Babesia bovis and B. bigemina in serum samples from 15 calves in Taiaçu, state of São Paulo, Brazil.
PCR targeting B. bovis MSAs
Among the seventy-five DNA blood samples from the 15 calves, visible bands for MSA-1 were obtained in nine samples, for MSA-2b in 28 and for MSA-2c in 34, at different sampling times and from different calves. Unfortunately, lower numbers of sequences were obtained for the genes MSA-1 (n = 2), MSA-2c (n = 5) and MSA-2b (n = 4) because of the low intensity of bands, which precluded obtaining sufficient concentration of amplicons for DNA sequencing (Table 2). Blood samples from six calves were positive for all three msa genes (msa-1, msa-2b and msa-2c) in the PCR assays and were also seropositive in IFAT and ELISA. For MSA-1, only reactions containing the forward primer directed towards Australian sequences yielded amplified products; the PCR assay using the other forward primer did not produce any visible PCR amplicons. The sizes of the sequences obtained for the genes MSA-1, MSA-2b and MSA-2c were 809-831, 759-827 and 739-770 bp in length, respectively.
GenBank accession numbers for the msa-1, msa-2b and msa-2c gene sequences identified in the present study.
The nucleotide diversity per site (Pi), calculated using the DnaSP v5 software, was higher for MSA-1 (0.39503) and MSA-2b (0.10887) than for MSA-2c sequences (0.01918). The identity of nucleotide sequences, as assessed using the BLASTn tool of NCBI GenBank, was lower for MSA-1 (68%) and MSA-2b (80-100%) than for MSA-2c sequences (97-98%). Pairwise comparison of deduced MSA-1, MSA-2b and MSA-2c amino acid sequences showed that the similarity of MSA-1 (59.6%) and MSA-2b sequences (65.0-98.7%) from Taiaçu was lower than that of MSA-2c (85.1-98.6%), respectively (Table 3).
Nucleotide diversities, identities and similarities of the msa-1, msa-2b, and msa-2c gene sequences from cattle in Taiaçu, state of São Paulo, Brazil.
Phylogenetic analyses on the MSA-1, MSA-2b and MSA- 2c genes
Three separate phylogenetic trees were constructed using 2, 4 and 5 nucleotide sequences, based on the MSA-1 (GenBank accession numbers KX420676 and KX420677), MSA-2b (GenBank accession numbers KU522556, KU522558, KU522560 and KX420675) and MSA-2c sequences (GenBank accession numbers KU522563, KU522565, KU522567, KX420672 and KX420673) obtained in the present study.
The phylogenetic tree based on B. bovis MSA-1 gene sequences clustered the sequences into ten clades as shown in Figure 1. The clade 1 was formed by most of the B. bovis msa-1 gene sequences from Brazil detected in the state of Bahia (NAGANO et al., 2013Nagano D, Sivakumar T, Macedo AC, Inpankaew T, Alhassan A, Igarashi I, et al. The Genetic Diversity of Merozoite Surface Antigen 1 (MSA-1) among Babesia bovis detected from Cattle Populations in Thailand, Brazil and Ghana. J Vet Med Sci 2013; 75(11): 1463-1470. PMid:23856760. http://dx.doi.org/10.1292/jvms.13-0251.
http://dx.doi.org/10.1292/jvms.13-0251...
) and sequences from other countries around the world, namely Thailand, Mongolia Mexico, the United States of America, Ghana and Sri Lanka. The Taiaçu msa-1 sequences were positioned in two different clades (clades 4 and 9). Clade 4 was formed by two msa-1 sequences, one from a calf sampled in Taiaçu and another from Vietnam, respectively. Clade 9 was formed by B. bovis msa-1 gene sequences from Vietnam, Australia and a sequence amplified in the present study.
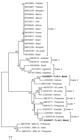
Phylogenetic analyses on B. bovis msa-1 sequences. The sequences determined in the present study are shown in boldface letters. The phylogenetic tree was inferred by using the maximum likelihood method and the GTR+G model. The numbers at the nodes correspond to bootstrap values higher than 60%, accessed with 1.000 replicates. msa-2b sequences were used as an outgroup.
The msa-2b gene sequences clustered into nine clades (Figure 2), while the Brazilian msa-2b sequences were positioned in two different clades (clades 4 and 7). One sequence (KU522556) amplified in the present study was positioned in clade 4, together with B. bovis msa-2b gene sequences from Australia, USA, Thailand and Texas. Three nucleotide sequences from Taiaçu (KU522558, KU522560 and KX420675), one from Vietnam, two from Sri Lanka and three from Israel were grouped together into clade 7.

Phylogenetic analyses on B. bovis msa-2b sequences. The sequences determined in the present study are shown in boldface letters. The phylogenetic tree was inferred by using the maximum likelihood method and the GTR+G+I model. The numbers at the nodes correspond to bootstrap values higher than 70%, accessed with 1.000 replicates. msa-1 sequences were used as an outgroup.
The phylogenetic analysis based on the msa-2c gene showed four clades. B. bovis sequences from Brazil were positioned in only one clade (clade 4) (Figure 3). Clade 4 grouped together five Taiaçu DNA sequences (KU522563, KU522565, KU522567, KX420672 and KX420673 determined in this study and another three previously reported sequences from different regions of Brazil: HM352734-Brazilian, from southeastern Brazil; HM352731-Brazilian, from central-western Brazil; and HM352735-Brazilian, from southern Brazil (RAMOS et al., 2012Ramos CAN, Araújo FR, Alves LC, Souza IIF, Guedes DS Jr, Soares CO. Genetic conservation of potentially immunogenic proteins among Brazilian isolates of Babesia bovis. Vet Parasitol 2012; 187(3-4): 548-552. PMid:22309798. http://dx.doi.org/10.1016/j.vetpar.2012.01.020.
http://dx.doi.org/10.1016/j.vetpar.2012....
).

Phylogenetic analyses on B. bovis msa-2c sequences. The sequences determined in the present study are shown in boldface letters. The phylogenetic tree was inferred by using the maximum likelihood method and the GTR+G model. The numbers at the nodes correspond to bootstrap values higher than 70%, accessed with 1.000 replicates. msa-2b sequences were used as an outgroup.
B-cell epitope prediction
Analyses of Taiaçu MSA-1 sequences predicted 11 B-cell epitopes, as shown in Table 4. All epitopes were found to be highly polymorphic, including the epitopes (TSVPESTKKVDDFPDYVPGATT) that were found in the signal peptide region. Interestingly, 6 of such epitopes were observed only in single MSA-1 sequence, indicating that these epitopes were not conserved at all.
Analyses of Taiaçu MSA-2b sequences predicted 12 B-cell epitopes, as shown in Table 5. The epitope (KEEDGRYLE) was found in the signal peptide region; and was detected in three of four MSA-2b sequences analysed. In this sequence, all other epitopes were highly polymorphic with respect to the epitopes detected in the three sequences referenced above. Similar epitopes were observed in three out of four MSA-2b sequences, indicating that these epitopes were conserved in theses sequences. Three of such epitopes (HISAKDANVK, IPF and YLDSESPF) (not shown in the table) were observed only in one MSA-2b sequence, indicating that these sequence were not conserved at all. Interestingly, these three nucleotide sequences were positioned into the same clade in the phylogenetic tree, while the single MSA-2b sequence was positioned in a different clade.
Analysis of B-cell epitopes predicted from MSA-2b sequences determined in the present study.
Analyses of Taiaçu MSA-2c sequences predicted 11 B-cell epitopes, as shown in Table 6. Two epitopes (EAVGMEATSATKTHDAL and RAVPTKQVN) were found in the signal peptide region; the first epitope was detected in four out of five MSA-2c sequences analysed, while the other one was found in one sequence, being observed between the amino acid positions 8 and 16. In general all epitopes detected in this study were found in all five MSA-2c sequences analyzed, but in one sequence those epitopes were found in different amino acid positions in relation to other found sequences. In addition to the epitope in the signal peptide, two other epitopes, namely E and LTKF, were detected in one of MSA-2c sequence in present study, indicating that these epitopes were conserved.
Analysis of B-cell epitopes predicted from MSA-2c sequences determined in the present study.
Discussion
Epidemiological studies on bovine babesiosis in particular areas are important because they may reveal the possibility of occurrences of disease outbreaks. Serological tests are indispensable tools for assessing the immune status and control strategies for Babesia spp. infections.
In the present study, blood smears (n = 75) were prepared from all the animals surveyed. When these smears were observed under an optical microscope, none of them was positive for B. bovis. Although microscopy has been used for the detection of Babesia sp. and other hemoparasites, its low sensitivity is a limiting factor in the use of this technique in epidemiological studies of parasites, as in the case of healthy carrier animals (ALMERIA et al., 2001Almeria S, Castellà J, Ferrer D, Ortuño A, Estrada-Peña A, Gutiérrez JF. Bovine piroplasms in Minorca (Balearic Islands, Spain): a comparison of PCR-based and light microscopy detection. Vet Parasitol 2001; 99(3): 249-259. PMid:11502372. http://dx.doi.org/10.1016/S0304-4017(01)00464-2.
http://dx.doi.org/10.1016/S0304-4017(01)...
).
Because of the possibility of cross-reactivity between B. bovis and B. bigemina in this study, serological assays were performed for both species. The results showed that the sampled calves had been exposed to both Babesia species. The serological results showed differences in detection of antibodies against B. bovis by means of IFAT and ELISA in the samples from the second collection, such that 20% were seropositive according to IFAT and no sample was seropositive according to ELISA. This may have occurred because IFAT detects seropositivity at three months of age, whereas it is not detected by ELISA. On the other hand, in IFAT, the serum is diluted 1:80, while in ELISA, it is at 1:400, which allows detection of serum with low antibody titers by means of IFAT.
The results demonstrated that at six months of age, a time at which the transmission risks are higher, all the calves had already been exposed to B. bovis and had thus developed active immunity against this parasite. Additionally, the sampled calves did not present any clinical signs of bovine babesiosis at any time during the experiment. The rearing system used for these calves allowed early contact with B. bovis-infected ticks and thus stimulated their active immunity against the parasite. Young calves (less than six months of age) are relatively resistant to developing the severe form of the disease, which is typically observed in susceptible adults upon initial infection with B. bovis (TRUEMAN & BLIGHT, 1978Trueman KF, Blight GW. The effect of age on resistance of cattle to Babesia bovis. Aust Vet J 1978; 54(6): 301-305. PMid:687298. http://dx.doi.org/10.1111/j.1751-0813.1978.tb02465.x.
http://dx.doi.org/10.1111/j.1751-0813.19...
; GOFF et al., 2001Goff WL, Johnson WC, Parish SM, Barrington GM, Tuo W, Valdez RA. The age-related immunity in cattle to Babesia bovis infection involves the rapid induction of interleukin-12, interferon- γ, and inducible nitric oxide synthase mRNA expression in the spleen. Parasite Immunol 2001; 23(9): 463-471. PMid:11589775. http://dx.doi.org/10.1046/j.1365-3024.2001.00402.x.
http://dx.doi.org/10.1046/j.1365-3024.20...
). However, it is currently accepted that colostral antibodies are not the main source of protection for calves against bovine babesiosis and that innate immune mechanisms are also involved (BOCK et al., 2004Bock RE, Jackson L, De Vos AJ, Jorgensen W. Babesiosis of cattle. Parasitology 2004;129(7 Suppl): S247-S269. PMid:15938514. http://dx.doi.org/10.1017/S0031182004005190.
http://dx.doi.org/10.1017/S0031182004005...
). A study conducted in the state of Mato Grosso do Sul, in central-western Brazil, showed decreased levels of anti-B. bovis colostral antibodies in calves aged 3-4 months. During this period, clinical babesiosis may occur due to low humoral immune response (MADRUGA et al., 1984Madruga CR, Aycardi E, Kessler RH, Schenk MAM, Figueiredo GR, Curvo JBE. Níveis de anticorpos anti-Babesia bigemina e Babesia bovis, em bezerros da raça Nelore, Ibagé e cruzamentos de Nelore. Pesq Agropec Bras 1984; 19(9): 1163-1168.).
Exposure of young animals to considerable quantities of Babesia-infected ticks during their first nine months of life may ensure natural protection for the rest of their lives, thus resulting in a low risk of clinical disease. Taking into account that the rate of exposure to B. bovis in the present work was above 80%, the Taiaçu farm can be characterized as an area of enzootic stability for B. bovis. If over 75% of the calves are exposed to B. bovis, a given herd is considered to be endemically stable (MAHONEY & ROSS, 1972Mahoney DF, Ross DR. Epizootiological factors in the control of bovine babesiosis. Aust Vet J 1972; 48(5): 292-298. PMid:4672119. http://dx.doi.org/10.1111/j.1751-0813.1972.tb05160.x.
http://dx.doi.org/10.1111/j.1751-0813.19...
; TRINDADE et al., 2010Trindade HI, Silva GRA, Teixeira MCA, Sousa MG, Machado RZ, Freitas FLC, et al. Detection of antibodies against Babesia bovis and Babesia bigemina in calves from the region of Araguaína, State of Tocantins, Brazil. Rev Bras Parasitol Vet 2010; 19(3): 169-173. PMid:20943021. http://dx.doi.org/10.1590/S1984-29612010000300008.
http://dx.doi.org/10.1590/S1984-29612010...
; COSTA et al., 2015Costa FB, Melo SA, Araújo FR, Ramos CAN, Carvalho-Neta AV, Guerra RMSNC. Serological, parasitological and molecular assessment of Babesia bovis and Babesia bigemina in cattle from state of Maranhão. Rev Caatinga 2015; 28(2): 217-224.).
In the present study, the diversity of MSA genes in the B. bovis population in cattle in a herd in Taiaçu, southeastern Brazil, was analyzed. Although a considerable number of MSA gene fragments were obtained, only a few fragments were subjected to sequencing, since most of them yielded bands of weak intensity. The genes encoding MSAs are considered to be useful markers in relation to the molecular epidemiology of B. bovis, as confirmed by a number of previous studies (BERENS et al., 2005Berens SJ, Brayton KA, Molloy JB, Bock RE, Lew AE, McElwain TF. Merozoite surface antigen 2 proteins of Babesia bovis vaccine breakthrough isolates contain a unique hypervariable region composed of degenerate repeats. Infect Immun 2005; 73(11): 7180-7189. PMid:16239512. http://dx.doi.org/10.1128/IAI.73.11.7180-7189.2005.
http://dx.doi.org/10.1128/IAI.73.11.7180...
; LEROITH et al., 2005LeRoith T, Brayton KA, Molloy JB, Bock RE, Hines SA, Lew AE, et al. Sequence variation and immunologic cross-reactivity among Babesia bovis merozoite surface antigen 1 proteins from vaccine strains and vaccine breakthrough isolates. Infect Immun 2005; 73(9): 5388-5394. PMid:16113254. http://dx.doi.org/10.1128/IAI.73.9.5388-5394.2005.
http://dx.doi.org/10.1128/IAI.73.9.5388-...
; ALTANGEREL et al., 2012Altangerel K, Sivakumar T, Battsetseg B, Battur B, Ueno A, Igarashi I, et al. Phylogenetic relationships of Mongolian Babesia bovis isolates based on the merozoite surface antigen (MSA)-1, MSA-2b, and MSA-2c genes. Vet Parasitol 2012; 184(2-4): 309-316. PMid:22004913. http://dx.doi.org/10.1016/j.vetpar.2011.09.021.
http://dx.doi.org/10.1016/j.vetpar.2011....
; SIMKING et al., 2013Simking P, Saengow S, Bangphoomi K, Sarataphan N, Wongnarkpet S, Inpankaew T, et al. The molecular prevalence and MSA-2b gene-based genetic diversity of Babesia bovis in dairy cattle in Thailand. Vet Parasitol 2013; 197(3-4): 642-648. PMid:23953761. http://dx.doi.org/10.1016/j.vetpar.2013.07.015.
http://dx.doi.org/10.1016/j.vetpar.2013....
; SIVAKUMAR et al., 2013Sivakumar T, Okubo K, Igarashi I, Silva WK, Kothalawala H, Silva SSP, et al. Genetic diversity of merozoite surface antigens in Babesia bovis detected from Sri Lankan cattle. Infect Genet Evol 2013; 19: 134-140. PMid:23851021. http://dx.doi.org/10.1016/j.meegid.2013.07.001.
http://dx.doi.org/10.1016/j.meegid.2013....
; TATTIYAPONG et al., 2014Tattiyapong M, Sivakumar T, Ybanez AP, Ybanez RHD, Perez ZO, Guswanto A, et al. Diversity of Babesia bovis merozoite surface antigen genes in the Philippines. Parasitol Int 2014; 63(1): 57-63. PMid:24042058. http://dx.doi.org/10.1016/j.parint.2013.09.003.
http://dx.doi.org/10.1016/j.parint.2013....
). Genetic diversity is thought to be a survival strategy for protozoan parasites (DEITSCH et al., 2009Deitsch KW, Lukehart SA, Stringer JR. Common strategies for antigenic variation by bacterial, fungal and protozoan pathogens. Nat Rev Microbiol 2009; 7(7): 493-503. PMid:19503065. http://dx.doi.org/10.1038/nrmicro2145.
http://dx.doi.org/10.1038/nrmicro2145...
). Antigenic variation arising from this genetic diversity results in different immune profiles in host animals (BORGONIO et al., 2008Borgonio V, Mosqueda J, Genis AD, Falcon A, Alvarez JA, Camacho M, et al. msa-1 and msa-2c gene analysis and common epitopes assessment in Mexican Babesia bovis isolates. Ann N Y Acad Sci 2008; 1149(1): 145-148. PMid:19120194. http://dx.doi.org/10.1196/annals.1428.035.
http://dx.doi.org/10.1196/annals.1428.03...
; GENIS et al., 2009Genis AD, Perez J, Mosqueda JJ, Alvarez A, Camacho M, Muñoz ML, et al. Using msa-2b as a molecular maker for genotyping Mexican isolates of Babesia bovis. Infect Genet Evol 2009; 9(6): 1102-1107. PMid:19931189. http://dx.doi.org/10.1016/j.meegid.2009.03.012.
http://dx.doi.org/10.1016/j.meegid.2009....
).
In the phylogenetic analyses, while the Taiaçu msa-1 and msa-2b DNA sequences were detected in multiple clades, the msa-2c sequences grouped in only one clade. Few fragments of the msa-1 gene were amplified, probably because of the presence of polymorphism among the nucleotides in the signal peptide regions of msa-1 from different B. bovis (LEROITH et al., 2006LeRoith T, Berens SJ, Brayton KA, Hines SA, Brown WC, Norimine J, et al. The Babesia bovis merozoite surface antigen 1 hypervariable region induces surface- reactive antibodies that block merozoite invasion. Infect Immun 2006; 74(6): 3663-3667. PMid:16714599. http://dx.doi.org/10.1128/IAI.00032-06.
http://dx.doi.org/10.1128/IAI.00032-06...
). Additionally, the primer set chosen may have been less efficient than those targeting the msa-2b and msa-2c genes. Therefore, msa-1 gene sequences from different B. bovis cannot be amplified by a single primer set (NAGANO et al., 2013Nagano D, Sivakumar T, Macedo AC, Inpankaew T, Alhassan A, Igarashi I, et al. The Genetic Diversity of Merozoite Surface Antigen 1 (MSA-1) among Babesia bovis detected from Cattle Populations in Thailand, Brazil and Ghana. J Vet Med Sci 2013; 75(11): 1463-1470. PMid:23856760. http://dx.doi.org/10.1292/jvms.13-0251.
http://dx.doi.org/10.1292/jvms.13-0251...
).
The genetic diversity of MSA-1 and MSA-2b observed in the cladogram was further confirmed by higher values for nucleotide diversity per site (Pi) and low estimated identity and similarity values, and also by the alignments of msa-1 and msa-2b sequences amplified from blood DNA positive to B. bovis of calves from Taiaçu (Supplementary Figures S1 and S2).
The msa-2c gene sequences determined in this study were grouped into only one clade (clade 4). All the msa-2c sequences detected in the cattle in Taiaçu grouped together with sequences derived from cattle in several other countries (TATTIYAPONG et al., 2014Tattiyapong M, Sivakumar T, Ybanez AP, Ybanez RHD, Perez ZO, Guswanto A, et al. Diversity of Babesia bovis merozoite surface antigen genes in the Philippines. Parasitol Int 2014; 63(1): 57-63. PMid:24042058. http://dx.doi.org/10.1016/j.parint.2013.09.003.
http://dx.doi.org/10.1016/j.parint.2013....
), including three from other regions of Brazil (RAMOS et al., 2012Ramos CAN, Araújo FR, Alves LC, Souza IIF, Guedes DS Jr, Soares CO. Genetic conservation of potentially immunogenic proteins among Brazilian isolates of Babesia bovis. Vet Parasitol 2012; 187(3-4): 548-552. PMid:22309798. http://dx.doi.org/10.1016/j.vetpar.2012.01.020.
http://dx.doi.org/10.1016/j.vetpar.2012....
). This indicates that the msa-2c sequences of B. bovis shared genetic characteristics worldwide. The fact that msa-2c gene DNA sequences from cattle in Taiaçu, Brazil, were positioned in the same clade as other Brazilian DNA sequences may show that there was an absence of genetic diversity. This was supported by low values for nucleotide diversity per site and higher estimated identity and similarity values and sustained by the alignments of msa-2c sequences amplified from blood DNA positive to B. bovis of calves from Taiaçu (Supplementary figure S3).
A recent study on the msa-2c gene reported that the Brazilian B. bovis isolates were genetically conserved (RAMOS et al., 2012Ramos CAN, Araújo FR, Alves LC, Souza IIF, Guedes DS Jr, Soares CO. Genetic conservation of potentially immunogenic proteins among Brazilian isolates of Babesia bovis. Vet Parasitol 2012; 187(3-4): 548-552. PMid:22309798. http://dx.doi.org/10.1016/j.vetpar.2012.01.020.
http://dx.doi.org/10.1016/j.vetpar.2012....
). Although genetic diversity has been observed in B. bovis msa-1 and msa-2b sequences in the present study, a limitation of this work was the small number of sequences obtained for analysis. This was mainly due because PCR products were not amenable for cloning. The cloning approach would not only allow sequencing of the weak amplicons but would also contribute to provide a more diverse pool of sequences present in each single infected animal. In the future, such strategy will contribute to a better clarification of the diversity of B. bovis msa sequences in Brazil.
In summary, B. bovis-VMSA sequence diversity does not seem to correlate with geographic distances.
The ability of native or recombinant-derived MSA-1 to induce merozoite surface reactive antibody that neutralizes merozoite infectivity (HINES et al., 1992Hines SA, Palmer GH, Jasmer DP, McGuire TC, McElwain TF. Neutralization-sensitive merozoite surface antigens of Babesia bovis encoded by members of a polymorphic gene family. Mol Biochem Parasitol 1992; 55(1-2): 85-94. PMid:1279421. http://dx.doi.org/10.1016/0166-6851(92)90129-8.
http://dx.doi.org/10.1016/0166-6851(92)9...
) suggests an important role for MSA-1 in protective immunity against B. bovis. In the present study two sequences of msa-1 gene amplified were positioned in two different clades (clades 4 and 9) and both sequences show more dramatic differences among msa-1 gene sequences. These differences may be due to the circulation of distinct strains of B. bovis or alternatively, due to the selection of ´´sub-strains`` which would be present in a single strain. This selection could have been driven by immune responses in the calves. All these questions can be answered through the development and characterization of biological clones of B. bovis which will provide the opportunity to test the role of conserved versus variant antigens in the induction of protective immunity (PALMER et al., 1991Palmer GH, McElwain TF, Perryman LE, Davis WC, Reduker DR, Jasmer DP, et al. Strain variation of Babesia bovis merozoite surface exposed epitopes. Infect Immun 1991; 59(9): 3340-3342. PMid:1715329.; SHKAP et al., 1994Shkap V, Pipano E, McElwain TF, Herzberg U, Krigel Y, Fish F, et al. Cross-protective immunity induced by Babesia bovis clones with antigenically unrelated variable merozoite surface antigens. Vet Immunol Immunopathol 1994; 41(3-4): 367-374. PMid:7941314. http://dx.doi.org/10.1016/0165-2427(94)90108-2.
http://dx.doi.org/10.1016/0165-2427(94)9...
).
The use of clones defined by antigenically variant VMSA indicates that although VMSA may contribute to immunity, significant protection against clinical disease is not dependent upon VMSA conservation. Consequently a strategy for vaccine development based on epitopes conserved among otherwise antigenically distinct strains should be followed (SHKAP et al., 1994Shkap V, Pipano E, McElwain TF, Herzberg U, Krigel Y, Fish F, et al. Cross-protective immunity induced by Babesia bovis clones with antigenically unrelated variable merozoite surface antigens. Vet Immunol Immunopathol 1994; 41(3-4): 367-374. PMid:7941314. http://dx.doi.org/10.1016/0165-2427(94)90108-2.
http://dx.doi.org/10.1016/0165-2427(94)9...
).
B-cell epitopes can be defined as surface accessible clusters of amino acids, which are recognized by secreted antibodies or B-cell receptors and are able to elicit cellular or humoral immune response (GETZOFF et al., 1988Getzoff ED, Tainer JA, Lerner RA, Geysen HM. The Chemistry and Mechanism of Antibody Binding to Protein Antigens. Adv Immunol 1988; 43: 1-98. https://doi.org/10.1016/S0065-2776(08)60363-6.
https://doi.org/10.1016/S0065-2776(08)60...
). Identification of epitopes that invoke strong responses from B-cells is one of the key steps in designing effective vaccines against pathogens (POTOCNAKOVA et al., 2016Potocnakova L, Bhide M, Pulzova LB. An introduction to B-cell epitope mapping and in silico epitope prediction. J Immunol Res 2016; 2016: 1-11. http://dx.doi.org/10.1155/2016/6760830.
http://dx.doi.org/10.1155/2016/6760830...
). The presence of polymorphisms in the epitopes might more accurately reflect the functional relevance of the genetic diversity (HINES et al., 1992Hines SA, Palmer GH, Jasmer DP, McGuire TC, McElwain TF. Neutralization-sensitive merozoite surface antigens of Babesia bovis encoded by members of a polymorphic gene family. Mol Biochem Parasitol 1992; 55(1-2): 85-94. PMid:1279421. http://dx.doi.org/10.1016/0166-6851(92)90129-8.
http://dx.doi.org/10.1016/0166-6851(92)9...
; SIMKING et al., 2013Simking P, Saengow S, Bangphoomi K, Sarataphan N, Wongnarkpet S, Inpankaew T, et al. The molecular prevalence and MSA-2b gene-based genetic diversity of Babesia bovis in dairy cattle in Thailand. Vet Parasitol 2013; 197(3-4): 642-648. PMid:23953761. http://dx.doi.org/10.1016/j.vetpar.2013.07.015.
http://dx.doi.org/10.1016/j.vetpar.2013....
). In present study, while the predicted epitopes among MSA-1 sequences were poorly conserved, MSA-2b predicted epitopes were relatively conserved; finally, they were conserved among MSA-2c sequences. Many epitopes of MSA-2b and MSA-2c sequences were conserved, it is likely that this peptides functions as an epitope, as they are not located within the signal peptide. The high polymorphisms observed among the epitopes found among Taiaçu MSA-1 sequences may indicate that they differ in their antigenic characters. Since the predicted epitopes among MSA-2c sequences in this present study were conserved; further research will be aimed at determining if such MSA gene is a novel potential vaccine candidate and diagnostic antigen. Although MSA genes have been used as genetic markers, only cross immunity tests could clarify a possible function of this epitopes. (DOMINGUEZ et al., 2010Dominguez M, Echaide I, Echaide ST, Mosqueda J, Cetrá B, Suarez CE, et al. In silico predicted conserved B-cell epitopes in the merozoite surface antigen-2 family of B. bovis are neutralization sensitive. Vet Parasitol 2010; 167(2-4): 216-226. PMid:19850413. http://dx.doi.org/10.1016/j.vetpar.2009.09.023.
http://dx.doi.org/10.1016/j.vetpar.2009....
; SIMKING et al., 2013Simking P, Saengow S, Bangphoomi K, Sarataphan N, Wongnarkpet S, Inpankaew T, et al. The molecular prevalence and MSA-2b gene-based genetic diversity of Babesia bovis in dairy cattle in Thailand. Vet Parasitol 2013; 197(3-4): 642-648. PMid:23953761. http://dx.doi.org/10.1016/j.vetpar.2013.07.015.
http://dx.doi.org/10.1016/j.vetpar.2013....
).
Conclusion
The rearing system in which the calves were maintained in the present study allowed exposure of two-month-old animals to B. bovis-infected ticks. This favored development of active immunity against the parasite, thus preventing occurrences of clinical signs of the disease.
The B. bovis msa-1 and msa-2b gene sequences detected in these cattle in Taiaçu, southeastern Brazil, were genetically diverse, but the msa-2c sequences were conserved.
The serology results showed that calves developed active immunity, which means that they had contact with the agent before the decrease of colostral antibody levels (passive immunity). The occurrence of antibodies to B. bovis crude antigen was not necessarily related to genetic diversity found in B. bovis-msa sequences in the present study. Antigenic diverse parasites could evade protective immune responses that may have developed in cattle during past exposure to B. bovis parasites. Therefore a study on the genetic diversity of B. bovis involving animals from different Brazilian regions is much needed. Additional studies using immunoblot assays and neutralization tests are much needed in order to explore the possibility of using these antigens as potential vaccine components.
Acknowledgements
The authors would like to thank all the staff of the farms and of the Immunoparasitology Laboratory, School of Agrarian and Veterinary Sciences, São Paulo State University “Júlio de Mesquita Filho” (UNESP), Jaboticabal Campus. Our special thanks to Paulo Henrique Sampaio, MSc, for excellent technical support.
This study was supported by grants from the National Council for Scientific and Technological Development (Conselho Nacional de Desenvolvimento Cientifico e Tecnológico, CNPq), the Ministry of Science, Technology and Innovation and the Research Support Foundation of the State of São Paulo (Fundação de Amparo a Pesquisa do Estado de São Paulo, FAPESP; procedural number #2012 ̸ 213714).
References
- Almeria S, Castellà J, Ferrer D, Ortuño A, Estrada-Peña A, Gutiérrez JF. Bovine piroplasms in Minorca (Balearic Islands, Spain): a comparison of PCR-based and light microscopy detection. Vet Parasitol 2001; 99(3): 249-259. PMid:11502372. http://dx.doi.org/10.1016/S0304-4017(01)00464-2
» http://dx.doi.org/10.1016/S0304-4017(01)00464-2 - Altangerel K, Sivakumar T, Battsetseg B, Battur B, Ueno A, Igarashi I, et al. Phylogenetic relationships of Mongolian Babesia bovis isolates based on the merozoite surface antigen (MSA)-1, MSA-2b, and MSA-2c genes. Vet Parasitol 2012; 184(2-4): 309-316. PMid:22004913. http://dx.doi.org/10.1016/j.vetpar.2011.09.021
» http://dx.doi.org/10.1016/j.vetpar.2011.09.021 - Barci LAG, Oliveira MR, Machado RZ, Oliveira DA, Araújo Filho RS. Epidemiologia da babesiose bovina no estado de São Paulo. I. Estudo em rebanhos produtores de leite tipo B do município de Pindamonhangaba, vale do Paraíba. Rev Bras Parasitol Vet 1994; 3(2): 79-82.
- Barros SL, Madruga CR, Araújo FR, Menk CF, Almeida MAO, Melo EPS, et al. Serological survey of Babesia bovis, Babesia bigemina, and Anaplasma marginale antibodies in cattle from the semi-arid region of the state of Bahia, Brazil, by enzyme-linked immunosorbent assays. Mem Inst Oswaldo Cruz 2005; 100(6): 513-517. PMid:16302060. http://dx.doi.org/10.1590/S0074-02762005000600003
» http://dx.doi.org/10.1590/S0074-02762005000600003 - Berens SJ, Brayton KA, Molloy JB, Bock RE, Lew AE, McElwain TF. Merozoite surface antigen 2 proteins of Babesia bovis vaccine breakthrough isolates contain a unique hypervariable region composed of degenerate repeats. Infect Immun 2005; 73(11): 7180-7189. PMid:16239512. http://dx.doi.org/10.1128/IAI.73.11.7180-7189.2005
» http://dx.doi.org/10.1128/IAI.73.11.7180-7189.2005 - Bock RE, Jackson L, De Vos AJ, Jorgensen W. Babesiosis of cattle. Parasitology 2004;129(7 Suppl): S247-S269. PMid:15938514. http://dx.doi.org/10.1017/S0031182004005190
» http://dx.doi.org/10.1017/S0031182004005190 - Borgonio V, Mosqueda J, Genis AD, Falcon A, Alvarez JA, Camacho M, et al. msa-1 and msa-2c gene analysis and common epitopes assessment in Mexican Babesia bovis isolates. Ann N Y Acad Sci 2008; 1149(1): 145-148. PMid:19120194. http://dx.doi.org/10.1196/annals.1428.035
» http://dx.doi.org/10.1196/annals.1428.035 - Brown WC, Norimine J, Goff WL, Suarez CE, McElwain TF. Prospects for recombinant vaccines against Babesia bovis and related parasites. Parasite Immunol 2006; 28(7): 315-327. PMid:16842268. http://dx.doi.org/10.1111/j.1365-3024.2006.00849.x
» http://dx.doi.org/10.1111/j.1365-3024.2006.00849.x - Costa FB, Melo SA, Araújo FR, Ramos CAN, Carvalho-Neta AV, Guerra RMSNC. Serological, parasitological and molecular assessment of Babesia bovis and Babesia bigemina in cattle from state of Maranhão. Rev Caatinga 2015; 28(2): 217-224.
- Deitsch KW, Lukehart SA, Stringer JR. Common strategies for antigenic variation by bacterial, fungal and protozoan pathogens. Nat Rev Microbiol 2009; 7(7): 493-503. PMid:19503065. http://dx.doi.org/10.1038/nrmicro2145
» http://dx.doi.org/10.1038/nrmicro2145 - Dominguez M, Echaide I, Echaide ST, Mosqueda J, Cetrá B, Suarez CE, et al. In silico predicted conserved B-cell epitopes in the merozoite surface antigen-2 family of B. bovis are neutralization sensitive. Vet Parasitol 2010; 167(2-4): 216-226. PMid:19850413. http://dx.doi.org/10.1016/j.vetpar.2009.09.023
» http://dx.doi.org/10.1016/j.vetpar.2009.09.023 - Ewing B, Hillier L, Wendl MC, Green P. Base-calling of automated sequencer traces using phred. I. Accuracy assessment. Genome Res 1998; 8(3): 175-185. PMid:9521921. http://dx.doi.org/10.1101/gr.8.3.175
» http://dx.doi.org/10.1101/gr.8.3.175 - Florin-Christensen M, Suarez C, Hines SA, Palmer GH, Brown WC, McElwain TF. The Babesia bovis merozoite surface antigen 2 locus contains four tandemly arranged and expressed genes encoding immunologically distinct proteins. Infect Immun 2002; 70(7): 3566-3575. PMid:12065497. http://dx.doi.org/10.1128/IAI.70.7.3566-3575.2002
» http://dx.doi.org/10.1128/IAI.70.7.3566-3575.2002 - Folly MM, Pereira MAVC, Emmott VP, Vita GF, Madruga CR. Ocorrência de Babesia sp. em bezerros mestiços, por meio de testes sorológicos, em Campos dos Goytacazes, RJ, Brasil. Rev Bras Saúde Prod An 2009; 10(1): 44-51.
- Gaffar FR, Yatsuda AP, Franssen FF, Vries E. Erythrocyte invasion by Babesia bovis merozoites is inhibited by polyclonal antisera directed against peptides derived from a homologue of Plasmodium falciparum apical membrane antigen 1. Infect Immun 2004; 72(5): 2947-2955. PMid:15102807. http://dx.doi.org/10.1128/IAI.72.5.2947-2955.2004
» http://dx.doi.org/10.1128/IAI.72.5.2947-2955.2004 - Genis AD, Perez J, Mosqueda JJ, Alvarez A, Camacho M, Muñoz ML, et al. Using msa-2b as a molecular maker for genotyping Mexican isolates of Babesia bovis. Infect Genet Evol 2009; 9(6): 1102-1107. PMid:19931189. http://dx.doi.org/10.1016/j.meegid.2009.03.012
» http://dx.doi.org/10.1016/j.meegid.2009.03.012 - Getzoff ED, Tainer JA, Lerner RA, Geysen HM. The Chemistry and Mechanism of Antibody Binding to Protein Antigens. Adv Immunol 1988; 43: 1-98. https://doi.org/10.1016/S0065-2776(08)60363-6
» https://doi.org/10.1016/S0065-2776(08)60363-6 - Goff WL, Johnson WC, Parish SM, Barrington GM, Tuo W, Valdez RA. The age-related immunity in cattle to Babesia bovis infection involves the rapid induction of interleukin-12, interferon- γ, and inducible nitric oxide synthase mRNA expression in the spleen. Parasite Immunol 2001; 23(9): 463-471. PMid:11589775. http://dx.doi.org/10.1046/j.1365-3024.2001.00402.x
» http://dx.doi.org/10.1046/j.1365-3024.2001.00402.x - Grisi L, Leite RC, Martins JRS, Barros ATM, Andreotti R, Cançado PHD, et al. Reassessment of the potential economic impact of cattle parasites in Brazil. Rev Bras Parasitol Vet 2014; 23(2): 150-156. PMid:25054492. http://dx.doi.org/10.1590/S1984-29612014042
» http://dx.doi.org/10.1590/S1984-29612014042 - Hall TA. BioEdit: a user friendly biological sequence alignment editor and analysis program for windows 95/98/NT. Nucleic Acids Symp Ser 1999; 41: 95-98.
- Hines SA, Palmer GH, Jasmer DP, McGuire TC, McElwain TF. Neutralization-sensitive merozoite surface antigens of Babesia bovis encoded by members of a polymorphic gene family. Mol Biochem Parasitol 1992; 55(1-2): 85-94. PMid:1279421. http://dx.doi.org/10.1016/0166-6851(92)90129-8
» http://dx.doi.org/10.1016/0166-6851(92)90129-8 - Juliano RS, Machado RZ, Fioravanti MCS, Andrade GM, Jayme VS. Soroepidemiologia da babesiose em rebanho de bovinos da raça Curraleiro. Cienc Rural 2007; 37(5): 1387-1392. http://dx.doi.org/10.1590/S0103-84782007000500026
» http://dx.doi.org/10.1590/S0103-84782007000500026 - Kolaskar AS, Tongaonkar PC. A semi-empirical method for prediction of antigenic determinants on protein antigens. FEBS Lett 1990; 276(1-2): 172-174. PMid:1702393. http://dx.doi.org/10.1016/0014-5793(90)80535-Q
» http://dx.doi.org/10.1016/0014-5793(90)80535-Q - LeRoith T, Berens SJ, Brayton KA, Hines SA, Brown WC, Norimine J, et al. The Babesia bovis merozoite surface antigen 1 hypervariable region induces surface- reactive antibodies that block merozoite invasion. Infect Immun 2006; 74(6): 3663-3667. PMid:16714599. http://dx.doi.org/10.1128/IAI.00032-06
» http://dx.doi.org/10.1128/IAI.00032-06 - LeRoith T, Brayton KA, Molloy JB, Bock RE, Hines SA, Lew AE, et al. Sequence variation and immunologic cross-reactivity among Babesia bovis merozoite surface antigen 1 proteins from vaccine strains and vaccine breakthrough isolates. Infect Immun 2005; 73(9): 5388-5394. PMid:16113254. http://dx.doi.org/10.1128/IAI.73.9.5388-5394.2005
» http://dx.doi.org/10.1128/IAI.73.9.5388-5394.2005 - Librado P, Rozas J. DnaSP v5: a software for comprehensive analysis of DNA polymorphism data. Bioinformatics 2009; 25(11): 1451-1452. PMid:19346325. http://dx.doi.org/10.1093/bioinformatics/btp187
» http://dx.doi.org/10.1093/bioinformatics/btp187 - Machado RZ, Montassier HJ, Pinto AA, Lemos EG, Machado MRF, Valadão IFF, et al. An enzyme-linked immunosorbent assay (ELISA) for the detection of antibodies against Babesia bovis in cattle. Vet Parasitol 1997; 71(1): 17-26. PMid:9231985. http://dx.doi.org/10.1016/S0304-4017(97)00003-4
» http://dx.doi.org/10.1016/S0304-4017(97)00003-4 - Machado RZ, Valadão CAA, Melo WR, Alessi AC. Isolation of Babesia bigemina and Babesia bovis merozoites by ammonium chloride lysis of infected erythocytes. Braz J Med Biol Res 1994; 27(11): 2591-2598. PMid:7549981.
- Madruga CR, Aycardi E, Kessler RH, Schenk MAM, Figueiredo GR, Curvo JBE. Níveis de anticorpos anti-Babesia bigemina e Babesia bovis, em bezerros da raça Nelore, Ibagé e cruzamentos de Nelore. Pesq Agropec Bras 1984; 19(9): 1163-1168.
- Mahoney DF, Ross DR. Epizootiological factors in the control of bovine babesiosis. Aust Vet J 1972; 48(5): 292-298. PMid:4672119. http://dx.doi.org/10.1111/j.1751-0813.1972.tb05160.x
» http://dx.doi.org/10.1111/j.1751-0813.1972.tb05160.x - Miller MA, Pfeiffer W, Schwartz T. The CIPRES science gateway: a community resource for phylogenetic analyses [online]. New Orleans: CIPRES; 2011 [cited 2017 Feb 8]. Available from: https://www.phylo.org
» https://www.phylo.org - Molad T, Fleiderovitz L, Leibovich B, Wolkomirsky R, Erster O, Roth A, et al. Genetic polymorphism of Babesia bovis merozoite surface antigens-2 (MSA-2) isolates from bovine blood and Rhipicephalus annulatus ticks in Israel. Vet Parasitol 2014; 205(1-2): 20-27. PMid:25149097. http://dx.doi.org/10.1016/j.vetpar.2014.07.016
» http://dx.doi.org/10.1016/j.vetpar.2014.07.016 - Mosqueda J, McElwain TF, Palmer GH. Babesia bovis merozoite surface antigen 2 proteins are expressed on the merozoite and sporozoite surface, and specific antibodies inhibit attachment and invasion of erythrocytes. Infect Immun 2002; 70(11): 6448-6455. PMid:12379726. http://dx.doi.org/10.1128/IAI.70.11.6448-6455.2002
» http://dx.doi.org/10.1128/IAI.70.11.6448-6455.2002 - Mtshali MS, Mtshali PS. Molecular diagnosis and phylogenetic analysis of Babesia bigemina and Babesia bovis hemoparasites from cattle in South Africa. BMC Vet Res 2013; 9(1): 154. PMid:23927555. http://dx.doi.org/10.1186/1746-6148-9-154
» http://dx.doi.org/10.1186/1746-6148-9-154 - Nagano D, Sivakumar T, Macedo AC, Inpankaew T, Alhassan A, Igarashi I, et al. The Genetic Diversity of Merozoite Surface Antigen 1 (MSA-1) among Babesia bovis detected from Cattle Populations in Thailand, Brazil and Ghana. J Vet Med Sci 2013; 75(11): 1463-1470. PMid:23856760. http://dx.doi.org/10.1292/jvms.13-0251
» http://dx.doi.org/10.1292/jvms.13-0251 - Palmer GH, McElwain TF, Perryman LE, Davis WC, Reduker DR, Jasmer DP, et al. Strain variation of Babesia bovis merozoite surface exposed epitopes. Infect Immun 1991; 59(9): 3340-3342. PMid:1715329.
- Potocnakova L, Bhide M, Pulzova LB. An introduction to B-cell epitope mapping and in silico epitope prediction. J Immunol Res 2016; 2016: 1-11. http://dx.doi.org/10.1155/2016/6760830
» http://dx.doi.org/10.1155/2016/6760830 - Ramos CAN, Araújo FR, Alves LC, Souza IIF, Guedes DS Jr, Soares CO. Genetic conservation of potentially immunogenic proteins among Brazilian isolates of Babesia bovis. Vet Parasitol 2012; 187(3-4): 548-552. PMid:22309798. http://dx.doi.org/10.1016/j.vetpar.2012.01.020
» http://dx.doi.org/10.1016/j.vetpar.2012.01.020 - Sanger F, Nicklen S, Coulson AR. DNA sequencing with chain-terminating inhibitors. Proc Natl Acad Sci USA 1977; 74(12): 5463-5467. PMid:271968. http://dx.doi.org/10.1073/pnas.74.12.5463
» http://dx.doi.org/10.1073/pnas.74.12.5463 - Santos HQ, Linhares GFC, Madruga CR. Estudo da prevalência de anticorpos Anti-Babesia bovis e Anti-Babesia bigemina em bovinos de leite da microrregião de Goiânia determinada pelos testes de imunofluorescência indireta e ELISA. Cienc Anim Bras 2001; 2(2): 133-137.
- Shkap V, Pipano E, McElwain TF, Herzberg U, Krigel Y, Fish F, et al. Cross-protective immunity induced by Babesia bovis clones with antigenically unrelated variable merozoite surface antigens. Vet Immunol Immunopathol 1994; 41(3-4): 367-374. PMid:7941314. http://dx.doi.org/10.1016/0165-2427(94)90108-2
» http://dx.doi.org/10.1016/0165-2427(94)90108-2 - Simking P, Saengow S, Bangphoomi K, Sarataphan N, Wongnarkpet S, Inpankaew T, et al. The molecular prevalence and MSA-2b gene-based genetic diversity of Babesia bovis in dairy cattle in Thailand. Vet Parasitol 2013; 197(3-4): 642-648. PMid:23953761. http://dx.doi.org/10.1016/j.vetpar.2013.07.015
» http://dx.doi.org/10.1016/j.vetpar.2013.07.015 - Sivakumar T, Okubo K, Igarashi I, Silva WK, Kothalawala H, Silva SSP, et al. Genetic diversity of merozoite surface antigens in Babesia bovis detected from Sri Lankan cattle. Infect Genet Evol 2013; 19: 134-140. PMid:23851021. http://dx.doi.org/10.1016/j.meegid.2013.07.001
» http://dx.doi.org/10.1016/j.meegid.2013.07.001 - Smith RD, Evans DE, Martins JR, Ceresér VH, Correa BL, Petraccia C, et al. Babesiosis (Babesia bovis) stability in unstable environments. Ann N Y Acad Sci 2000; 916(1): 510-520. PMid:11193666. http://dx.doi.org/10.1111/j.1749-6632.2000.tb05330.x
» http://dx.doi.org/10.1111/j.1749-6632.2000.tb05330.x - Souza FAL, Braga JFV, Pires LV, Carvalho CJS, Costa ÈA, Ribeiro MFB, et al. Babesiosis and anaplasmosis in dairy cattle in Northeastern Brazil. Pesq Vet Bras 2013; 33(9): 1057-1061. http://dx.doi.org/10.1590/S0100-736X2013000900002
» http://dx.doi.org/10.1590/S0100-736X2013000900002 - Stamatakis A, Hoover P, Rougemont J, Renner S. A rapid bootstrap algorithm for the RAxML Web servers. Syst Biol 2008; 57(5): 758-771. PMid:18853362. http://dx.doi.org/10.1080/10635150802429642
» http://dx.doi.org/10.1080/10635150802429642 - Suarez CE, Florin-Christensen M, Hines SA, Palmer GH, Brown WC, McElwain TF. Characterization of allelic variation in the Babesia bovis merozoite surface antigen 1 (MSA-1) locus and identification of a cross-reactive inhibition-sensitive MSA-1 epitope. Infect Immun 2000; 68(12): 6865-6870. PMid:11083806. http://dx.doi.org/10.1128/IAI.68.12.6865-6870.2000
» http://dx.doi.org/10.1128/IAI.68.12.6865-6870.2000 - Tattiyapong M, Sivakumar T, Ybanez AP, Ybanez RHD, Perez ZO, Guswanto A, et al. Diversity of Babesia bovis merozoite surface antigen genes in the Philippines. Parasitol Int 2014; 63(1): 57-63. PMid:24042058. http://dx.doi.org/10.1016/j.parint.2013.09.003
» http://dx.doi.org/10.1016/j.parint.2013.09.003 - Thompson JD, Higgins DG, Gibson TJ. CLUSTAL W: improving the sensitivity of progressive multiple sequence alignment through sequence weighting, position-specific gap penalties and weight matrix choice. Nucleic Acids Res 1994; 22(22): 4673-4680. PMid:7984417. http://dx.doi.org/10.1093/nar/22.22.4673
» http://dx.doi.org/10.1093/nar/22.22.4673 - Trindade HI, Silva GRA, Teixeira MCA, Sousa MG, Machado RZ, Freitas FLC, et al. Detection of antibodies against Babesia bovis and Babesia bigemina in calves from the region of Araguaína, State of Tocantins, Brazil. Rev Bras Parasitol Vet 2010; 19(3): 169-173. PMid:20943021. http://dx.doi.org/10.1590/S1984-29612010000300008
» http://dx.doi.org/10.1590/S1984-29612010000300008 - Trueman KF, Blight GW. The effect of age on resistance of cattle to Babesia bovis. Aust Vet J 1978; 54(6): 301-305. PMid:687298. http://dx.doi.org/10.1111/j.1751-0813.1978.tb02465.x
» http://dx.doi.org/10.1111/j.1751-0813.1978.tb02465.x - Wilkowsky SE, Farber M, Echaide I, Echaide ST, Zamorano PI, Dominguez M, et al. Babesia bovis merozoite surface protein-2c (MSA-2c) contains highly immunogenic, conserved B-cell epitopes that elicit neutralization-sensitive antibodies in cattle. Mol Biochem Parasitol 2003; 127(2): 133-141. PMid:12672522. http://dx.doi.org/10.1016/S0166-6851(02)00329-8
» http://dx.doi.org/10.1016/S0166-6851(02)00329-8 - Yokoyama N, Okamura M, Igarashi I. Erythrocyte invasion by Babesia parasites: current advances in the elucidation of the molecular interactions between the protozoan ligands and host receptors in the invasion stage. Vet Parasitol 2006; 138(1-2): 22-32. PMid:16504403. http://dx.doi.org/10.1016/j.vetpar.2006.01.037
» http://dx.doi.org/10.1016/j.vetpar.2006.01.037
Publication Dates
-
Publication in this collection
Dec 2017
History
-
Received
18 Sept 2017 -
Accepted
07 Nov 2017


