Abstract
The northwestern region of São Paulo was extensively deforested during the agricultural expansion in the last century and only small fragments of the original vegetation cover remained. In this study, we investigated how habitat features influence the composition, richness, and diversity of anurans in environments homogenized by agricultural activities. We sampled monthly six breeding ponds located in pasture areas during twelve months. We recorded ten environmental descriptors for each breeding pond. We found 18 anuran species. The breeding ponds were structurally similar, but species composition differed among them. The environmental descriptors influence varies for each species, as demonstrated by the different associations between species and environmental descriptors shown in the Canonical Correspondence Analysis (CCA). Seven of the ten environmental descriptors explained 67% of the species richness, showing that environmental characteristics influenced the occurrence of the different species. There is no such data set for the region and also for most Brazilian regions, despite its importance in guiding species-oriented conservation actions.
Amphibia; community ecology; environmental indicators; habitat use; beta diversity
ECOLOGY
Environmental heterogeneity: Anuran diversity in homogeneous environments
Rodrigo Augusto SilvaI; Itamar Alves MartinsII; Denise de C. Rossa-FeresIII
IPrograma de Pós-Graduação em Biologia Animal, Universidade Estadual Paulista. 15054-000 São José do Rio Preto, SP, Brazil. E-mail: silva7554@yahoo.com.br
IILaboratório de Zoologia, Instituto Básico de Biociências, Universidade de Taubaté. 12030-180 Taubaté, SP, Brasil. E-mail: istama@uol.com.br
IIIDepartamento de Zoologia e Botânica, Universidade Estadual Paulista. 15054-000 São José do Rio Preto, São Paulo, Brasil. E-mail: denise@ibilce.unesp.br
ABSTRACT
The northwestern region of São Paulo was extensively deforested during the agricultural expansion in the last century and only small fragments of the original vegetation cover remained. In this study, we investigated how habitat features influence the composition, richness, and diversity of anurans in environments homogenized by agricultural activities. We sampled monthly six breeding ponds located in pasture areas during twelve months. We recorded ten environmental descriptors for each breeding pond. We found 18 anuran species. The breeding ponds were structurally similar, but species composition differed among them. The environmental descriptors influence varies for each species, as demonstrated by the different associations between species and environmental descriptors shown in the Canonical Correspondence Analysis (CCA). Seven of the ten environmental descriptors explained 67% of the species richness, showing that environmental characteristics influenced the occurrence of the different species. There is no such data set for the region and also for most Brazilian regions, despite its importance in guiding species-oriented conservation actions.
Key words: Amphibia; community ecology; environmental indicators; habitat use, beta diversity.
A fundamental area of community ecology is the characterization and explanation of how a set of species manages to coexist in certain environmental situations (LEWINSOHN 1990). This in turn may shed light on which forces are involved in the assembly of biological communities (BROOKS & MCLENNAN 1993). Environmental heterogeneity has been recognized as one of the explanations for variation in species diversity (HUSTON 1994, FRASER 1998, MORENO-RUEDA & PIZARRO 2007, VASCONCELOS & ROSSA-FERES 2008, VASCONCELOS et al. 2009).
Amphibians are highly dependent on environmental quality (DUELLMAN & TRUEB 1994, MARCO 1993) and also strongly influenced by abiotic factors, such as rainfall, temperature, and vegetation (GASCON 1991, ETEROVICK 2003, PARRIS 2004, WERNER et al. 2007). Furthermore, several studies have shown that complex environments that provide more microhabitats harbor a higher number of species than homogeneous environments (e.g., BRANDÃO & ARAÚJO 1998, HADDAD 1998, BERNARDE & KOKUBUM 1999, CUNHA & REGO 2005, HADDAD & PRADO 2005, AFONSO & ETEROVICK 2007, BASTAZINI et al. 2007, VASCONCELOS et al. 2009).
In addition to environmental heterogeneity (ROSSA-FERES & JIM 1996, POMBAL JR 1997, BERNARDE & KOKUBUM 1999, VASCONCELOS & ROSSA-FERES 2005, VASCONCELOS et al. 2009), the behavioral plasticity of some species (CARDOSO et al. 1989, VASCONCELOS & ROSSA-FERES 2008) is also an important parameter in the diversity and coexistence of anurans. However, different studies have found varying degrees of segregation between anuran species in the same community, ranging from complete segregation to complete overlap (HEYER et al. 1990, ROSSA-FERES & JIM 1996, 2001, BERTOLUCI 1998, BERTOLUCI & RODRIGUES 2002, VASCONCELOS & ROSSA-FERES 2005). To understand this ecological issue, studies should be conducted at several spatial scales, ranging from geographical scales (VASCONCELOS et al. 2009) until the recognition of which attributes at a local scale, restricted to the characteristics of water bodies, could be good predictors of species richness and of the presence of a particular species (HAZELL et al. 2001).
In this paper, we evaluated the influence of environmental heterogeneity of breeding ponds on anuran richness and composition in a landscape homogenized by agricultural activities and also which environmental descriptors favor the occurrence of individual anuran species.
MATERIAL AND METHODS
This study was conducted in Icém (20º20'31"S, 49º11' 42"W, 449 m a.s.l.), in the northwest of the São Paulo State, Brazil. According to the Regional Agricultural Division (Divisão Regional Agrícola, DIRA) of São José do Rio Preto, the climate of the region is hot, with humid summers and dry winters. The rainy season's start (September-March) varies from year to year (ROSSA-FERES & JIM 2001), and it concentrates 85% of the annual rainfall; the cold, dry season (April-August) receives only 15% of the annual rainfall, which range from 1,100 to 1,250 mm (± 250 mm) (BARCHA & ARID 1971). The native vegetation consists of Semi-deciduous Forest and Cerrado patches (AB'SABER 2003) heavily devastated by agriculture, due to its fertile soil. Currently, only small, scattered fragments of this fertile land remain (SÃO PAULO 2000).
We sampled six breeding ponds in pasture areas with different physiognomic and structural characteristics: four permanent dams (PD1-PD4), one permanent (PM) and one temporary marsh (TM), apart 25-4000 m from each other, resulting in a total sampled area of 7.5 km2 (Fig. 1). We determined the environmental descriptors for each breeding pond during the rainy season, in which more than 99% of regional anuran fauna are found (VASCONCELOS & ROSSA-FERES 2005, SANTOS et al. 2007). Specifically, we recorded the following environmental descriptors as categorical variables: a) Size of the pond: 1 = small (up to 300 m2), 2 = medium (301-600 m2), and 3 = large (over 601 m2); b) Number of margin slopes: flat, slope and gully 1 = only one type of margin, 2 = two types of margins, 3 = three types of margins; c) Number of margin types: dry with vegetation, dry without vegetation, wetland with vegetation, wetland without vegetation 1 = only one type of margin, 2 = two types of mar-gins, 3 = three types of margins, and 4 = four types of margins; d) Predominant height of the marginal vegetation: 1 = 00-30 cm, 2 = 31-60 cm, 3 = 61-90 cm, and 4 = 91-120 cm; e) Percentage of pond surface covered with vegetation: 1 = 0%, 2 = 25%, 3 = 50%, 4 = 75%, or 5 = 100%; f) Number of plant clusters inside the pond: 1 = one cluster, 2 = 2-4 clusters, and 3 = 5-7 clusters; g) Number of vegetation types inside the pond: (ShV) shrubby vegetation, (ArV) arboreal vegetation, (M) macrophytes, (UHV) up-right herbaceous vegetation, (SHV) small herbaceous vegetation, (NS) nude soil 1 = 1 or 2 types of vegetation, 2 = 3 or 4 different vegetation, 3 = 4 to 6 types of vegetation; h) Number of marginal vegetation types: (ShV) shrubby vegetation, (ArV) arboreal vegetation, (M) macrophytes, (UHV) upright herbaceous vegetation, (SHV) small herbaceous vegetation, (NS) nude soil 1 = 1 or 2 types of vegetation, 2 = 3 or 4 different vegetation, 3 = 4 or 6 types of vegetation; i) Depth: 1 = shallow (30 cm), 2 = medium (31-60 cm), and 3 = deep (over 61 cm); j) Hydroperiod: 1 = permanent and 2 = temporary.
These environmental descriptors were considered in several ways, depending upon the type and purpose of the analysis applied. We applied the Shannon-Wiener index to the two data sets: quantitative data to verify the influence of pond heterogeneity on species composition and categories of environmental descriptors to verify the influence of pond heterogeneity on richness and diversity of communities (Tab. I, Fig. 1).
We sampled each breeding pond every two weeks during the rainy season (between September 2004 and May 2005) and monthly during the dry season (between June and August 2005), between 5 pm and 12 am. We randomized the sequence of sampling for each breeding pond. We estimated the abundance of each species using the technique of surveys at breeding sites (SCOTT & WOODWARD 1994), by counting all males in calling activity around the perimeter of each pond (see SILVA et al. 2010).
We estimated species richness using species accumulation curve and two richness estimators: Bootstrap and ACE (Abundance-based Coverage Estimator), with 500 randomizations. Calculations were performed in EstimateS v.7.0 (COLWELL 2004). The Bootstrap is an incidence-based estimator, whereas the ACE is a quantitative method based on the proportion of rare species in the sample (CULLEN JR et al. 2003, KREBS 1999).
We used the Shannon-Wiener index (KREBS 1999) to determine species diversity in each breeding pond and the Pielou index to quantify abundance evenness (ZAR 1999, MORIN 1999) using BioDiversity Pro 2.0 (MCALECEE et al. 1997). For these analyses, we considered species abundance as the maximum abundance of males of each species in all habitats (VASCONCELOS & ROSSA-FERES 2005). This procedure was adopted to avoid an overestimation of species abundance due to repeated counting of individuals, which occurs when one considers the total abundance of species as the sum of the abundance of repeated sampling over a season, and also to avoid under-estimation from using the average abundance of successive samples (VASCONCELOS & ROSSA-FERES 2005).
To test if species composition and pond heterogeneity corresponded, we applied a hierarchical cluster analysis with UPGMA as clustering method to the similarity matrix obtained by the Bray-Curtis index for the matrix containing the quantitative data of the environmental descriptors (KREBS 1999). Group stability was assessed by bootstrap analysis with 1,000 replicates (AKINS et al. 2005). The dendrogram was considered representative of the original data matrix when the cophenetic correlation coefficient (r) was equal to or greater than 0.8.
We used the inverse of the Jaccard similarity index (1-Cj; KREBS 1999) to evaluate differences in species composition among ponds. We considered values of 1-Cj > 0.50 as indica-tive of high species turnover (TUOMISTO 2010) between environments, i.e., high 1 diversity. We used a partial Mantel test (SMOUSE et al. 1986) to evaluate the influence of structural heterogeneity of ponds on species composition after removing the effect of geographic distance (km) between ponds. For this analysis the environmental heterogeneity was obtained by applying Shannon-Wiener index to quantitative data of the environmental descriptors of each pond. The method consists of comparing two matrices (A and B), after removing the effect of a third (C), using a correlation of C on A and B, and obtaining a residual matrix that represents the variation of matrices A and B, not explained by matrix C (SMOUSE et al. 1986). In this way, the two residual matrices can be compared normally. The partial Mantel test was performed in NTSYS 2.10S software (ROHLF 2000). Statistical significance was determined using Monte Carlo randomization (SMOUSE et al. 1986) with 5,000 permutations. Additionally, we used the Spearman correlation (rS, ZAR 1999) to test for the influence of the environmental heterogeneity on species richness, diversity, and evenness.
We used Canonical Correspondence Analysis (CCA) to test the influence of environmental descriptors on the occurrence and spatial distribution of species. CCA allows us to simultaneously represent the spatial ordering of samples, species and environmental variables, which indicates how the set of species optima varies with environment (TER BRAAK & SMILAUER 2002). To produce a CCA, a matrix containing the environmental descriptors and the abundance of species in each breeding pond was built. The partial Mantel test, similarity, cluster analyses, and CCA were performed with PAST v.2.0 (HAMMER et al. 2001).
RESULTS
We recorded 18 anuran species belonging to nine genera and five families (Tab. II). The species accumulation curve, built on the basis of species abundance, tended to reach an asymptote (Fig. 2). However, the two richness estimators indicated that two more species could be found in the sampled area (bootstrap = 20.15 ± 0 species; ACE = 18 ± 2 species).
We recorded the highest species richness at PD2 (13 species), and the highest total abundance in PD3 (106 individuals), but the PD2 and PD1 had the highest values of species diversity (H' = 2.34) and evenness (Pielou's e = 0.96), respectively (Tab. II). Leptodactylus furnarius Sazima & Bokermann, 1978, Physalaemus centralis Bokermann, 1962, Scinax fuscovarius (Lutz, 1925), Scinax similis (Cochran, 1952), Scinax fuscomarginatus (Lutz, 1925), and Rhinella schneideri (Werner, 1894) (33% of the total recorded species) occurred in only one breeding pond. Only Pseudopaludicola aff. falcipes and Hypsiboas albopunctatus (Spix, 1824), which represent 11% of the total species recorded, occurred in all ponds sampled (Tab. II).
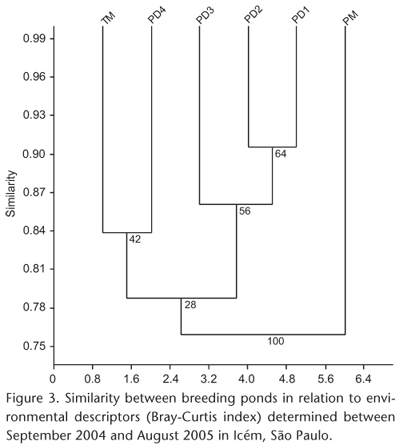
With the exception of the permanent marsh (PM), the remaining ponds are similar in structure (minimum similarity = 76%, bootstrap = 28%, Fig. 3). However, 1 diversity was high (1-Cj > 0.5) for 53% of the 15 combinations of sites (Tab. III). In order to identify the causes of this variation in species composition, we tested for the influence of environmental descriptors of each pond on species composition and abundance. Environmental heterogeneity influenced the composition and abundance of species (rM = -0.56, p = 0.04), as well as the richness (rS = 0.96, p = 0.002) and diversity of species in ponds (rS = 0.97, p = 0.01). Only species evenness was not correlated with environmental heterogeneity (rS = 0.48, p = 0.34).
We found some patterns in species association to environmental variables. Leptodactylus podicipinus (Cope, 1862), Leptodactylus fuscus (Schneider, 1799), Leptodactylus labyrinthicus (Spix, 1824), Eupemphix nattereri Steindachner, 1863, S. fuscovarius, and R. schneideri were associated with ponds with a great variety of margin slopes, whereas Elachistocleis bicolor (Guérin-Méneville, 1838) was associated with great number of vegetation clusters inside ponds. Pseudopaludicola aff. falcipes was associated with a large amount of marginal herbaceous vegetation. Leptodactylus furnarius occurred only in temporary ponds, and Physalaemus cuvieri Fitzinger, 1826 was more abundant in large ponds; Dendropsophus nanus (Boulenger, 1889) was associated with pond depth, and H. albopunctatus was associated with high vegetation bulk and height within ponds (Fig. 4). Thus, 70% of the quantified environmental descriptors explained the occurrence of 67% of species.
DISCUSSION
We cannot rule out the possibility of an increase in the number of species in the sampled area, because we recorded only 47% of the 38 species known to inhabit the northwestern region of São Paulo (ROSSA-FERES & JIM 2001, VASCONCELOS & ROSSA-FERES 2005, PRADO et al. 2008, SILVA 2009, SILVA et al. 2010, PROVETE et al. 2011). Although the great majority of these species are generalists with broad areas of occurrence (SANTOS et al. 2007), some are explosive breeders (NOMURA 2005, SANTOS et al. 2007) and were found during short periods of the year. Species with this reproductive pattern may not be recorded when the samplings are made once a month. Hylids was the most speciose group. This pattern is, consistent with different Brazilian biomes, such as the Atlantic and the Semi-deciduous Forests (e.g., HADDAD & SAZIMA 1992, BRANDÃO & ARAÚJO 1998, BERNARDE & MACHADO 2001, POMBAL JR & GORDO 2004, CONTE & MACHADO 2005).
We found more terrestrial (12 species from the families Leiuperidae, Leptodactylidae, Bufonidae, and Microhylidae) than arboreal species (six species of Hylidae). Besides biogeo-graphic processes, the higher richness of terrestrial species may be related to the low environmental heterogeneity of the ponds sampled, which are located in a pasture matrix with grasses as the main marginal vegetation type (CARDOSO et al. 1989, ROSSA-FERES & JIM 2001, SANTOS & ROSSA-FERES 2007, VASCONCELOS & ROSSA-FERES 2008, VASCONCELOS et al. 2009).
Species diversity has been measured by various indices (MAGURRAN 1988) that integrate species richness and evenness (KREBS 1999). Comparative studies are scarce, complicating the interpretation of results obtained with the application of these indices. Therefore, the two components of diversity have been considered independently instead of using diversity indices (JOST 2007). However, in this study, the diversity index reflected the environmental heterogeneity. The species richness and diversity were directly proportional to the environmental heterogeneity of the ponds sampled. This relationship probably reflects the decrease in the number of microhabitats, which reduces the possibility of spatial partitioning (MCARTHUR & LEVINS 1967, CARDOSO et al. 1989). The evenness was not affected by the environmental heterogeneity of breeding ponds. Because evenness is a measure of the degree of homogeneity in the distribution of species abundance in a community, a high value of evenness can be found in samples with either high or low species abundance. The low carrying capacity of a habitat may limit both the number of species that occupy an environment as well as species abundance (CARDOSO et al. 1989, GASCON 1991, HUSTON 1994, POMBAL JR 1997, BRANDÃO & ARAÚJO 1998, ETEROVICK 2003, VASCONCELOS & ROSSA-FERES 2008, VASCONCELOS et al. 2009). This explains how one homogeneous pond had similar evenness values to heterogeneous ponds, since the few species that occurred in that breeding pond presented low abundance.
The relationship between pond characteristics and their use by amphibians has a long history of research (e.g., COOKE & FRAZER 1976, DE FONSECA & JOCQUÉ 1982). The high species richness recorded in several Brazilian regions has commonly been attributed to high habitat heterogeneity (CARDOSO et al. 1989, POMBAL JR 1997, ARZABE et al. 1998, ARZABE 1999, BERNARDE & KOKUBUM 1999). Species segregation in communities can occur as a result of vegetation structure (PARRIS & MCCARTHY 1999, HAZELL et al. 2001, PARRIS 2004, AFONSO & ETEROVICK 2007, BASTAZINI et al. 2007, VASCONCELOS & ROSSA-FERES 2008, VASCONCELOS et al. 2009), hydroperiod (PARRIS & MCCARTHY 1999, BABBITT 2005, BURNE & GRIFFIN 2005, WERNER et al. 2007, VASCONCELOS et al. 2009), and pond size (RICKLEFS & LOVETTE 1999, BABBITT 2005, BURNE & GRIFFIN 2005, WERNER et al. 2007, SANTOS et al. 2007, PARDINI et al. 2010), among other factors, such as environmental heterogeneity and human population influence (ROSSA-FERES & JIM 2001, MORENORUEDA & PIZARRO 2007). More recent approaches can detect which environmental descriptors have greater influence on species composition (e.g., PARRIS 2004, AFONSO & ETEROVICK 2007, BASTAZINI et al. 2007, KELLER et al. 2009, VASCONCELOS et al. 2009). However, there is no consensus regarding the influence of different descriptors. In this study, habitat use was evaluated in breeding ponds with the same general structure (lentic ponds in pasture areas). But despite this condition, species composition differed among them, having been influenced by the degree of pond heterogeneity. This result is corroborated by CCA analysis, which allowed the detection of different associations between species and environmental descriptors, indicating that the influence of each descriptor was different for each species of the communities studied. The margin slope types influenced the occurrence of most species (33% of recorded species). However, seven out of the 13 species associated with some environmental descriptor were unique associations. This result is consistent with the conclusions of VASCONCELOS et al. (2009), who suggested that the influence of a single environmental descriptor might differ in different anuran communities.
ERNST & RÖDEL (2006) also observed responses to certain habitat characteristics, such as the presence or absence of specific breeding sites and tree size classes in forest environments. Other studies also indicate that specific differences for each species should not be neglected and could dramatically alter the analysis of anuran species composition in primary and secondary forests (ERNST & RÖDEL 2008).
Our results suggest that evaluating the importance of habitat type only by species richness does not provide all the necessary information to support species management and conservation plans, because the occurrence of a particular species or guild of species may vary due to small differences in certain habitat features (HAZELL et al. 2001, 2004).
In the sampled area, heterogeneous ponds supported a higher species richness and diversity, showing that environmental heterogeneity analyses provide valuable information about processes that regulate species richness and composition. Furthermore, the detection of environmental descriptors that favor the occurrence of each one of the species in a community is an important step for understanding the reproductive biology of species, to detect processes involved in community assembly, and to support species-oriented conservation and management.
ACKNOWLEDGMENTS
The authors thank Fausto Nomura, Fernando R. Silva, Michel Varajão Garey, Carolina P. Candeira, and Natacha Y. N. Dias for help in the fieldwork. We also thank Mr. Toninho Viana and Mr. Eduardo Torres Viana for allowing access to the study area and for their hospitality. Diogo B. Provete reviewed the English language. DCRF is a CNPq fellow.
LITERATURE CITED
Submitted: 09.IX.2010; Accepted: 29.VI.2011.
Editorial responsibility: Mauricio O. Moura
- AB'SABER, A.N. 2003. Os domínios da natureza no Brasil: potencialidades paisagísticas. São Paulo, Ateliê editorial, 160p.
- AFONSO, L.G. & P.C. ETEROVICK. 2007. Spatial and temporal distribution of breeding anurans in streams in Southeastern Brazil. Journal of Natural History 41 (13-16): 949-963.
- AKINS, R.B; H. TOLSON & B.R. COLE, B.R. 2005. Stability of response characteristics of a Delph panel: application of bootstrap data expansion. Medical Research Methodology 5 (37). doi: 10.1186/1471-2288-5-37.
- ARZABE, C. 1999. Reproductive activity patterns of anurans in two different altitudinal sites within the Brazilian Caatinga. Revista Brasileira de Zoologia 16 (3): 851-864.
- ARZABE, C; C.X. CARVALHO & M.A.G. COSTA. 1998. Anuran Assemblages in Crasto Forest Ponds (Sergipe State, Brazil): Comparative Structure and Calling Activity Patterns. Herpetological Journal 8: 111-113.
- BABBITT, K.J. 2005. The relative importance of weetland size and hydroperiod for amphibians in southern New Hampshire, USA. Wetlands Ecology Management 13 (3): 269-279.
- BARCHA, S.F. & F.M. ARID. 1971. Estudo da evapotranspiração na região norte-ocidental do Estado de São Paulo. Revista de Ciências da Faculdade de Ciências e Letras 1: 94-122.
- BASTAZINI, C.V.; J.F.V. MUNDURUCA; P.L. ROCHA & M.F. NAPOLI. 2007. Which environmental variables better explain changes in anuran community composition? A case study in the resting of Mata de São João, Bahia, Brazil. Herpetologica 63 (4): 459-471.
- BERNARDE, P.S. & M.N.C. KOKUBUM. 1999. Anurofauna do Município de Guararapes, Estado de São Paulo, Brasil (Amphibia, Anura). Acta Biológica Leopoldensia 21 (1): 89-97.
- BERNARDE, P.S. & R.A. MACHADO. 2001. Riqueza de espécies, ambientes de reprodução e temporada de vocalização da anurofauna em Três Barras do Paraná, Brasil (Amphibia: Anura). Cuadernos de Herpetologia 14 (2): 93-104.
- BERTOLUCI, J. 1998. Annual patterns of breeding activity of Atlantic rainforest anurans. Journal of Herpetology 32 (4): 607-611.
- BERTOLUCI, J. & J.T. RODRIGUES. 2002. Seasonal patterns of breeding activity of Atlantic Rainforest anurans at Boracéia, Southeastern Brazil. Amphibia-Reptilia 23: 161-167.
- BRANDÃO, R.A. & A.F.B. ARAÚJO. 1998. A herpetofauna da Estação Ecológica de Águas Emendadas, p. 9-21. In: J. MARINHO-FILHO; F.M. RODRIGUES & M.M. GUIMARÃES (Eds). Vertebrados da Estação Ecológica de Águas Emendadas. História Natural e Ecologia em um Fragmento de Cerrado do Brasil Central. Brasília, Ibama.
- BROOKS, D.R. & D.A. MCLENNAN. 1993. Historical ecology: examining phylogenetic components of community evolution, p. 267-280. In: R.E. RICKLEFS & D. SCHLUTER (Eds) Species diversity in ecological communities. Chicago, University of Chicago Press.
- BURNE, M.R. & C.R. GRIFFIN. 2005. Habitat associations of pool-breeding amphibians in eastern Massachusetts, USA. Wetlands Ecology Management 13 (3): 247-259.
- CARDOSO, A.J.; G.V. ANDRADE & C.F.B. HADDAD. 1989. Distribuição espacial em comunidade de anfíbios (Anura) no sudeste do Brasil. Revista Brasileira de Biologia 49 (1): 241-249.
- COLWELL, R.K. 2004. EstimateS 7.0: Statistical estimation of species richness and shared species from samples. Available online at: http://viceroy.eeb.unconn.edu/estimates [Accessed: 01/V/2006]
- COOKE, A.S. & J.F.D. FRAZER. 1976. Characteristics of newt breeding sites. Journal of Zoology 178: 223-236.
- CONTE, C.E. & R.A. MACHADO. 2005. Riqueza de espécies e distribuição espacial e temporal em comunidade de anuros (Amphibia, Anura) em uma localidade de Tijucas do Sul, Paraná, Brasil. Revista Brasileira de Zoologia 22 (4): 940-948.
- CULLEN JR, L.; T.P. BELTRAME; J.F. LIMA; C.V. PADUA; S.N. PADUA. 2003. Trampolins ecológicos e zonas de benefício múltiplo: ferramentas agroflorestais para a conservação de paisagens rurais fragmentadas na floresta atlântica brasileira. Natureza & Conservação 1 (1): 37:55.
- CUNHA, J. & F. REGO. 2005. Composição e estrutura da paisagem: sua relação com a riqueza dos anfíbios e répteis que ocorrem em Portugal Continental. Silva Lusitana 13 (1): 35-50.
- DE FONSECA, P.H. & R. JOCQUÉ. 1982. The palmate newt Triturus helveticus helveticus (Raz) in Flanders (Belgium). Distribution and habitat preferences. Biological Conservation 23: 297-307.
- DUELLMAN, W.E. & L. TRUEB. 1994. Biology of amphibians. Baltimore, McGraw-Hill, 642p.
- ERNST, R. & M-O. RÖDEL. 2006. Community assembly and structure of tropical leaf-litter anurans. Ecotropica 12: 113-129.
- ERNST, R. & M-O. RÖDEL. 2008. Patterns of community composition in two tropical tree frog assemblages: separating spatial structure and environmental effects in disturbed and undisturbed forests. Journal of tropical ecology 24 (2): 111-120.
- ETEROVICK, P.C. 2003. Distribution of anuran species among montane streams in south-eastern Brazil. Journal of Tropical Ecology 19: 219-228.
- FRASER, R.H. 1998. Vertebrate species richness at the mesoscale: relative roles of energy and heterogeneity. Global Ecology and Biogeography Letters 7: 215-220.
- GASCON, C. 1991. Population and community level analyses of species occurrences of central Amazonian rain forest tadpoles. Ecology 72 (5): 1731-1746.
- HADDAD, C.F.B. 1998. Biodiversidade dos anfíbios no Estado de São Paulo, p.15-26: In: R.M.C. CASTRO (Ed.). Biodiversidade do Estado de São Paulo, Brasil (Série Vertebrados). São Paulo, FAPESP.
- HADDAD, C.F.B. & I. SAZIMA. 1992. Anfíbios anuros da Serra do Japi p. 188-211. In: L.P.C. MORELLATO (Ed.). História Natural da Serra do Japi: ecologia e preservação de uma área florestal no sudeste do Brasil. Campinas, Editora UNICAMP, FAPESP, vol. 3.
- HADDAD, C.F.B. & C.P.A. PRADO. 2005. Reproductive modes in frogs and their unexpected diversity in the Atlantic Forest of Brazil. Bioscience 55 (3): 207-217.
- HAMMER, O.; D.A.T. HARPER & P.D. RYAN. 2001. PAST: Paleontological Statistic software package for education and data analysis. Paleontologia Eletronica 4 (1): 1-9. http://palaeoelectronica.org/2001_1/past/issue1_01.htm [Accessed: 04/X/ 2011]
- HAZELL, D.; R. CUNNINGHAM; D.E. LINDENMAYER; B. MACKEY & W. OSBORNE. 2001. Use of farm dams as frog distribution. Biological Conservation 102: 155-169.
- HAZELL, D.; J.M. HERO; D. LINDENMAYER & R. CUNNINGHAM. 2004. A comparison of constructed and natural habitat for frog conservation in an Australian agricultural landscape. Biological Conservation 119: 61-71.
- HEYER, W.R.; A.S. RAND; C.A.G. CRUZ; O.L. PEIXOTO & C.E. NELSON. 1990. Frogs of Boracéia. Arquivos de Zoologia 31 (4): 231-410.
- HUSTON, M.A. 1994. Biological Diversity, The coexistence of species on changing landscapes. Cambridge University Press, 681p.
- JOST, L. 2007. Partitioning diversity into independent alpha and beta components. Ecology 88 (10): 2427-2439.
- KELLER, A.; M-O. RÖDEL; K.E. LINSENMAIR & T.U. GRAFE. 2009. The importance of environmental heterogeneity for species diversity and assemblage structure in Bornean stream frogs. Journal of Animal Ecolology 78 (2): 305-314.
- KREBS, C.J. 1999. Ecological Methodology. Menlo Park, Addison Wesley Educational Publishers, 620p.
- LEWINSOHN, T.M. 1990. Concepções alternativas da organização de comunidades, p. 26-35. In: Atas do Encontro de Ecologia Evolutiva do Brasil. Rio Claro, Sociedade de Ecologia do Brasil.
- MACARTHUR, R. & R. LEVINS. 1967. The limiting similarity, convergence and divergence of coexisting species. American Naturalist 101 (921): 377-385.
- MAGURRAN, A.E. 1988. Ecological diversity and its measurement. New Jersey, Princeton University, 179p.
- MANLY, B.F.G. 1994. A primer of multivariate statistics. London, Chapman & Hall, 179p.
- MARCO, A. 1993. Impacto de radiación ultravioleta y contaminación em anfíbios. Munibe (Suppl 16): 44-55.
- MCALECEE, N.; PJ.D. LAMBSHEAH; G.L.J. PATERSON & J.G. GAGE. 1997. Bio Diversity Professional Beta-Version. London, The Natural History Museum, The Scottish Association for Marine Sciences.
- MORENO-RUEDA, G. & M. PIZARRO. 2007. The relative influence of climate, environmental heterogeneity, and human population on the distribution of vertebrate species richness in south-eastern Spain. Acta Oecologica 32 (1): 50-58.
- MORIN, P.J. 1999. Commity Ecology. Oxford, Blackwell Science, 424p.
- NOMURA, F. 2005. Ecologia reprodutiva e comportamento de forrageio e escavação de Dermatonotus muelleri (Boettger, 1885) (Anura, Microhylidae). Biota Neotropica 5 (1): 201-209.
- PARDINI, R; A.D.A. BUENO; T.A. GARDNER; P.I. PRADO & J.P. METZGER. 2010. Beyond the Fragmentation Threshold Hypothesis: Regime Shifts in Biodiversity Across Fragmented Landscapes. PLoS ONE 5 (10): 1-10.
- PARRIS, K.M. 2004. Environmental and spatial variables influence the composition of frogs assemblages in sub-tropical eastern Australia. Ecography 27 (3): 392-400.
- PARRIS, K.M. & M.MCCARTHY. 1999. What influences the structure of frog assemblages at forest streams? Australian Journal of Ecology 24: 495-502.
- POMBAL JR, J.P. 1997. Distribuição espacial e temporal de anuros (Amphibia) em uma poça permanente na Serra de Paranapiacaba, sudeste do Brasil. Revista Brasileira de Biologia 57 (4): 583-594.
- POMBAL JR, J.P. & M. GORDO. 2004. Anfíbios Anuros da Juréia, p. 234-256. In: O.A.M. MARQUES & W. DULEBA (Eds). Estação Ecológica Juréia-Itatins. Ambiente Físico, Flora e Fauna. Ribeirão Preto, Holos Editora, 386p.
- PRADO, V.H.M.; R.E. BORGES; F.R. SILVA; T.T. TOGNOLO & D.C. ROSSA-FERES. 2008. Notes on Geographic Distribution-Amphibia, Anura, Hylidae, Phyllomedusa azurea: Distribution extension. Check List 4 (1): 55-56.
- PROVETE, D.B.; M.V. GAREY; F.R. SILVA & D.C. ROSSA-FERES. 2011. Anurofauna do noroeste paulista: lista de espécies e chave de identificação para adultos. Biota 11 (2): 377-391.
- RICKLEFS, R.E. & I.J. LOVETTE. 1999. The roles of island area per se and habitat diversity in the species-area relationships of four Lesser Antillean faunal groups. Journal of Animal Ecolology 68: 1142-1160.
- ROHLF, F.J. 2000. Statistical power comparisons among alternative morphometric methods. American Journal of Physical Anthropology 111: 463-478.
- ROSSA-FERES, D.C. & J. JIM. 1996. Distribuição espacial em comunidade de girinos na região de Botucatu, São Paulo (Amphibia, Anura). Revista Brasileira de Biologia 56: 309-316.
- ROSSA-FERES, D.C. & J. JIM. 2001. Similaridade sítio de vocalização em uma comunidade de anfíbios anuros na região noroeste do Estado de São Paulo, Brasil. Revista Brasileira de Zoologia 18 (2): 439-454.
- SANTOS, T.G & D.C. ROSSA-FERES. 2007. Similarities in calling site and advertisement call among anuran amphibians in Southeastern Brazil. South American Journal of Herpetology 2 (1): 17-30.
- SANTOS, T.G.; D.C. ROSSA-FERES & L. CASATTI. 2007. Diversidade e distribuição espaço-temporal de anuros em região com pronunciada estação seca no sudeste do Brasil. Iheringia, Série Zoologia, 97 (1): 37-49.
- SÃO PAULO. 2000. Atlas das unidades de conservação ambiental do Estado de São Paulo. São Paulo Secretaria do Meio Ambiente.
- SCOTT JR, N.J. & B.D. WOODWARD. 1994. Standard techniques for inventory and monitoring, p. 118-125. In: W.R. HEYER; M.A. DONNELLY; R.W. MCDIARMID; L.A.C. HAYEK & M.S. FOSTER (Eds). Measuring and Monitoring Biological Diversity Standard Methods for Amphibians. Washington, Smithsonian Institution Press.
- SILVA, F.R. 2009. Amphibia, Anura, Microhylidae, Chiasmocleis albopunctata: Filing gap and geographic distribution map. Checklist 5 (2): 314-316.
- SILVA, F.R.; V.H.M. PRADO & D.C. ROSSA-FERES. 2010. Amphibia, Anura, Hylidae, Dendropsophus melanargyreus (Cope, 1887). Distribution extension, new state Record and geografphic distribution map. Checklist 6: 402-404.
- SMOUSE, P.E.; J.C. LONG & R.R. SOKAL. 1986. Multiple regression and correlation extensions of the Mantel test of matrix correspondence. Systematic Zoology 35 (4): 627-632.
- TER BRAAK, C.J.F. & P. SMILAUER. 2002. Canoco Reference manual and CanoDraw for Windows User's guide: Software for Canonical Community Ordination (version 4,5). Ithaca, Microcomputer Power.
- TUOMISTO, H. 2010. A consistent terminology for quantifying species diversity? Yes, it does exist. Oecologia 164 (4): 853-860.
- VASCONCELOS, T.S. & ROSSA-FERES, D.C. 2005. Diversidade, Distribuição Espacial e Temporal de Anfíbios anuros (Amphibia, Anura) na Região Noroeste do Estado de São Paulo, Brasil. Biota Neotropica 5 (2): 2-14.
- VASCONCELOS, T.S. & D.C. ROSSA-FERES. 2008. Habitat heterogeneity and use of physical and acoustic space in anuran communities in southeastern Brazil. Phyllomedusa 7 (2): 127-142.
- VASCONCELOS, T.S.; T.G. SANTOS; D.C. ROSSA-FERES & C.F.B. HADDAD. 2009. Influence of the environmental heterogeneity of breeding ponds on anuran assemblages from southeastern Brazil. Canadian Journal Zoology 87: 699-707.
- WERNER, E.E.; D.K. SKELLY; R.A. RELYEA & K.L. YUREWICZ. 2007. Amphibian species richness across environmental gradients. Oikos 116: 1697-1712.
- ZAR, J.H. 1999. Biostatistical analysis. New Jersey, Prentice Hall, 929p.
Publication Dates
-
Publication in this collection
11 Nov 2011 -
Date of issue
Oct 2011
History
-
Accepted
29 June 2011 -
Received
09 Sept 2010