Abstract
A major difficulty in the application of probabilistic models to estimations of mammal abundance is obtaining a data set that meets all of the assumptions of the model. In this paper, we evaluated the concordance correlation among three population size estimators, the minimum number alive (MNA), jackknife and the model suggested by the selection algorithm in CAPTURE (the best-fit model), using long-term data on three Brazilian small mammal species obtained from three different studies. The concordance correlation coefficients between the abundance estimates indicated that the probabilistic and enumeration estimators were highly correlated, giving concordant population estimates, except for one species in one of the studies. The results indicate the adequacy of using enumeration estimates as indexes for population size when scarce data do not allow for the use of probabilistic methods. Differences observed in the behavior of enumeration and probabilistic methods among species and studies can be related to the exclusive sampling design of each area, species-specific movement characteristics and whether a significant portion of the population could be sampled.
Atlantic Rainforest; capture-mark-recapture; Didelphimorphia; MNA; Rodentia
ECOLOGY
A comparison of abundance estimators for small mammal populations
Marcelle PachecoI, ** Corresponding author. E-mail: odonatadobrejo@gmail.com; Maja KajinI; Rosana GentileII; Priscilla L. ZangrandiI; Marcus V. VieiraI; Rui CerqueiraI
ILaboratório de Vertebrados, Instituto de Biologia, Universidade Federal do Rio de Janeiro. Caixa Postal 68020, 21941-617 Rio de Janeiro, RJ, Brazil
IILaboratório de Biologia e Parasitologia de Mamíferos Silvestres Reservatórios, Instituto Oswaldo Cruz, Fundação Oswaldo Cruz. Caixa Postal 926, 21040-360 Rio de Janeiro, RJ, Brazil
ABSTRACT
A major difficulty in the application of probabilistic models to estimations of mammal abundance is obtaining a data set that meets all of the assumptions of the model. In this paper, we evaluated the concordance correlation among three population size estimators, the minimum number alive (MNA), jackknife and the model suggested by the selection algorithm in CAPTURE (the best-fit model), using long-term data on three Brazilian small mammal species obtained from three different studies. The concordance correlation coefficients between the abundance estimates indicated that the probabilistic and enumeration estimators were highly correlated, giving concordant population estimates, except for one species in one of the studies. The results indicate the adequacy of using enumeration estimates as indexes for population size when scarce data do not allow for the use of probabilistic methods. Differences observed in the behavior of enumeration and probabilistic methods among species and studies can be related to the exclusive sampling design of each area, species-specific movement characteristics and whether a significant portion of the population could be sampled.
Key words: Atlantic Rainforest; capture-mark-recapture; Didelphimorphia; MNA; Rodentia.
Estimating the abundance of elusive populations is an important goal in many ecological studies. One commonly used method for estimating the abundance of small mammals is based on capture-mark-recapture data (SEBER 1986, BORCHERS & EFFORD 2008, KREBS et al. 2011). Many abundance estimators with different assumptions have been developed for this type of data. One of the most commonly used estimators is the minimum number alive (MNA; KREBS 1966), which is an enumeration method that requires closed populations (i.e., no births, deaths, immigration or emigration during the trapping period) and equal capture probabilities among all individuals. Because this estimator disregards individuals that were never captured but are present in the study area, MNA has been considered a negatively biased estimator and is thus the target of criticism by many authors (e.g., HALLET et al. 1991, NICHOLS & POLLOCK 1983); however, it is still broadly used, despite the criticism (POCOCK et al. 2004, MCKELVEY & PEARSON 2001). The apparent preference for MNA instead of other estimation techniques may be due to its simplicity and ease of use (HALLET et al. 1991), the difficulty of selecting the most appropriate estimator (SLADE & BLAIR 2000) and the erroneous idea that MNA is less affected than other methods by variable capture probabilities when probabilities of capture are high (NICHOLS & POLLOCK 1983).
Many other methods have been proposed for the estimation of population size in closed populations, attempting to avoid bias resulting from erroneous assumptions regarding detection and equal capture probabilities, all incorporating possible variations of the assumption of equal capture probabilities (BURNHAM & OVERTON 1978, 1979, OTIS et al. 1978, SEBER 1982, KREBS et al. 2011). These alternative models are named according to their sources of variation in capture probabilities (OTIS et al. 1978): Mt assumes equal capture probabilities among individuals but considers changes among capture occasions (i.e., time is the source of variation in capture probabilities); Mh assumes that individual heterogeneity is the source of variation in capture probabilities, and thus, groups of individuals (grouped according to age, sex, reproductive conditions or other individual features) have their own specific capture probabilities; Mb takes into account the behavioral response to capture as the source of variation in capture probabilities, where after the first capture, the probability of the same individual being captured may increase (trap-happy individuals) or decrease (trap-shy individuals); M0, the null model, considers no variation in capture probabilities between individuals. Other models have been proposed including two or more sources of variation in capture probabilities (Mtbh, Mbh, Mth and Mtb). These models were first compiled in the CAPTURE software program (OTIS et al. 1978), which provides a model selection procedure for the identification of the most appropriate model for a given data set. The model selection procedure of CAPTURE is based on the comparison of the absolute and relative fits of different models to the data set. The significance values of these tests are submitted to multivariate analysis, and the most appropriate model is the one that presents the maximum selection criterion value (OTIS et al. 1978).
Among the probabilistic models that account for only one source of variation in capture probabilities (Mt, Mb and Mh), the Mh model can occasionally have a large number of parameters (N+1 parameters: N and p1, p2, p3, ..., pN; N = population size and p = individual capture probability; OTIS et al. 1978). Because estimating these many parameters using capture-mark-recapture data is impossible (OTIS et al. 1978), two ways of estimating N under the Mh model are feasible: reducing the number of parameters or calculating the frequency of capture. The first can be executed via a moment-based estimator using sample coverage (CHAO et al. 1992) or via mixture models (DORAZIO & ROYLE 2003 and references therein). The second can be estimated using a jackknife estimator (BURNHAM & OVERTON 1978), which is a technique that was initially developed for first-order bias reduction (more recently generalized to eliminating higher-order bias), by drawing subsamples from the entire sample. This approach allows for a robust estimation of population size when capture probabilities vary among individuals (BURNHAM & OVERTON 1979).
The precise estimation of abundance, incorporating variable probabilities of capture, requires large amounts of data to satisfy the assumptions of probabilistic methods (GENTILE & FERNANDEZ 1999, SLADE & BLAIR 2000). Because obtaining the recommended sample size (50-200 individuals per taxon, depending on the capture probabilities; OTIS et al. 1978) from capture-mark-recapture data for mammals is difficult, primarily due to low local abundances and/or low capture/recapture rates, enumeration estimators of population size, such as the MNA, are still widely used in small mammal population studies, especially in the tropics (CROUZEILLES et al. 2010, GENTILE et al. 2004, LIMA et al. 2006, MESERVE et al. 2001, YUNGER et al. 2002).
Studies comparing probabilistic estimators with the MNA have shown that the enumeration estimator produces biased estimates when heterogeneity among individuals and behavioral responses to traps (trap shyness or trap happiness) are present and when capture probabilities are low (BOULANGER & KREBS 1994, EFFORD 1992, GENTILE & FERNANDEZ 1999, HILBORN et al. 1976, NICHOLS & POLLOCK 1983). Simple counts are sometimes selected over probabilistic estimators because they are easier to obtain, even though they may underestimate the actual abundance. In contrast, probabilistic methods can fail to obtain estimates in the absence of recaptures, but they include an estimate of uncertainty. This trade-off is sometimes difficult to resolve, as making strategic data analysis decisions depends in great part on the specific circumstances of a study, and thus, there are no general rules identifying a single best strategy.
Evaluations of the behavior of capture-mark-recapture estimators under field conditions are rare and show distinct results (PARMENTER et al. 2003). Here, we empirically assess the concordance among three distinct estimators from realistic field sample sizes that are considerably smaller than the recommended sample size (50-200 individuals per taxon depending on the capture probabilities - OTIS et al. 1978). We assessed the correlation between abundance estimates for three Brazilian small mammal species from three different data sets using an enumeration estimator (MNA) and two probabilistic estimators (jackknife and the most appropriate model selected by the algorithm in CAPTURE, which is hereafter named the best-fit model). We also compared the estimates of MNA with the 95% confidence interval of the estimates of the probabilistic methods to evaluate the level of concordance between these two classes of estimates. The precision of the estimates of the probabilistic estimators was also compared through the coefficients of variation of the abundance estimates of each occasion.
MATERIAL AND METHODS
This study included data from three sites in the state of Rio de Janeiro, southeastern Brazil: 1) Garrafão (22°28'12"S, 42°59'50"W) is an area of Atlantic Rainforest inside the Serra dos Órgãos National Park in Guapimirim Municipality. This area, a continuous forest transected by dirt roads and streams, is considered preserved. The vegetation is typical of hillside forests, with a high closed canopy and disturbed midstory (GENTILE et al. 2004). 2) Pamparrão (22°02'46"S, 42°41'21"W) is in a rural area with small rural properties that grow vegetable gardens, pasturelands and a few small Atlantic Forest fragments in Sumidouro municipality (D'ANDREA et al. 2000). 3) Restinga de Barra de Maricá (22°57'30"S, 42°50'W) is a restinga scrub in Maricá municipality. This area is covered by a patchwork of vegetation types on sand barrier beaches and coastal sandy plains. The vegetation forms continuous dense thickets of shrubs, bushes and low trees (CERQUEIRA et al. 1990).
Long-term studies on small mammal populations were conducted in these three sites using the capture-mark-recapture method. In Garrafão, bimonthly monitoring was conducted from April 1997 to October 2009 by the Laboratório de Vertebrados, Universidade Federal do Rio de Janeiro. The sampling area was divided into three 0.64 ha grids with 25 capture stations spaced 20 m apart. ShermanTM (Sherman Trap Co., Tallahassee, Florida, United States) and TomahawkTM (Tomahawk Live Trap Co., Tomahawk, Wisconsin, United States) traps were used. In Pamparrão, small mammal populations were monitored bimonthly from June 1991 to May 1996 by the Laboratório de Biologia e Parasitologia de Mamíferos Silvestres Reservatórios, FIOCRUZ. Wire-mesh live traps were placed along seven line transects, with capture stations spaced 13 m apart. At Restinga de Barra de Maricá, monitoring was conducted trimonthly within a 4 ha grid with 100 wire-mesh live traps spaced 20 m apart from January 1986 to July 1990 by the Laboratório de Vertebrados, UFRJ. In all study areas, the bait was a mixture of peanut butter, banana, oats and bacon, and the trapping sessions were limited to five consecutive days to enable the assumptions of no births, deaths, immigration or emigration that are included in closed population estimation methods.
The three small mammal species that were captured in higher frequencies were selected for analysis: Didelphis aurita (Wied-Neuwied, 1826), Philander frenatus (Olfers, 1827) and Akodon cursor (Winge, 1887). Although these three species were very common in the region and occurred in all sites, each species was captured in sufficient numbers for analysis at only two out of the three sites.
The abundance of each species was estimated using different approaches: 1) A simple counting method - MNA (KREBS 1966); 2) Two probabilistic models (OTIS et al. 1978): 2.1) The model that best fit the data (best-fit model), which was selected from among the closed population capture-mark-recapture models from OTIS et al. (1978) based on goodness-of-fit tests and the trappability pattern detected; 2.2) The jackknife estimator (from the Mh model), which is a bias reduction technique (BURNHAM & OVERTON 1979) and the most robust estimator from CAPTURE (OTIS et al. 1978, BOULANGER & KREBS 1996).
Estimators 2.1 and 2.2 were obtained using CAPTURE, a package incorporated into the MARK program (WHITE & BURNHAM 1999). All models from CAPTURE are contained within MARK, and MARK provides some additional likelihood models and other advantages over the CAPTURE program alone, such as the incorporation of time-specific and group-specific covariates into the model. However, most of the advanced models that can be built in MARK are extensions of the general M0, Mh, Mt and Mb models contained in CAPTURE. As our purpose was to obtain comparisons among the most commonly used estimators and because our data were sparse due to small sample sizes (less than 30 individuals captured per trapping occasion) and low recapture rates (WHITE et al. 1982), we tended to impose as few constraints as possible, and therefore, we preferred CAPTURE's simple but representative modeling. However, modeling in MARK permits the use of robust design models that assume population closure over short periods of time (normally separated by a longer period of time) but allow for dynamic changes to occur between such short periods. Such an approach includes the estimation of additional parameters and requires high-quality data for proper performance.
All of the abundance series estimated were converted to logarithms to approach normality. The population size estimates of each model were correlated pairwise using a concordance correlation analysis, which is appropriate for comparing two different measures of the same variable (LIN 1989). The concordance correlation coefficient consists of the product of the Pearson correlation coefficient and a bias correction factor, where the latter can be interpreted in similar terms as the R-squared determination coefficient in a linear regression. However, the concordance correlation coefficient quantifies the divergence of the compared series' values in a data series from the hypothetical "perfect correlation". Thus, the obtained accuracy coefficient in a concordance analysis (related to the accuracy between the compared series) is not to be confused with the accuracy of estimates of a latent variable, because to obtain the latter, some type of simulation would be required.
The 95% confidence interval obtained for each probabilistic method was compared with MNA values to verify whether the count estimates remained inside the interval. To assess the validity of an estimate of population size, the precision of the abundance estimates of the probabilistic estimators was described using the coefficient of variation (CV): CV below 20% indicate a precise abundance estimate; CV between 20% and 50% indicate that the estimates are useful for long-term monitoring studies; and CV above 50% suggest changes in the order of magnitude of the population sizes (e.g., changes from 10 to 100 - WHITE et al. 1982), that the model is inappropriate for the data or that the sources of variation in capture probability were not adequately accounted for.
RESULTS
A total of 1,058 individuals were trapped, including 543 D. aurita and 112 P. frenatus individuals from Garrafão (75 trapping occasions for both species); 108 D. aurita and 120 A. cursor individuals from Pamparrão (31 trapping occasions for both species); and 79 P. frenatus and 96 A. cursor individuals from Barra de Maricá (16 trapping occasions for both species).
In most cases, the best-fit model selected by CAPTURE for all three species was the null model M0, which assumes no variation among capture probabilities (58.26%; N = 242, i.e., percentage of trapping occasions for all three species and sites). The Mtbh model was selected in 17.36% of cases. The assumption of heterogeneity in capture probabilities (Mh model) was corroborated in 7.85% of cases. The assumption of variation in behavior (Mb model) was only supported in 1.24% of cases. Variation in behavior plus heterogeneity of capture probabilities (Mbh) was supported in 4.96% of cases, and variation over time plus heterogeneity of capture probabilities (Mth) was supported in 4.55% of cases. Variations over time (Mt) and over time and behavior (Mtb) were not detected. CAPTURE failed to estimate the abundance in 15.19% (jackknife) and 26.44% (the best-fit model) of cases.
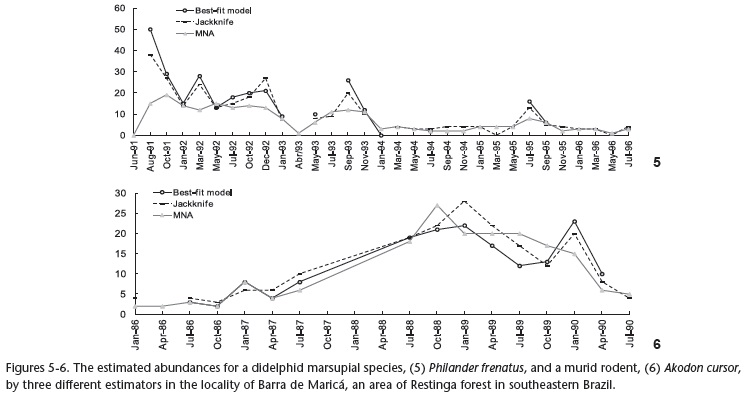
As expected, the MNA method generally underestimated the population sizes in relation to the other models, especially for the Garrafão and Pamparrão sites (Figs 1-6).
However, the high concordance correlation coefficients indicated that the probabilistic and enumeration estimators were highly correlated (Table I), reinforcing the coherence of abundance estimates for all species independent of the site studied, except for D. aurita in Garrafão, which presented the lowest concordance correlation coefficient in the overall study (rc = 0.53, between MNA and jackknife).
Most of the highest correlation coefficients were between the best-fit model selected by CAPTURE and jackknife, as expected. However, high correlation coefficients were also found between the MNA and the best-fit model estimates. The lowest correlation coefficients were between the jackknife and MNA estimators (Table I). The strongest correlations between estimators were reported for A. cursor, especially in Barra de Maricá. At this site, the P. frenatus population estimators also presented high correlation coefficients. At Pamparrão, high correlation coefficients were reported for the D. aurita and A. cursor abundance estimators. The weakest correlations between estimators were found for both species in Garrafão, primarily for D. aurita (Table I). At this site, when the population sizes estimated by the probabilistic models were high (sometimes more than 20 individuals), MNA tended to underestimate the population size more strongly.
Although the concordance correlation coefficients between the MNA and the probabilistic methods were high, the MNA estimates fell below the minimum 95% confidence intervals for both probabilistic methods most of the time (Table II). This was most evident for P. frenatus in Garrafão, where most of the MNA estimates resulted in values below the minimum 95% confidence intervals of the best-fit model and jackknife estimates. With the exception of P. frenatus at Garrafão, the MNA values were within the 95% confidence interval of the best-fit model selected by CAPTURE more often than that of the jackknife estimator. However, the 95% confidence interval for the estimates from the best-fit model selected by CAPTURE could not be estimated in most cases, particularly for P. frenatus in Garrafão (percentage of occasions where CAPTURE was able to estimate abundance, 65.71%, N = 35) and Barra de Maricá (57.14%, N = 14) and D. aurita in Pamparrão (59.25%, N = 27).
Both probabilistic estimators were shown to be precise, with coefficients of variation of less than 20% in the majority of cases for P. frenatus in Garrafão and Barra de Maricá (Table III). The only instance in which a probabilistic model was not appropriate, with a CV of more than 50%, was D. aurita in Garrafão using the best-fit model selected by CAPTURE.
DISCUSSION
The null model, which was the most frequently selected model among the probabilistic methods used in this study, is selected by CAPTURE as the best-fit model for estimating population size when capture probabilities do not vary among animals or when the data set is poor (i.e., small sample sizes and low recapture rates; WHITE et al. 1982). Because model comparisons by CAPTURE are based on chi-square goodness-of-fit tests, a large amount of data is necessary for a good performance of the model selection procedure. MENKENS & ANDERSON (1988) noted that CAPTURE frequently failed to select the correct model when simulated data sets included fewer than 50 individuals.
The frequent selection of the null model has already been reported for Didelphis virginiana Kerr, 1792 (HALLET et al. 1991) and for rodents and leporids (HAMMOND & ANTHONY 2006) in the United States. In these studies, the results were attributed to the poor performance of model selection tests, which was also a consequence of the small amount of data analyzed. We noticed a similar trend in our results, as most of the time, "test 1", which detected the presence or absence of heterogeneity comparing the relative fits of the null model and Mh, failed to perform. Thus, the null model could have been selected despite the presence of sources of variation that remained undetected by the goodness-of-fit tests. This fact could explain the high concordance correlation coefficients for the best-fit model selected by CAPTURE and the MNA estimates, as both methods assume equal capture probabilities among individuals and between capture sessions. However, the jackknife estimates, which were presumably less biased than the others (BURNHAM & OVERTON 1979), were also correlated with the MNA estimates, although not as strongly as the best-fit model selected by CAPTURE estimates. The bias of the MNA estimates was not constant throughout the study. In fact, the bias was greater when the jackknife estimates resulted in greater values of abundance, resulting in lower concordance correlation coefficients between the MNA and jackknife estimates.
Comparing the study designs, in Garrafão, the concordance correlation coefficients were the weakest for D. aurita and P. frenatus. The MNA estimator underestimated the population sizes of both species, especially for D. aurita, when the probabilistic estimates were high. This was most likely because this species moves long distances, and the designed grids (placed within a continuous forest area) only sampled a small fraction of the total population, resulting in low recapture rates compared to other, less vagile species (GENTILE & CERQUEIRA 1995). Moreover, when population sizes are high (periods of recruitment of new individuals or immigration), there are many unmarked animals in the population and many individuals who are just passing through the sampling grid, which increases the capture probabilities. Many of these animals, however, are only captured once, so that recapture probabilities decrease, resulting in greater peaks in the abundance estimates by probabilistic methods.
In Pamparrão, the concordance correlation coefficients for A. cursor and D. aurita were high, especially for A. cursor. The sampling design in Pamparrão, which occupies a valley, was limited on both sides by a relatively steep slope, with several capture transects distributed along the valley. These local characteristics in combination with the restricted movement patterns of A. cursor (GENTILE & CERQUEIRA 1995, GENTILE et al. 1997) might have restrained more individuals to the trapping area, increasing the captured proportion of the total local population. This resulted in more precise estimates of abundance by MNA and stronger concordance correlation coefficients than the coefficients for D. aurita, which is more vagile (GENTILE & CERQUEIRA 1995). The MNA underestimated the abundances of both species at this site only when the population sizes estimated by the probabilistic models were large, as for D. aurita in Garrafão. As D. aurita moves long distances, the Pamparrão sampling design (transects spread throughout a constraining valley) appears to have been more appropriate for this species than the design at Garrafão (small grids within a continuous forest area), potentially leading to a greater proportion of the population of D. aurita being sampled in Pamparrão.
Barra de Maricá was the site with the best MNA estimates and the highest coefficients of concordance. The MNA estimates were similar to the probabilistic ones in most cases for A. cursor and P. frenatus. The grid design at this site appeared to be very appropriate for these two species because it was large enough to access a representative sample of the local populations, and it benefited from natural borders on two sides that were difficult for animals to cross. Furthermore, A. cursor and P. frenatus both move short distances and have small home ranges at this site (x = 0.40 ha, SD = 0.24, N = 40 for P. frenatus; x = 0.28 ha, SD = 0.14, N = 24 for A. cursor - GENTILE & CERQUEIRA 1995, GENTILE et al. 1997). These factors could contribute to the high capture and recapture probabilities of the animals in this study area, leading to a high concordance between the estimates of the probabilistic and enumeration methods.
The greater disagreement between the MNA and jackknife estimates became apparent in the comparison between the MNA estimates and the 95% confidence interval of the probabilistic methods, as most of the time, the MNA fell below the lower bound of the CI of the jackknife estimates. This trend was less strong between the CI of the best-fit model selected by CAPTURE and the MNA but was particularly evident for P. frenatus in Garrafão and Barra de Maricá. Akodon cursor was the species that exhibited the best concordance results, mainly in Barra de Maricá, and the MNA estimates fell within the 95% confidence interval more frequently for this species than for the other species and sites. The MNA estimates fell within the 95% confidence interval more frequently in cases where the study design appeared to be more appropriate for the species, resulting in high capture and recapture rates and, consequently, a more representative sample of the local population under study, such as A. cursor and P. frenatus in Barra de Maricá and D. aurita in Pamparrão. However, whether an enumeration estimate remains within the 95% confidence interval of a probabilistic estimate should not be a criterion for deciding which estimate to use, but rather, it may support the precision of the enumeration estimates.
Regarding the precision of the probabilistic estimates, the least precise estimates were obtained for D. aurita in Garrafão and A. cursor in Pamparrão, where most of the coefficients of variation were higher than 50%. In contrast, the most precise estimates were obtained for P. frenatus and A. cursor in Barra de Maricá (Table III), as the coefficients of variation for the best-fit model selected by CAPTURE were below 20%, and for the jackknife, the coefficients of variation were between 20% and 50% most of the time, suggesting that the latter abundance estimates could be suitable for long-term monitoring purposes (OTIS et al. 1978). These results are in agreement with the concordance correlations between the estimates of the best-fit model selected by CAPTURE and MNA in most cases. In general, the jackknife estimates were less precise than those of the best-fit model selected by CAPTURE. This might be a consequence of the fact that more complex estimators that involve more parameters increase the model's fit but, in contrast, diverge away from parsimony (by having a higher number of parameters and thus being more complex). Similarly, the bias is greatly reduced by higher-order jackknives, but at the same time, it implies an increased sampling variance (BURNHAM & OVERTON 1979), leading to more accurate but less precise abundance estimates.
We noticed differences in the behavior of enumeration and probabilistic methods among species and sites. This might be due to the different sampling designs of each study area, as well as their particular habitat attributes, species-specific movement characteristics, and whether the sampling included a larger or smaller proportion of the population studied. These characteristics hinder the use of both MNA and probabilistic methods as absolute indices of abundance to compare different habitats, study designs and species. VIEIRA et al. (2004) suggested that differences in the capture/recapture rates of small mammals might result from the combination of sampling design, field methods, habitat and species studied, reinforcing our results. In general, we reported higher concordance correlation coefficients and lower coefficients of variation in Barra de Maricá, where the grid area allowed for the capture of almost all of the members of the local populations, leading to good estimates from both the enumeration and probabilistic methods. In contrast, Garrafão is a continuous Atlantic Rainforest area and was sampled using a narrow grid and thus presented the worst MNA and probabilistic estimates of population size compared to the other two sites, where larger proportions of the populations could actually be sampled.
With the exception of GENTILE & FERNANDEZ (1999), we do not have knowledge of any other study conducted in the Neotropics comparing different probabilistic methods and the MNA. Although the present study included very common and abundant species, such as A. cursor and D. aurita, the largest populations estimated by probabilistic methods comprised no more than 50 individuals (Figs 1-6). Before identifying a single most appropriate small mammal abundance estimator, more attention should be paid to the fact that data from capture-mark-recapture studies usually generate abundance values that are much lower than those currently recommended for CAPTURE models (PARMENTER et al. 2003). This fact makes the use of those methods occasionally difficult for tropical small mammal species, whose population densities appear to be smaller than those of the temperate regions (JOHNSON 1998), resulting in small sample sizes of small mammal populations and low capture/recapture rates and, consequently, inaccurate abundance estimates of probabilistic methods. Hence, it is necessary to test the relative differences between the available estimators when data are scarce (i.e., includes small sample sizes and low recapture rates) before determining the most appropriate estimator of small mammal abundance.
The sampling process and the subsequent loss of information generated are independent of local abundance or latitude, as there is nearly always some amount of uncertainty involved in the actual capture of an individual, regardless of whether the abundance of the species is high or low. Probabilistic models include this uncertainty, and this feature remains a convincing argument for their use. Any further decision on which type of probabilistic estimator to use should be carefully considered, and when utilizing scarce data, it should be taken into account that any further constraint imposed on a model increases the number of parameters, which may not be empirically supported by scarce data sets (i.e., small sample sizes and low recapture rates), resulting in even less reliable results than more simple parameterizations. The probabilistic estimators may fail to perform if there are no recaptures recorded, and this is where the simple counting methods may have the advantage. However, when the sampling design is carefully implemented and a large portion of the local population can be sampled, both methods seem to show similar behavior, which was evident in this study from the high concordance correlation coefficients between the MNA and probabilistic methods and the comparison of MNA and the 95% confidence intervals of the probabilistic method estimates. Therefore, despite the recognized bias, we may conclude that the MNA was a realistic index of small mammal population size, which was useful for comparisons between samples obtained through similar sampling methodologies.
ACKNOWLEDGMENTS
This study was supported by grants from Conselho de Aperfeiçoamento de Pessoal de Nível Superior (CAPES), Conselho Nacional de Desenvolvimento Científico e Tecnológico (CNPq), Fundação Carlos Chagas Filho de Amparo à Pesquisa do Estado do Rio de Janeiro (FAPERJ), Fundação Universitária José Bonifácio (FUJB), Projeto de Conservação e Utilização Sustentável da Diversidade Biológica - Ministério do Meio Ambiente - Fundo Mundial para o Meio Ambiente (PROBIO/MMA/GEF) and Projeto Nacional de Ações Integradas Público-Privadas para a Biodiversidade - Ministério da Ciência e Tecnologia - Fundo Mundial para o Meio Ambiente (PROBIO II/MCT/GEF) to M. Pacheco, R. Cerqueira, R. Gentile, and M. V. Vieira. M. Kajin received a post-doctoral fellowship from Conselho de Aperfeiçoamento de Pessoal de Nível Superior - Programa Nacional de Pós Doutorado (CAPES/PNPD). Several generations of students at the Laboratório de Vertebrados and the Laboratório de Biologia e Parasitologia de Mamíferos Silvestres Reservatórios assisted in the field. Technical and clerical aspects of the work were undertaken by N. P. Barros, R. Juazeiro and A. M. Marcondes. We thank two anonymous reviewers for their criticism.
LITERATURE CITED
Submitted: 09.VIII.2011; Accepted: 26.VIII.2012.
Editorial responsibility: Paulo Inácio de K.L. de Prado
- BORCHERS, D.L. & M.G. EFFORD. 2008. Spatially explicit maximum likelihood methods for capture-recapture studies. Biometrics 64: 377-385.
- BOULANGER, J. & C.J. KREBS. 1994. Comparison of capture-recapture estimators of snowshoe hare populations. Canadian Journal of Zoology 72: 1800-1807.
- BOULANGER, J.G. & C.J. KREBS. 1996. Robustness of capture-recapture estimators to sample biases in a cyclic snowshoe hare population. Journal of Applied Ecology 33: 530-542.
- BURNHAM, K.P. & W.S. OVERTON. 1978. Estimation of the size of a closed population when capture probabilities vary among animals. Biometrika 65 (3): 625-633.
- BURNHAM, K.P. & W.S. OVERTON. 1979. Robust estimation of population size when capture probabilities vary among animals. Ecology 60: 927-936.
- CERQUEIRA, R.; F.A.S. FERNANDEZ & M.F.N. QUÍNTELA. 1990. Mamíferos da restinga de Barra de Maricá, Rio de Janeiro. Papéis Avulsos de Zoologia 37: 141-157.
- CHAO, A.; S.-M. LEE & S.-L. JENG. 1992. Estimating population size for capture-recapture data experiments. Biometrics 45: 427-438.
- CROUZEILLES, R.; C.S. BARROS; F.A.S. FERNANDEZ. 2010. Philander frenatus e Metachirus nudicaudatus: competição ou necessidades ecológicas diferentes na Floresta Atlântica? Mastozoologia Neotropical 17 (1): 135-140.
- D'ANDREA, P.S.; R. GENTILE; R. CERQUEIRA; C.E.V. GRELLE & C. HORTA. 2000. Ecology of small mammals in a Brazilian rural area. Revista Brasileira de Zoologia 16: 611-620.
- DORAZIO, R.M. & J.A. ROYLE. 2003. Mixture models for estimating the size of closed population when capture rates vary among individuals. Biometrics 95 (2): 351-364.
- EFFORD, M. 1992. Comment - revised estimates of the bias in the minimum number alive estimator. Canadian Journal of Zoology 70: 628-631.
- GENTILE, R. & R. CERQUEIRA. 1995. Movement patterns of five species of small mammals in a Brazilian restinga. Journal of Tropical Ecology 11: 671-677.
- GENTILE, R. & F.A.S. FERNANDEZ. 1999. A field comparison of two capture-mark-recapture estimators of small mammal populations. Revista Brasileira de Zoologia 16: 1109-1114.
- GENTILE, R.; P.S. D'ANDREA & R. CERQUEIRA. 1997. Home ranges of Philander frenata and Akodon cursor in a Brazilian restinga (coastal shrubland). Mastozoología Neotropical 4: 105-112.
- GENTILE, R.; R. FINOTTI; V. RADEMAKER & R. CERQUEIRA. 2004. Population dynamics of four marsupials and its relation to resource production in the Atantic Forest in Southeastern Brazil. Mammalia 68: 109-119.
- HALLET, J.G.; M.A. O'CONNELL; G.D. SANDERS & J. SEIDENSTICKER. 1991. Comparison of population estimators for medium-sized mammals. Journal of Wildlife Management 55 (1): 81-93.
- HAMMOND, E.D. & R.G. ANTHONY. 2006. Mark-recapture estimates of population parameters for selected species of small mammals. Journal of Mammalogy 87 (3): 618-627.
- HILBORN, R.; J.A. REDFIELD & C.J. KREBS. 1976. On the reliability of enumeration for for mark and recapture census of voles. Canadian Journal of Zoology 54 (6): 1019-1024.
- JOHNSON, C.N. 1998. Rarity in the tropics: latitudinal gradients in distribution and abundance in Australian Mammals. Journal of Animal Ecology 67: 689-698.
- KREBS, C.J. 1966. Demographic changes in fluctuating populations of Microtus californicus Ecological Monographs 36: 239-273.
- KREBS, C.J.; R. BOONSTRA; S. GILBERT; D. REID; A.J. KENNEY & E.J. HOFER. 2011. Density estimation for small mammals from livetrapping grids: rodents in northern Canada. Journal of Mammalogy 85 (5): 974-981.
- LIMA, M.; M.A. PREVITALI & P.L. MESERVE. 2006. Climate and small rodent dynamics in semi-arid Chile: the role of lateral and vertical perturbations and intra-specific processes. Climate Research 30: 125-132.
- LIN, L.I.K. 1989. A concordance correlation coefficient to evaluate reproducibility. Biometrics 45: 255-268.
- MCKELVEY, K.S. & D.E. PEARSON. 2001. Population estimation with sparse data: the role of estimators versus indices revisited. Canadian Journal of Zoology 79: 1754-1765.
- MENKENS JR, G.E. & S.H. ANDERSON. 1988. Estimation of small-mammal population size. Ecology 69: 1952-1959.
- MESERVE, P.L.; W.B. MILSTEAD & J.R. GUITIÉRREZ. 2001. Results of a food addition experiment in a north-central Chile small mammal assemblage: evidence for the role of "bottom-up" factors. Oikos 94: 548-556.
- NICHOLS, J.D. & K.H. POLLOCK. 1983. Estimation methodology in contemporary small mammal capture-recapture studies. Journal of Mammalogy 64: 253-260.
- OTIS, D.L.; G.C. BURNHAM; G.C. WHITE & D.R. ANDERSON. 1978. Statistical inference from capture data on closed animal populations. Wildlife Monographs 62: 1-135.
- PARMENTER, R.R.; T.L. YATES; D.R. ANDERSON; K.P. BURNHAM; J.L. DUNNUM; A.B. FRANKLIN; M.T. FRIGGENS; B.C. LUBOW; M. MILLER; G.S. OLSON; C.A. PARMENTER; J. POLLARD; E. REXSTAD; T.M. SHENK; T.R. STANLEY & G.C. WHITE. 2003. Small-mammal density estimation: a field comparison of grid-based vs. web-based density estimators. Ecological Monographs 73 (1): 1-26.
- POCOCK, M.J.; A.C. FRANTZ; D.P. COWAN; P.C.L. WHITE & J.B. SEARLE. 2004. Tapering bias in inherent in minimum number alive (MNA) population indices. Journal of Mammalogy 92 (5): 959-962.
- SEBER, G.A.F. 1982. The Estimation of animal abundance and related parameters. London, Charles Griffin, 654p.
- SEBER, G.A.F.1986. A review of estimating animal abundance. Biometrics 42: 267-292.
- SLADE, N.A. & S.M. BLAIR. 2000. An empirical test of using counts of individuals captured as indices of population size. Journal of Mammalogy 81: 1035-1045.
- VIEIRA, M.V.; C.E.V. GRELLE & R. GENTILE. 2004. Differential trappability os small mammals in three habitats of Southeastern Brazil. Brazilian Journal of Biology 64 (4): 895-900.
- WHITE, G.C. & K.P. BURNHAM. 1999. Program MARK: survival estimation from populations of marked animals. Bird Study 46 Supplement 1: 120-138.
- WHITE, G.C.; D.R. ANDERSON; K.P. BURNHAM & D.L. OTIS. 1982. Capture-recapture and removal methods for sampling closed populations. Los Alamos, Los Alamos National Laboratory, 235p.
- YUNGER, J.A.; P.L. MESERVE & J.R. GUITIÉRREZ. 2002. Small-mammal foraging behavior: mechanisms for coexistence and implication for population dynamics. Ecological Monographs 17 (2): 561-577.
Publication Dates
-
Publication in this collection
09 May 2013 -
Date of issue
Apr 2013
History
-
Received
09 Aug 2011 -
Accepted
26 Aug 2012