Abstract
This study evaluates whether humic acid (HA; Aldrich) protects the silver catfish, Rhamdia quelen (Quoy & Gaimard, 1824), against exposure to acidic pH. Survival, levels of Na+, Cl- and K+ plasma, hematocrit, hemoglobin and erythrocyte morphometry were measured. Fish were exposed to 0, 10, 25 and 50 mg L 1 HA at four pH levels: 3.8, 4.0, 4.2 and 7.0 up to 96 hours. None of the fish exposed to pH 3.8 survived for 96 hours into the experiment, and survival of fish subjected to pH 4.0 decreased when HA concentration increased. Plasma Na+ levels decreased when pH was acidic, with no influence of HA, while Cl- levels declined at low pH with increased HA concentration. The levels of K+ at pH 4.0 and 4.2 increased without HA. Hematocrit and hemoglobin augmented under the effect of HA. At pH 4.0 and 4.2, erythrocytes of fish not exposed to HA were smaller, an effect that was partially offset by the presence of HA, since the values at pH 7.0 were higher. Although HA showed some positive effects changes in hematological and plasma K+ª in silver catfish caused by exposure to acidic pH, the overall findings suggest that HA does not protect this species against acidic pH because it increased mortality and Cl- loss at pH 4.0.
Blood parameters; humic acid; plasma ion levels; survival
Dissolved organic matter, an integral part of all ecosystems, results from the decay of
plant and animal debris (Thurman 1985Thurman EM (1985) Organic geochemistry of natural waters. Dordrecht,
Martinus Nijhof, Dr. W. Junk Publishers, 507p.). It comprises
humic, fulvic, and other organic acids, and is usually quantified as dissolved organic
carbon (DOC) (Wood et al. 2011Wood CM, Al-Reasi HA, Scott DS (2011) The two faces of DOC. Aquatic
Toxicology 105S: 3-8. doi: 10.1016/j.aquatox.2011.03.007
https://doi.org/10.1016/j.aquatox.2011.0...
). DOC is known to
positively regulate several biotic/abiotic processes (Steinberg et al. 2007Steinberg CEW, Saul N, Pietsch K, Meinelt T, Rienau S, Menzel R (2007)
Dissolved humic substances facilitate fish life in extreme aquatic environments and
have the potential to extend the lifespan of Caenorhabditis elegans. Annals of
Environmental Science 1: 81-90., Wood et al. 2011Wood CM, Al-Reasi HA, Scott DS (2011) The two faces of DOC. Aquatic
Toxicology 105S: 3-8. doi: 10.1016/j.aquatox.2011.03.007
https://doi.org/10.1016/j.aquatox.2011.0...
).
In blackwaters, such as those found in forest streams in the Amazon, coastal lagoons in
southeastern Brazil, Finnish and Swedish lakes, and Canadian wetlands, DOC may range from
10 to 300 mg CL-1, while its average content in freshwater systems elsewhere is
0.5-4.0 mg CL-1 (Thurman 1985Thurman EM (1985) Organic geochemistry of natural waters. Dordrecht,
Martinus Nijhof, Dr. W. Junk Publishers, 507p., Küchler et al. 2000Küchler IL, Miekeley N, Forsberg BR (2000) A contribution to the
chemical characterization of rivers in the rio Negro basin, Brazil. Journal of the
Brazilian Chemical Society 11: 286-292. doi:
10.1590/S0103-50532000000300015
https://doi.org/10.1590/S0103-5053200000...
, Farjalla et al. 2009Farjalla VF, Amado AM, Suhett AL, Meirelles-Pereira F (2009) DOC removal
paradigms in highly humic aquatic ecosystems. Environmental Science and Pollution
Research 16: 531-538. doi: 10.1007/s11356-009-0165-x
https://doi.org/10.1007/s11356-009-0165-...
). The high levels of DOC account for the acidity of the
aquatic environment. In order to thrive in acidic environments, organisms need a certain
degree of specialization in their osmoregulatory organs (Matsuo & Val 2007Matsuo AYO, Val AL (2007) Acclimation to humic substances prevents whole
body sodium loss and stimulates branchial calcium uptake capacity in cardinal tetras
Paracheirodon axelrodi (Schultz) subjected to extremely low pH. Journal of Fish
Biology 70: 989-1000. doi: 10.1111/j.1095-8649.2007.01358.x
https://doi.org/10.1111/j.1095-8649.2007...
).
Low pH (pH 4-5) induces ion loss (Zaions &
Baldisserotto 2000Zaions MI, Baldisserotto B (2000) Na+ and K+ body levels and survival of
fingerlings of Rhamdia quelen (Siluriformes, Pimelodidae) exposed to acute changes of
water pH. Ciência Rural 30: 1041-1045. doi:
10.1590/S0103-84782000000600020
https://doi.org/10.1590/S0103-8478200000...
, Wood et al. 1998Wood CM, Wilson RW, Gonzalez RJ, Patrick ML, Bergaman HL, Narahara A,
Val AL (1998) Responses of an Amazonian teleost, the tambaqui (Colossoma macropomum)
to low pH in extremely soft water. Physiologycal and Biochemical Zoology 71:
658-670.,
2002Wood CM, Matsuo AYO, Gonzalez RJ, Wilson RW, Patrick ML, Val AL (2002)
Mechanisms of ion transport in Potamotrygon, a stenohaline freshwater elasmobranch
native to the ion-poor blackwaters of the Rio Negro. Journal of Experimental Biology
205: 3039-3054., 2003Wood CM, Matsuo AYO, Wilson RW, Gonzalez RJ, Patrick ML, Playle RC, Val
AL (2003) Protection by natural blackwater against disturbances in ion fluxes caused
by low pH exposure in freshwater stingrays endemic to the Rio Negro. Physiological
and Biochemical Zoology 76: 12-27. doi: 10.1086/367946
https://doi.org/10.1086/367946...
, Gonzalez et al. 1998Gonzalez RJ, Wood CM, Wilson RW, Patrick ML, Bergman HL, Narahara A, Val
AL (1998) Effects of water pH and calcium concentration on ion balance in fish of the
Rio Negro, Amazon. Physiological Zoology 71: 15-22., 2002Gonzalez RJ, Wilson RW, Wood CM, Patrick ML, Val AL (2002) Diverse
strategies for ion regulation in fish collected from the ion-poor, acidic Rio Negro.
Physiological and Biochemical Zoology 75: 37-47. doi: 10.1086/339216
https://doi.org/10.1086/339216...
, Bolner &
Baldisserotto 2007Bolner KCS, Baldisserotto B (2007) Water pH and urinary excretion in
silver catfish Rhamdia quelen. Journal of Fish Biology 70: 50-64. doi:
10.1111/j.1095-8649.2006.01253.x
https://doi.org/10.1111/j.1095-8649.2006...
, Matsuo & Val 2007Matsuo AYO, Val AL (2007) Acclimation to humic substances prevents whole
body sodium loss and stimulates branchial calcium uptake capacity in cardinal tetras
Paracheirodon axelrodi (Schultz) subjected to extremely low pH. Journal of Fish
Biology 70: 989-1000. doi: 10.1111/j.1095-8649.2007.01358.x
https://doi.org/10.1111/j.1095-8649.2007...
,
Duarte et al. 2013Duarte RM, Ferreira MS, Wood CM, Val AL (2013) Effect of low pH exposure
on Na+ regulation in two cichlid fish species of the amazon. Comparative Biochemistry
and Physiology a-Molecular & Integrative Physiology 166: 441-448. doi:
10.1016/j.cbpa.2013.07.022
https://doi.org/10.1016/j.cbpa.2013.07.0...
) and the interference with
gill ionoregulatory mechanisms may also trigger hematological disturbances. Ionic dilution,
potentiated by the plasma acidosis prompted by H+ entry, affects body fluid
distribution. This could promote reduction in plasma volume, swelling of erythrocytes or
splenic contraction, resulting in elevation of the hematocrit (Milligan & Wood 1982Milligan CL, Wood CM (1982) Disturbances in haematology, fluid volume
distribution and circulatory function associated with low environmental pH in the
rainbow trout, Salmo Gairdneri. Journal of Experimental Biology 99:
397-415.). Despite being highly responsible for the
acidic nature of blackwaters, there is evidence that DOC protects native fish from the
deleterious effects of low pH, reducing ion loss (Wood et
al. 1998Wood CM, Wilson RW, Gonzalez RJ, Patrick ML, Bergaman HL, Narahara A,
Val AL (1998) Responses of an Amazonian teleost, the tambaqui (Colossoma macropomum)
to low pH in extremely soft water. Physiologycal and Biochemical Zoology 71:
658-670., 2002Wood CM, Matsuo AYO, Gonzalez RJ, Wilson RW, Patrick ML, Val AL (2002)
Mechanisms of ion transport in Potamotrygon, a stenohaline freshwater elasmobranch
native to the ion-poor blackwaters of the Rio Negro. Journal of Experimental Biology
205: 3039-3054., 2003Wood CM, Matsuo AYO, Wilson RW, Gonzalez RJ, Patrick ML, Playle RC, Val
AL (2003) Protection by natural blackwater against disturbances in ion fluxes caused
by low pH exposure in freshwater stingrays endemic to the Rio Negro. Physiological
and Biochemical Zoology 76: 12-27. doi: 10.1086/367946
https://doi.org/10.1086/367946...
, 2011Wood CM, Al-Reasi HA, Scott DS (2011) The two faces of DOC. Aquatic
Toxicology 105S: 3-8. doi: 10.1016/j.aquatox.2011.03.007
https://doi.org/10.1016/j.aquatox.2011.0...
, Gonzalez et al. 1998Gonzalez RJ, Wood CM, Wilson RW, Patrick ML, Bergman HL, Narahara A, Val
AL (1998) Effects of water pH and calcium concentration on ion balance in fish of the
Rio Negro, Amazon. Physiological Zoology 71: 15-22., 2002Gonzalez RJ, Wilson RW, Wood CM, Patrick ML, Val AL (2002) Diverse
strategies for ion regulation in fish collected from the ion-poor, acidic Rio Negro.
Physiological and Biochemical Zoology 75: 37-47. doi: 10.1086/339216
https://doi.org/10.1086/339216...
, Matsuo & Val 2007Matsuo AYO, Val AL (2007) Acclimation to humic substances prevents whole
body sodium loss and stimulates branchial calcium uptake capacity in cardinal tetras
Paracheirodon axelrodi (Schultz) subjected to extremely low pH. Journal of Fish
Biology 70: 989-1000. doi: 10.1111/j.1095-8649.2007.01358.x
https://doi.org/10.1111/j.1095-8649.2007...
). According
to some studies, the occurrence of various charged functional groups in the heterogeneous
compounds of DOC may change fundamental properties of the gill epithelium, such as the
transepithelial potential, thus altering membrane permeability and stimulating ion uptake
(Wood et al. 2011Wood CM, Al-Reasi HA, Scott DS (2011) The two faces of DOC. Aquatic
Toxicology 105S: 3-8. doi: 10.1016/j.aquatox.2011.03.007
https://doi.org/10.1016/j.aquatox.2011.0...
). Humic acid also reduces
respiratory stress in fish exposed to slightly acidic water, but increases it at more
acidic waters (Holland et al. 2014Holland A, Duivenvoorden LJ, Kinnear SHW (2014) The double-edged sword
of humic substances: contrasting their effect on respiratory stress in eastern
rainbow fish exposed to low pH. Environmental Science and Pollution Research 21:
1701-1707. doi: 10.1007/s11356-013-2031-0
https://doi.org/10.1007/s11356-013-2031-...
) and decreases
lipid peroxidation and modulates the antioxidant system (Riffel et al. 2014Riffel APK, Saccol EMH, Finamor IA, Ourique GM, Gressler LT, Parodi T,
Goulart LOR, Llesuy S, Baldisserotto B, Pavanato MA (2014) Humic acid and moderate
hypoxia alter oxidative and physiological parameters in different tissues of silver
catfish (Rhamdia quelen). Journal of Comparative Physiology B 184: 469-482. doi:
10.1007/s00360-014-0808-1
https://doi.org/10.1007/s00360-014-0808-...
). In opposition to the several findings regarding the effects
of DOC on ionoregulatory disturbances, respiratory stress and antioxidant system, no
evidence has been documented about its influence on the hematology of fish subjected to
acidic pH.
This study evaluated whether humic acid (HA), one of the major components of DOC, would
offer the silver catfish, Rhamdia quelen (Quoy & Gaimard, 1824),
protection against the physiological disturbances induced by low pH. This species does not
naturally inhabit DOC-enriched, acidic waters, so it is not adapted to such conditions.
However, different water quality parameters, including pH and DOC, are present in southern
Brazil, where this species is widely cultivated. The outcome of the interaction between
such variables should be investigated to improve the rearing conditions of this fish. In
laboratory settings, silver catfish juveniles survive for at least 96 hours in the pH 4-9
range (Zaions & Baldisserotto 2000Zaions MI, Baldisserotto B (2000) Na+ and K+ body levels and survival of
fingerlings of Rhamdia quelen (Siluriformes, Pimelodidae) exposed to acute changes of
water pH. Ciência Rural 30: 1041-1045. doi:
10.1590/S0103-84782000000600020
https://doi.org/10.1590/S0103-8478200000...
), but
exposure to pH 5.0 is enough to reduce growth in this species (Copatti et al. 2005Copatti CE, Codebella IJ, Radünz Neto J, Garcia LO, Rocha MC,
Baldisserotto B (2005) Effect of dietary calcium on growth and survival of silver
catfish fingerlings, Rhamdia quelen (Heptapteridae), exposed to different water pH.
Aquaculture Nutrition 11: 345-350. doi:
10.1111/j.1365-2095.2005.00355.x
https://doi.org/10.1111/j.1365-2095.2005...
). Therefore, if humic acid has a protective effect
on silver catfish exposed to acidic waters, it could reduce the deleterious effect of low
pH and improve growth in this species.
MATERIAL AND METHODS
Juvenile silver catfish (n = 240, 73.43 ± 3.5 g, 20.32 ± 1.22 cm, voucher number 19612, Ichthyology Laboratory, Universidade Federal do Rio Grande do Sul) were acquired from a commercial fishery in Santa Maria, southern Brazil, and acclimated in the Laboratório de Fisiologia de Peixes, Universida de Federal de Santa Maria (UFSM) for three weeks. The fish were equally distributed in 8 tanks of 250 L and kept in dechlorinated tap water under constant aeration (22.14 ± 1.5°C, 6.05 ± 0.45 mg L-1 dissolved oxygen (DO), pH 7.45 ± 0.13 and hardness 24.7 ± 3.9 mg CaCO3 L-1). The water was totally renewed every second day and siphoning was performed daily two hours after feeding. The fish were fed commercial food for juveniles with 42% crude protein once a day.
Lyophilized HA (CAT: 0.675-2 Aldrich(r) H1 - HA sodium salt) was the source
of DOC used in the tests. It was dissolved in water (the same water used in the
acclimation tanks) and agitated for 12 hours in a magnetic stirrer to prepare the stock
solution. It was not possible to measure the concentration of DOC in the experimental
solutions, but estimation of DOC concentration was made based on the fact that the
commercial HA corresponded to ~40% DOC (McGeer et al.
2002McGeer JC, Szebedinszky C, McDonald DG, Wood CM (2002) The role of
dissolved organic carbon in moderating the bioavailability and toxicity of Cu to
rainbow trout during chronic waterborne exposure. Comparative Biochemistry and
Physiology C 133: 147-160. doi: 10.1016/S1532-0456(02)00084-4
https://doi.org/10.1016/S1532-0456(02)00...
). HA was tested at 0 (control), 10, 25 and 50 mg L-1 HA, the
latter corresponding to the nominal DOC concentration of 20 mg C L-1. These
concentrations were chosen because they are within the range observed in the water of
the rio Negro Basin (Küchler et al. 2000Küchler IL, Miekeley N, Forsberg BR (2000) A contribution to the
chemical characterization of rivers in the rio Negro basin, Brazil. Journal of the
Brazilian Chemical Society 11: 286-292. doi:
10.1590/S0103-50532000000300015
https://doi.org/10.1590/S0103-5053200000...
). At
each concentration of HA, four pH ranges were tested, with the following minimum values:
3.8, 4.0, 4.2 and 7.0 (Table 1). The acidic pH
tested in the present study were near the most acidic pH (pH 4.0) that allows 100%
survival in silver catfish (Zaions & Baldisserotto
2000Zaions MI, Baldisserotto B (2000) Na+ and K+ body levels and survival of
fingerlings of Rhamdia quelen (Siluriformes, Pimelodidae) exposed to acute changes of
water pH. Ciência Rural 30: 1041-1045. doi:
10.1590/S0103-84782000000600020
https://doi.org/10.1590/S0103-8478200000...
). A pH meter DMPH-2 (Digimed, São Paulo, Brazil) was used to measure the
variable four times a day and adjustments to the minimum values within each range were
made with sulfuric acid 1 M when necessary. The water in the experimental aquaria was
not renewed during exposure time.
Juveniles were fasted for 24 hours prior to being transfered to 40 L aquaria (16
treatments, three replicates of each treatment, five fish per replicate) for the 96-h
experiment. Survival was observed four times a day and the dead fish were removed from
the aquaria. Fish that survived up to the end of the experimental period were
anesthetized with eugenol 50 mg L-1 (Cunha et
al. 2010Cunha MA, Zeppenfeld CC, Garcia LO, Loro VL, Fonseca MB, Emanuelli T,
Veeck APD, Copatti CE, Baldisserotto B (2010) Anesthesia of silver catfish with
eugenol: time of induction, cortisol response and sensory analysis of fillet. Ciência
Rural 40: 2107-2114. doi: 10.1590/S0103-84782010005000154
https://doi.org/10.1590/S0103-8478201000...
) and their blood was rapidly collected from the caudal vein with
heparinized syringes. After sampling, fish were killed by sectioning the spinal cord.
All procedures were conducted with the approval of the Ethics Committee on Animal
Experimentation of the UFSM (registration #128/2010).
DO levels and temperature were measured daily with Orion 810 oxygen meter (Thermo
Electron Corporation, Waltham, Al, USA). Water samples were collected every second day
to verify total ammonia (Verdouw et al. 1978Verdouw H, Van Echteld CJA, Dekkers EMJ (1978) Ammonia determination
based on indophenols formation with sodium salicylate. Water Research 12: 399-402.
doi: 10.1016/0043-1354(78)90107-0
https://doi.org/10.1016/0043-1354(78)901...
),
un-ionized ammonia, hardness (Eaton et al. 2005Eaton AD, Clesceri LS, Rice EW, Grennberg AE (2005) Standard methods for
the examination of water and wastewater. Springfield, American Public Health
Association, 21st ed., 1600p.),
nitrite (Boyd & Tucker 1992Boyd CE, Tucker CS (1992) Water quality and pond soil analyses for
aquaculture. Auburn, Alabama Agricultural Experiment Station, Auburn University,
183p.), Cl-
(Zall et al. 1956Zall DM, Fisher M, Garner MQ (1956) Photometric determination of
chlorides in water. Analytical Chemistry 28: 1665-1678. doi:
10.1021/ac60119a009
https://doi.org/10.1021/ac60119a009...
), and Na+ and
K+ levels, which were measured in a flame photometer (Micronal B262, São
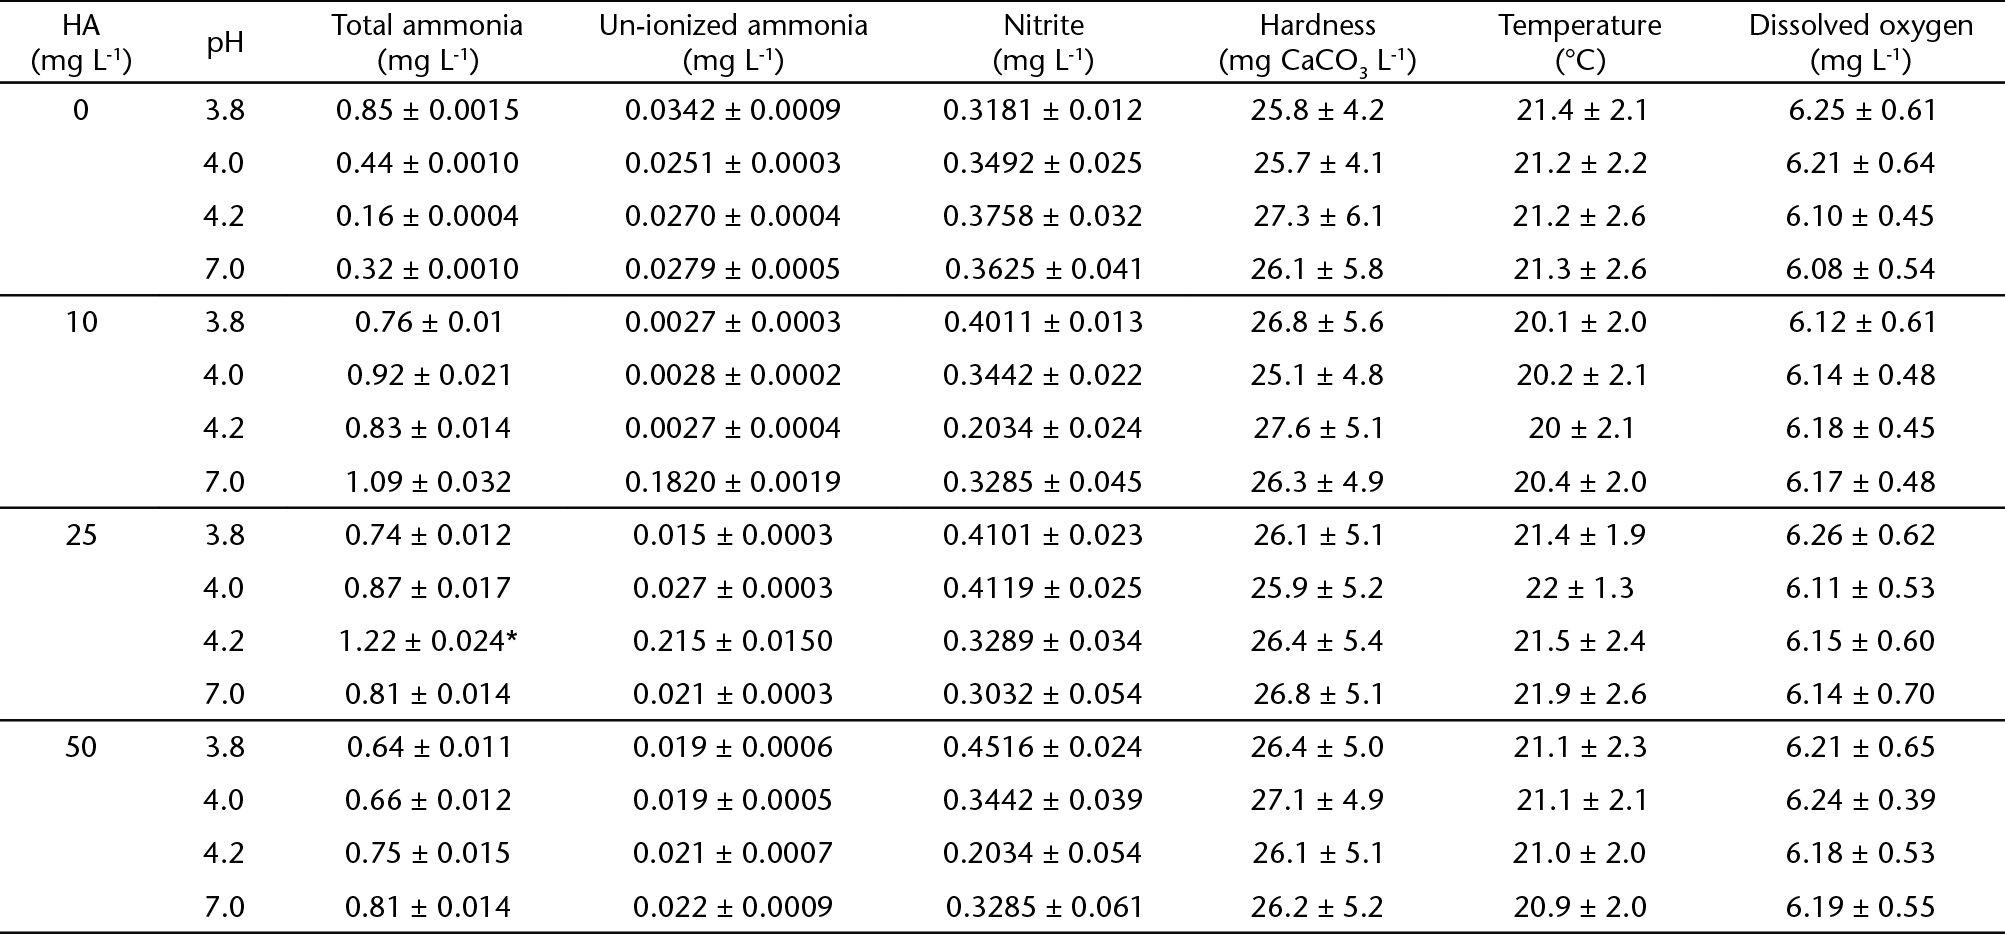
Paulo, Brazil). Details on the composition of the water are provided in Tables 1 and 2. There were no significant differences in water quality parameters between
treatments.
To obtain the hematocrit, microcapillary tubes were filled with blood immediately after
euthanasia and centrifuged at 10000 Xg for 5 minutes, and the results were obtained
using a hematocrit card reader. The concentration of hemoglobin was determined by the
cyanmethemoglobin method using a spectrophotometer (Brown
1976Brown BA (1976) Hematology: Principles and procedures. Philadelphia, Lea
& Febiger, 336p.). For the morphometric analyses, blood smears were prepared immediately
from the whole blood, air-dried, fixed in methanol and stained with May-Grünwald (Tavares-Dias et al. 2004Tavares-Dias M, Bozzo FR, Sandrin EFS, Campos-Filho E, Moares FR (2004)
Células sanguíneas, eletrólitos séricos, relação hepato e esplenossomática de carpa
comum, Cyprinus carpio (Cyprinidae) na primeira maturação gonadal. Acta Scientiarum
Biological Sciences 26: 73-80. doi:
10.4025/actascibiolsci.v26i1.1661
https://doi.org/10.4025/actascibiolsci.v...
). The surface area and the
major and minor axes of the erythrocyte as well as of its nucleus were determined (Dorafshan et al. 2008Dorafshan S, KalbAssi MR, Pourkazemi M, Amiri BM, Karimi SS (2008)
Effects of triploidy on the Caspian salmon Salmo trutta caspius haematology. Fish
Physiology and Biochemistry 34: 195-200. doi:
10.1007/s10695-007-9176-z
https://doi.org/10.1007/s10695-007-9176-...
). Briefly, ten high-power
fields were randomly selected on each blood smear, and morphometry of ten erythrocytes
were determined in each of these fields. All analyses were performed using the Zeiss
Axio Vision System with Remote Capture 4.7 Rel DC - Cannon Power shot G9.
Blood samples were spun at 3000 Xg for 10 minutes and plasma was stored at -25°C until analyses of Na+, Cl- and K+. The ion levels in the plasma were determined as previously described for the water ion levels.
Homogeneity of variances was assessed via Levene test and the comparison between treatments was carried out by two-way ANOVA and Tukey test. The Kruskal-Wallis test, followed by multiple comparisons of mean ranks, was used for analyses of plasma ion levels (Statistica 7.0 software). Minimum level of significance was 95% (p < 0.05). Data are presented as mean ± standard error (SE).
RESULTS
Survival
None of the fish exposed to pH 3.8 survived the 96 hours of experiment. At pH 4.0 there was a progressive decrease in survival (100, 86, 60 and 40%) with increased HA level (0, 10, 25 and 50 mg L-1 HA, respectively). The survival rates at pH 4.2 (93.33%) and 7.0 (100%) were not affected by HA concentration. Survival at pH 4.0 was lower than at pH 4.2 and 7.0 at all treatments with the presence of HA (i.e. 10, 25 and 50 mg L-1 of HA) (Fig. 1).

Effect of humic acid (HA) and pH on survival of silver catfish (Rhamdia quelen). Different letters indicate significant difference between HA concentrations at the same pH. * indicate significant difference from pH 7.0 at the same HA concentration (p < 0.05). Mean values ± SE (n = 6-15/group). (() pH 4.0, (() pH 4.2, (() pH 7.0.
Hematocrit and hemoglobin
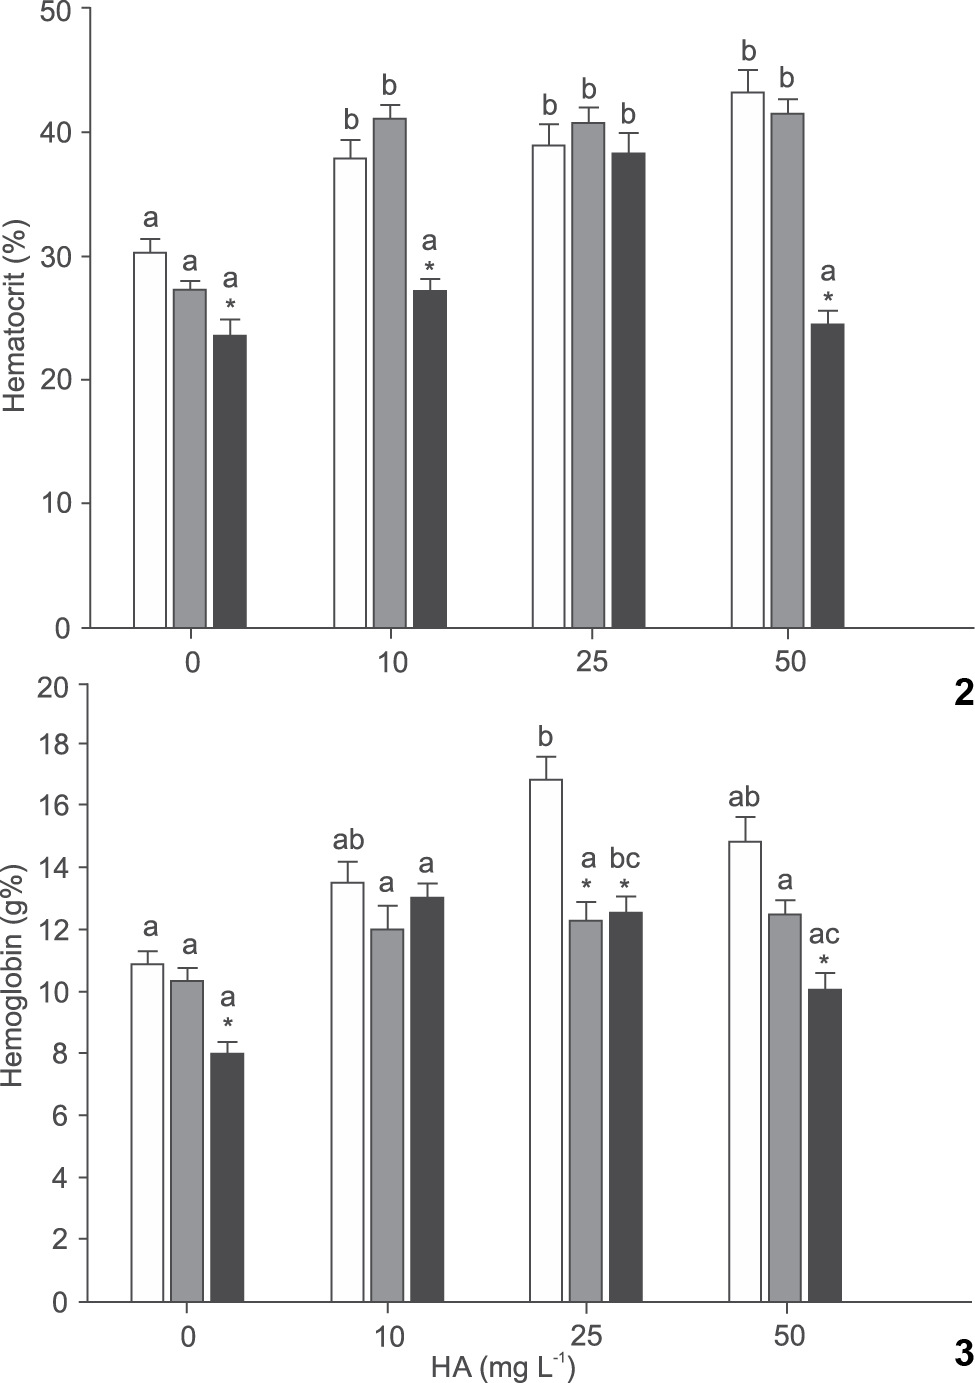
Overall, HA triggered an increase in the percentages of hematocrit and hemoglobin. The presence of HA promoted an increase in the percentage hematocrit at pH 4.0 and 4.2. Upon exposure to pH 7.0, fish experienced a gradual increase in hematocrit from 0 to 25 mg L-1 HA. Hematocrit declined with the increase in pH at 0 mg L-1 HA. Exposure to 10 mg L-1 HA induced significantly higher hematocrit percentage at pH 4.0 and 4.2, while at 25 mg L-1 HA the pH had negligible influence on hematocrit. Treatment with 50 mg L-1 HA caused a significantly reduction in hematocrit concentration at pH 7.0 (Fig. 2).

Effect of humic acid (HA) and pH on hematocrit (2) and hemoglobin (3) of silver catfish (Rhamdia quelen). Different letters indicate significant difference between HA concentrations at the same pH. * indicate significant difference from pH 7.0 at the same HA concentration (p < 0.05). Mean values ± SE (n = 6-15/group). (() pH 4.0, (() pH 4.2, (() pH 7.0.
There was no difference in the percentage of hemoglobin between HA treatments at pH 4.2. Exposure to pH 4.0 induced a higher hemoglobin level at 25 mg L-1 HA than at 0 mg L-1 HA. When fish were exposed to pH 7.0 the hemoglobin was lower at 50 than at 10 mg L-1 HA, and at 0 mg L-1 HA was also lower than at 25 mg L-1 HA. In the absence of HA the levels of hemoglobin decreased as the pH increased. Exposure to 10 mg L-1 HA did not induce differences in hemoglobin values between the different pH. Hemoglobin levels at 25 mg L-1 HA were higher at pH 4.0 than at pH 4.2 and 7.0. On exposure to 50 mg L-1 HA the hemoglobin levels were higher at pH 4.0 and 4.2 than at pH 7.0 (Fig. 3).
Erythrocyte morphometry
Fish subjected to pH 4.0 showed greater cell area and cell minor and major axes in the presence of HA than in the absence of it. At pH 4.2, cell area was larger at 10 and 50 mg L-1 HA than at 25 mg L-1 HA, and it decreased further when HA was not present. At the same pH (4.2), cell minor axis was bigger at 50 than at 0 and 25 mg L-1 HA; it was also bigger at 10 mg L-1 HA compared to 0 mg L-1 HA. At 0 mg L-1 HA, cell area and its minor and major axes were bigger at pH 7.0 than at pH 4.0. The group exposed to 25 mg L-1 HA presented greater cell area at pH 7.0 than at all the acidic pH and greater cell minor axis at pH 7.0 than at pH 4.2. Fish treated with 50 mg L-1 HA had bigger cell minor axis at pH 4.2 than at pH 4.0, and bigger cell major axis at pH 7.0 comparing with pH 4.0 (Table 3).
Effect of humic acid and pH on erythrocyte morphology of Rhamdia quelen. Different letters indicate significant difference between HA concentrations at the same pH. * Indicate significant difference from pH 7.0 at the same HA concentration (p < 0.05). Mean values ± SE (n = 8-15/group).
Plasma Na+, Cl- and K+
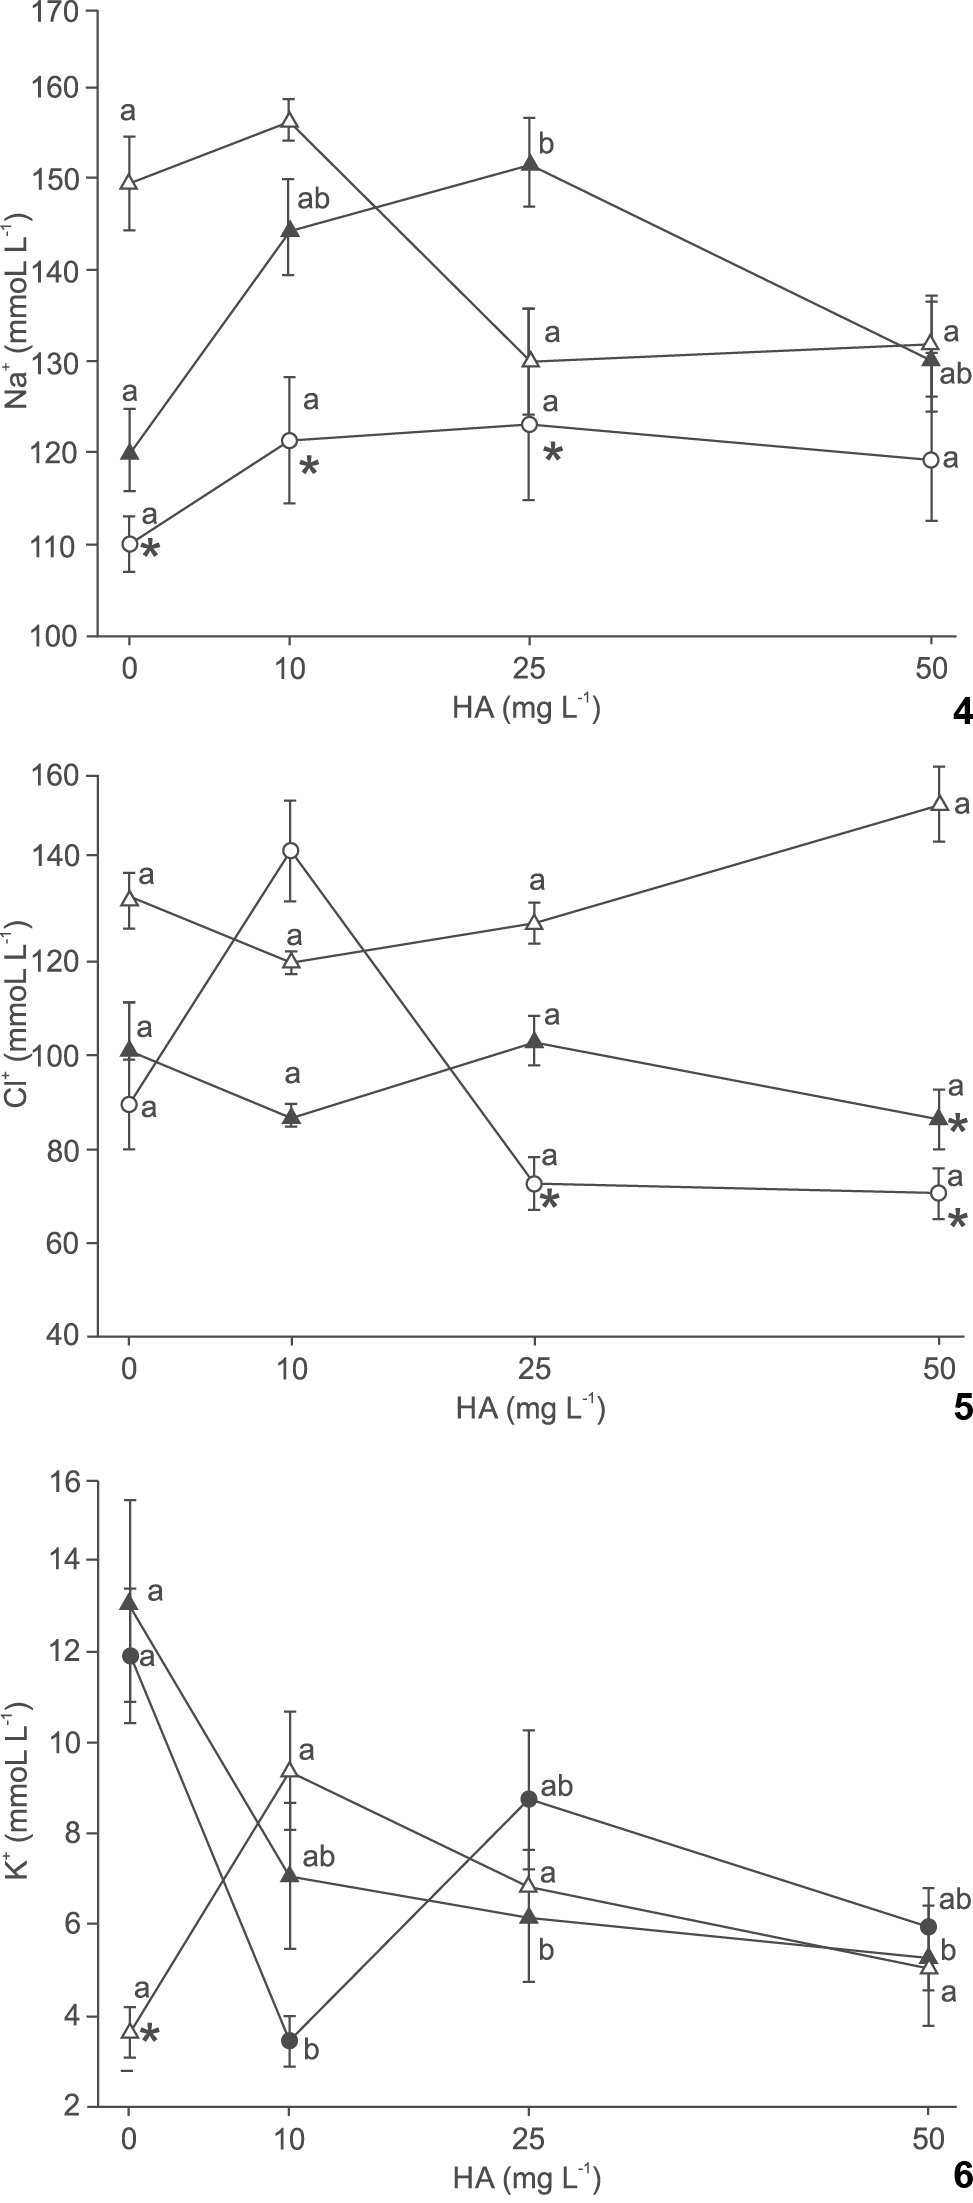
In Na+ levels, no significant differences were observed in fish exposed to the different HA treatments at pH 4.0 and 7.0, but at pH 4.2, exposure to 25 mg L-1 HA increased Na+ levels compared to the group non exposed to HA. Silver catfish exposed to pH 4.0 and 4.2 without HA presented significantly lower Na+ levels than those at pH 7.0 without HA, but at 10 mg L-1 HA plasma Na+ in fish exposed to pH 4.2 were not significantly different from pH 7.0. Fish at 25 mg L-1 HA and pH 4.2 presented significantly higher Na+ levels than at pH 7.0 (Fig. 4).

Effect of humic acid (HA) and pH on plasma Na+ (4), Cl- (5) and K+ (6) of silver catfish (Rhamdia quelen). Different letters indicate significant difference between HA concentrations at the same pH. * indicate significant difference from pH 7.0 at the same HA concentration (p < 0.05). Mean values ± SE (n = 6-15/group). (() pH 4.0, (() pH 4.2, (() pH 7.0.
The levels of Cl- at pH 4.0 were significantly greater in fish exposed to 10 mg L-1 HA, while at pH 4.2 and 7.0 HA did not affect significantly plasma Cl-. Fish subjected to 10 mg L-1 had higher Cl- levels at pH 7.0 and 4.0 than at pH 4.2. Plasma Cl- levels were significantly lower at 25 mg L-1 HA and pH 4.0 and at 50 mg L-1 and pH 4.0 and 4.2 than at pH 7.0 and the same HA levels (Fig. 5).
K+ levels were not affect by HA treatments at pH 7.0. However, significantly higher K+ levels were observed at 0 mg L-1 HA than at 10 mg L-1 HA and pH 4.0, and at 25 and 50 mg L-1 HA and pH 4.2. The levels of K+ were significantly higher at pH 4.0 and 4.2 than at pH 7.0 in fish kept in water without HA (Fig. 6).
DISCUSSION
All water parameters analyzed were within the limits that permit normal growth and
survival of silver catfish (e.g. nitrite and un-ionized ammonia levels below 1.2 mg
L-1 and 0.1 mg L-1 respectively) (Lima et al. 2011Lima RL, Braun N, Kochhann D, Lazzari R, Radünz-Neto J, Moraes BS, Loro
V, Baldisserotto B (2011) Survival, growth and metabolic parameters of silver
catfish, Rhamdia quelen, juveniles exposed to different waterborne nitrite levels.
Neotropical Ichthyology 9: 147-152. doi:
10.1590/S1679-62252011005000004
https://doi.org/10.1590/S1679-6225201100...
, Miron et al.
2011Miron DS, Becker AG, Loro VL, Baldisserotto B (2011) Waterborne ammonia
and silver catfish, Rhamdia quelen: survival and growth. Ciência Rural 41: 349-353.
doi: 10.1590/S0103-84782011000200028
https://doi.org/10.1590/S0103-8478201100...
).
According to Zaions & Baldisserotto (2000Zaions MI, Baldisserotto B (2000) Na+ and K+ body levels and survival of
fingerlings of Rhamdia quelen (Siluriformes, Pimelodidae) exposed to acute changes of
water pH. Ciência Rural 30: 1041-1045. doi:
10.1590/S0103-84782000000600020
https://doi.org/10.1590/S0103-8478200000...
),
even though silver catfish presents a marked loss of Na+ at pH 4.0, this is
the acidic pH threshold for the species survival, at least for 96 h. In the present
assessment this assertion was confirmed by the 0% survival of fish exposed to pH 3.8
regardless the HA concentrations. As stated by Wood
& McDonald (1982Wood CM, McDonald DG (1982) Physiological mechanisms of acid toxicity to
fish, p. 197-226. In: Johnson RE (Ed.). Acid Rain/Fisheries: Proceedings of an
International Sympo sium on Acid Precipitation and Fishery Impacts in North-Eastern
North America. Ithaca, American Fisheries Society.), nonacidophilic species suffocate at pH levels below 4.0
due to gill structural damage, edema and mucification. Moreover, fish mortality in acid
waters is largely associated with a failure to ionoregulate, especially due to
stimulation of Na+ efflux (Milligan &
Wood 1982Wood CM, McDonald DG (1982) Physiological mechanisms of acid toxicity to
fish, p. 197-226. In: Johnson RE (Ed.). Acid Rain/Fisheries: Proceedings of an
International Sympo sium on Acid Precipitation and Fishery Impacts in North-Eastern
North America. Ithaca, American Fisheries Society.). A study on shiners Notropis cornutus (Mitchill,
1817), rainbow trout Oncorhynchus mykiss (Walbaum, 1792) and perch
Perca flavescens (Mitchill, 1814) clearly proved that principle by
showing that a great amount of Na+ and Cl- (50-60%) had been lost
at death after exposure to pH 4.0 (Freda & McDonald
1988Freda J, McDonald DG (1988) Physiological correlates of interspecific
variation in acid tolerance in fish. Journal of Experimental Biology 136:
243-258.). Similarly, Holland et al. (2014Holland A, Duivenvoorden LJ, Kinnear SHW (2014) The double-edged sword
of humic substances: contrasting their effect on respiratory stress in eastern
rainbow fish exposed to low pH. Environmental Science and Pollution Research 21:
1701-1707. doi: 10.1007/s11356-013-2031-0
https://doi.org/10.1007/s11356-013-2031-...
)
reported increased morbidity of the eastern rainbow fish Melanotaenia splendida
splendida (Peters, 1866) as the pH dropped to 3.5-4.0 in the presence of
commercial HA, despite having observed a protective effect of the substance at higher
acidic levels. The authors suggested that HA may have enhanced the toxicity of low pH by
increasing ion loss in the fish.
At pH 4.0, HA displayed a deleterious effect on the physio logy of silver catfish; increased concentration of HA was associated with a decline in fish survival. Costa et al. (pers. comm.) observed that the presence of HA induces proliferation of chloride cells in the lamellae of the gill of silver catfish. Gas transfer in pavement cells might be impaired when chloride cells inundate the lamellae, since thickening of the lamellar epithelium increases blood-to-water diffusion distance (Greco et al. 1996Greco AM, Fenwick JC, Perry SF (1996) The effects of soft-water acclimation on gill structure in the rainbow trout Oncorhynchus mykiss. Cell and Tissue Research 285: 75-82.). Bindon et al. (1994Bindon SD, Gilmour KM, Fenwick JC, Perry SF (1994) The effects of branquial chloride cell proliferation on respiratory function in the rainbow trout Oncorhyncus mykiss. Journal of Experimental Biology 197: 47-63.) previously reported a reduction in the lamellar epithelium as a consequence of chloride cell proliferation. Thus, the silver catfish may have been unable to cope with the combination of limited gas exchange, due to increased concentrations of HA, and ionic loss, the result of extreme pH. At higher pH levels, however, the detrimental effect of HA was not observed, most likely because at low pH the excess positive charge titrates away the negatively charged groups associated with the extracellular surface of epithelial membranes (Campbell et al. 1997Campbell PGC, Twiss MR, Wilkinson KJ (1997) Accumulation of natural organic matter on the surfaces of living cells: implications for the interaction of toxic solutes with aquatic biota. Canadian Journal of Fisheries and Aquatic Sciences 54: 2543-2554.). This reduces the electrochemical repulsion between the membrane and the negatively charged HA, allowing the two parameters to associate and induce an effect. However, as pH increases the decrease in positive charge means that the HA is now less electrochemically favored to associate with the membrane and thus the effect is diminished.
As stated by Aride et al. (2007Aride PHR, Roubach R, Val AL (2007) Tolerance response of tambaqui
Colossoma macropomum (Cuvier) to water pH. Aquaculture Research 38: 588-594. doi:
10.1111/j.1365-2109.2007.01693.x
https://doi.org/10.1111/j.1365-2109.2007...
), acid stress
triggers various changes in hematological parameters of freshwater fish. When it takes
place, the generated osmotic and ionic gradient favors the entry of water into
intracellular space and electrolyte flux in the opposite direction. With that, blood
volume decreases, erythrocyte physiology changes, hematocrit, hemoglobin and plasma
protein levels rise, and ion loss through the gills is further enhanced (Wood et al. 1998Wood CM, Wilson RW, Gonzalez RJ, Patrick ML, Bergaman HL, Narahara A,
Val AL (1998) Responses of an Amazonian teleost, the tambaqui (Colossoma macropomum)
to low pH in extremely soft water. Physiologycal and Biochemical Zoology 71:
658-670., Aride et al. 2007Aride PHR, Roubach R, Val AL (2007) Tolerance response of tambaqui
Colossoma macropomum (Cuvier) to water pH. Aquaculture Research 38: 588-594. doi:
10.1111/j.1365-2109.2007.01693.x
https://doi.org/10.1111/j.1365-2109.2007...
). Water acidification is also associated with blood
acidosis. It affects the oxygenation capacity of the hemoglobin and PO2 is
thus reduced, which in turn triggers an increase in hematocrit and hemoglobin in order
to restore proper homeostatic control (McDonald &
Wood 1981McDonald D, Wood CM (1981) Branchial and renal acid and ion fluxes in
the rainbow trout, Salmo gairdneri, at low environmental pH. Journal of Experimental
Biology 93: 101-118., Dheer et al. 1987Dheer JMS, Dheer TR, Mahajan CL (1987) Haematological and haematopoetic
responses to acid stress in an air-breathing freshwater fish, Channa punctatus.
Journal of Fish Biology 30: 577-588.). Milligan & Wood (1982Milligan CL, Wood CM (1982) Disturbances in haematology, fluid volume
distribution and circulatory function associated with low environmental pH in the
rainbow trout, Salmo Gairdneri. Journal of Experimental Biology 99:
397-415.) found increases in both
hematocrit and hemoglobin in rainbow trout during acid exposure. The authors stated that
hematocrit elevation probably resulted from a reduction in plasma volume, erythrocyte
swelling and release of erythrocytes from the spleen due to increased circulating
catecholamines.
In this investigation, both hematocrit and hemoglobin were highly affected by the
experimental variables, considering the basal range previously reported for silver
catfish, 17.00-34.00 and 4.95-9.09 respectively (Tavares-Dias et al. 2002Tavares-Dias M, Melo JFB, Moraes G, Moraes FR (2002) Características
hematológicas de teleósteos brasileiros: VI. Variáveis do jundiá Rhamdia quelen
(Pimelodidae). Ciência Rural 32: 693-698. doi:
10.1590/S0103-84782002000400024
https://doi.org/10.1590/S0103-8478200200...
). Some of the groups exposed to higher pH levels
increased hematocrit and hemoglobin values in the presence of HA, which may be a result
of the before-mentioned limited gas exchange induced by HA. Inefficient gill ventilation
triggers mechanisms such as splenic contraction in an attempted to absorb more oxygen,
therefore elevating hematocrit and hemoglobin (Sampaio
et al. 2008Sampaio FG, Boijink CL, Oba ET, Santos LRB, Kalinin AL, Rantin FT (2008)
Antioxidant defenses and biochemical changes in pacu (Piaractus mesopotamicus) in
response to single and combined copper and hypoxia exposure. Comparative Biochemistry
and Physiology C 147: 43-51. doi: 10.1016/j.cbpc.2012.07.002
https://doi.org/10.1016/j.cbpc.2012.07.0...
). Riffel et al. (2014Riffel APK, Saccol EMH, Finamor IA, Ourique GM, Gressler LT, Parodi T,
Goulart LOR, Llesuy S, Baldisserotto B, Pavanato MA (2014) Humic acid and moderate
hypoxia alter oxidative and physiological parameters in different tissues of silver
catfish (Rhamdia quelen). Journal of Comparative Physiology B 184: 469-482. doi:
10.1007/s00360-014-0808-1
https://doi.org/10.1007/s00360-014-0808-...
) have
similarly reported that the addition of HA to the water, though at low concentrations,
induced hematocrit and hemoglobin rises in silver catfish at neutral pH.
Somewhat different results were found at pH 7.0 for the hematocrit in the group subjected to 10 mg L-1 HA and for both the hematocrit and hemoglobin in the group exposed to 50 mg L-1 HA. It seems that the fish in those groups, especially in the latter one, were able to compensate for the decreased ventilatory drive caused by HA at the neutral pH, which was not observed at 25 mg L-1 HA.
Exposure of tambaqui to an extreme pH of 3.0 had no influence on blood oxygenation or
hemoglobin concentration, demonstrating that this fish, which migrates from circumneu
tral to acidic waters in its natural habitat, does not encounter challenges in oxygen
delivery at such pH level (Wood et al. 1998). Likewise, Aride et al. (2007Aride PHR, Roubach R, Val AL (2007) Tolerance response of tambaqui
Colossoma macropomum (Cuvier) to water pH. Aquaculture Research 38: 588-594. doi:
10.1111/j.1365-2109.2007.01693.x
https://doi.org/10.1111/j.1365-2109.2007...
) observed similar hemoglobin levels between tambaqui
subjected to either circumneutral or acid pH, though there was elevation in hematocrit
during acid exposure.
As already mentioned, Milligan & Wood (1982Milligan CL, Wood CM (1982) Disturbances in haematology, fluid volume
distribution and circulatory function associated with low environmental pH in the
rainbow trout, Salmo Gairdneri. Journal of Experimental Biology 99:
397-415.)
found that acid exposure triggered disturbances in hematological homeostasis and fluid
volume distribution in rainbow trout. Elevation in erythrocyte volume in that species
was most likely a result of fluid redistribution from extra- to intracellular
compartments due to the ionic dilution of the plasma. In contrast, ARIDE et al. (2007Aride PHR, Roubach R, Val AL (2007) Tolerance response of tambaqui
Colossoma macropomum (Cuvier) to water pH. Aquaculture Research 38: 588-594. doi:
10.1111/j.1365-2109.2007.01693.x
https://doi.org/10.1111/j.1365-2109.2007...
) observed no changes in erythrocyte volume in
tambaqui subjected to acid exposure. In the present study it was demonstrated that: a)
regardless the HA concentration, the size of the erythrocytes and their nuclei remained
stable throughout the groups at pH 7.0; b) at pH 4.0 and 4.2, the significant
differences indicate smaller values in the absence of HA; and c) within a given
concentration of HA, most differences pointed to higher values at pH 7.0 than at acidic
pH. The overall response suggests that, unlike the studies cited above, low pH caused a
shrinking effect on the erythrocytes of silver catfish. The presence of HA did not fully
counteract such outcome, since the differences were significant comparing to pH 7.0 This
effect could be due to output of water and hydromineral disturbance, which typically
arise from stress in fish (Wendelaar Bonga
1997Wendelaar Bonga SE (1997) The stress response in fish. Physiology
Reviews 77: 591-625.).
Plasma levels of Na+ of silver catfish at pH 4.0 and 4.2 were lower than those observed at pH 7.0. The disruptive process in this extreme aquatic environment primarily involves active inhibition of ion uptake and increased ion loss in the gills (Milligan & Wood 1982Milligan CL, Wood CM (1982) Disturbances in haematology, fluid volume distribution and circulatory function associated with low environmental pH in the rainbow trout, Salmo Gairdneri. Journal of Experimental Biology 99: 397-415.). Freda & McDonald (1988Freda J, McDonald DG (1988) Physiological correlates of interspecific variation in acid tolerance in fish. Journal of Experimental Biology 136: 243-258.) observed the complete inhibition of Na+ influx in shiners and trout exposed to pH 4.0, in addition to an increase in the ion outward flux. Lin & Randall (1993Lin H, Randall DJ (1993) Proton ATPase activity in crude homogenates of fish gill tissue: inhibitor sensitivity and environmental and hormonal regulation. Journal of Experimental Biology 180: 163-174.) claimed that inhibition of Na+ uptake at low pH results from the reduced activity of an apical electrogenic H+ATPase that energizes an apical Na+ channel in chloride cells, an effect attributed to the H+ gradient. Stimulation of Na+ efflux, which is the primary determinant of low pH tolerance, is usually a consequence of the H+-induced Ca2+ leaching from the paracellular channels in the gills (Gonzalez et al. 1997Gonzalez RJ, Dalton VM, Patrick ML (1997) Ion regulation in ion-poor, acidic water by the blackskirt tetra (Gymnocorymbus ternetzi), a fish native to the Amazon River. Physiological Zoology 70: 428-435.).
McDonald & Wood (1981McDonald D, Wood CM (1981) Branchial and renal acid and ion fluxes in
the rainbow trout, Salmo gairdneri, at low environmental pH. Journal of Experimental
Biology 93: 101-118.) and Wood et al. (1998Wood CM, Wilson RW, Gonzalez RJ, Patrick ML, Bergaman HL, Narahara A,
Val AL (1998) Responses of an Amazonian teleost, the tambaqui (Colossoma macropomum)
to low pH in extremely soft water. Physiologycal and Biochemical Zoology 71:
658-670.) stated that disturbance of
ionoregulation by high external H+ is likely to occur in nonacidophilic
species when they are subjected to a sudden acid stress. On the other hand, fish that
inhabit naturally acidified, diluted waters, such as those found in the Amazon basin or
along the eastern coast of the United States, show a greater tolerance to high
concentration of water H+ and have a lower pH threshold at which marked ion
losses occur (Gonzalez & Dunson 1989Gonzalez RJ, Dunson WA (1989) Acclimation of sodium regulation to low pH
and the role of calcium in the acid-tolerant sunfish Enneacanthus obesus.
Physiologycal Zoology 62: 977-992., Gonzalez et al. 1998Gonzalez RJ, Wood CM, Wilson RW, Patrick ML, Bergman HL, Narahara A, Val
AL (1998) Effects of water pH and calcium concentration on ion balance in fish of the
Rio Negro, Amazon. Physiological Zoology 71: 15-22., Wood et al. 1998Wood CM, Wilson RW, Gonzalez RJ, Patrick ML, Bergaman HL, Narahara A,
Val AL (1998) Responses of an Amazonian teleost, the tambaqui (Colossoma macropomum)
to low pH in extremely soft water. Physiologycal and Biochemical Zoology 71:
658-670., Matsuo & Val
2007Matsuo AYO, Val AL (2007) Acclimation to humic substances prevents whole
body sodium loss and stimulates branchial calcium uptake capacity in cardinal tetras
Paracheirodon axelrodi (Schultz) subjected to extremely low pH. Journal of Fish
Biology 70: 989-1000. doi: 10.1111/j.1095-8649.2007.01358.x
https://doi.org/10.1111/j.1095-8649.2007...
). In some species the adaptation to thrive in these waters involves
increased branchial affinity for Ca2+ at the paracellular junction, thus
counteracting low pH-induced displacement (Freda &
McDonald 1988Freda J, McDonald DG (1988) Physiological correlates of interspecific
variation in acid tolerance in fish. Journal of Experimental Biology 136:
243-258., Gonzalez & Dunson
1989Gonzalez RJ, Dunson WA (1989) Acclimation of sodium regulation to low pH
and the role of calcium in the acid-tolerant sunfish Enneacanthus obesus.
Physiologycal Zoology 62: 977-992.). Further, some fish are able to take up ions at high rates when there is
high diffusive ion leakage (Gonzalez et al. 1997Gonzalez RJ, Dalton VM, Patrick ML (1997) Ion regulation in ion-poor,
acidic water by the blackskirt tetra (Gymnocorymbus ternetzi), a fish native to the
Amazon River. Physiological Zoology 70: 428-435.,
1998Gonzalez RJ, Wood CM, Wilson RW, Patrick ML, Bergman HL, Narahara A, Val
AL (1998) Effects of water pH and calcium concentration on ion balance in fish of the
Rio Negro, Amazon. Physiological Zoology 71: 15-22.), and at least two Amazon species have
pH-insensitive Na+ transporter (Gonzalez
& Wilson 2001Gonzalez RJ, Wilson RW (2001) Patterns of ion regulation in acidophilic
fish native to the ion-poor acidic Rio Negro. Journal of Fish Biology 58: 1680-1690.
doi: 10.1111/j.1095-8649.2001.tb02322.x
https://doi.org/10.1111/j.1095-8649.2001...
). For Freda & McDonald
(1988Freda J, McDonald DG (1988) Physiological correlates of interspecific
variation in acid tolerance in fish. Journal of Experimental Biology 136:
243-258.), two important abilities may respond for the interspecific differences
in acid tolerance: limitation of the ionic leakiness prompted by low pH, and ion
transporter recovery from the low pH inhibition.
Besides their own endogenous mechanisms, fish native to DOC-enriched habitats may relay
on the great amount of organic substances found there to improve ion homeostasis (Gonzalez et al. 1998Gonzalez RJ, Wood CM, Wilson RW, Patrick ML, Bergman HL, Narahara A, Val
AL (1998) Effects of water pH and calcium concentration on ion balance in fish of the
Rio Negro, Amazon. Physiological Zoology 71: 15-22., 2002Gonzalez RJ, Wilson RW, Wood CM, Patrick ML, Val AL (2002) Diverse
strategies for ion regulation in fish collected from the ion-poor, acidic Rio Negro.
Physiological and Biochemical Zoology 75: 37-47. doi: 10.1086/339216
https://doi.org/10.1086/339216...
, Wood et al. 2002Wood CM, Matsuo AYO, Gonzalez RJ, Wilson RW, Patrick ML, Val AL (2002)
Mechanisms of ion transport in Potamotrygon, a stenohaline freshwater elasmobranch
native to the ion-poor blackwaters of the Rio Negro. Journal of Experimental Biology
205: 3039-3054., 2003Wood CM, Matsuo AYO, Wilson RW, Gonzalez RJ, Patrick ML, Playle RC, Val
AL (2003) Protection by natural blackwater against disturbances in ion fluxes caused
by low pH exposure in freshwater stingrays endemic to the Rio Negro. Physiological
and Biochemical Zoology 76: 12-27. doi: 10.1086/367946
https://doi.org/10.1086/367946...
). Gonzalez et
al. (2002Gonzalez RJ, Wilson RW, Wood CM, Patrick ML, Val AL (2002) Diverse
strategies for ion regulation in fish collected from the ion-poor, acidic Rio Negro.
Physiological and Biochemical Zoology 75: 37-47. doi: 10.1086/339216
https://doi.org/10.1086/339216...
) and Matsuo & Val (2007Matsuo AYO, Val AL (2007) Acclimation to humic substances prevents whole
body sodium loss and stimulates branchial calcium uptake capacity in cardinal tetras
Paracheirodon axelrodi (Schultz) subjected to extremely low pH. Journal of Fish
Biology 70: 989-1000. doi: 10.1111/j.1095-8649.2007.01358.x
https://doi.org/10.1111/j.1095-8649.2007...
)
observed that the presence of DOC in acidic water reduced both Na+ influx
inhibition and diffusive efflux stimulation in teleosts native to Amazonia. The role of
DOC to bind fish gills at low pH and promote physiological benefits (Campbell et al. 1997Campbell PGC, Twiss MR, Wilkinson KJ (1997) Accumulation of natural
organic matter on the surfaces of living cells: implications for the interaction of
toxic solutes with aquatic biota. Canadian Journal of Fisheries and Aquatic Sciences
54: 2543-2554.) may be comparable with the
above-mentioned action of elevated waterborne levels of Ca2+, that is,
stabilization of tight junctions and prevention of ion losses. That would override any
protective effect otherwise achieved by the divalent ion (Wood et al. 2003Wood CM, Matsuo AYO, Wilson RW, Gonzalez RJ, Patrick ML, Playle RC, Val
AL (2003) Protection by natural blackwater against disturbances in ion fluxes caused
by low pH exposure in freshwater stingrays endemic to the Rio Negro. Physiological
and Biochemical Zoology 76: 12-27. doi: 10.1086/367946
https://doi.org/10.1086/367946...
, 2011Wood CM, Al-Reasi HA, Scott DS (2011) The two faces of DOC. Aquatic
Toxicology 105S: 3-8. doi: 10.1016/j.aquatox.2011.03.007
https://doi.org/10.1016/j.aquatox.2011.0...
).
Besides, it could result from the ability of the organic molecules to bind to ion apical
transporters and help concentrate Na+ and Cl- ions by
complexation, or to help deliver the ions to the uptake sites, which is normally
credited to mucus (Gonzalez et al. 2002, Steinberg et
al. 2007Steinberg CEW, Saul N, Pietsch K, Meinelt T, Rienau S, Menzel R (2007)
Dissolved humic substances facilitate fish life in extreme aquatic environments and
have the potential to extend the lifespan of Caenorhabditis elegans. Annals of
Environmental Science 1: 81-90.).
Except when pH was 4.2, at which the presence of HA was associated with a slightly
higher Na+ plasma level in silver catfish, there were no differences in the
ion levels between the different HA concentrations at any given pH. This could be
explained by the observation that this fish species is not native to waters with high
DOC content, so its gill physiology may not be sensitive to the DOC's protective
mechanism (Matsuo et al. 2004Matsuo AYO, Playle RC, Val AL, Wood CM (2004) Physiological action of
dissolved organic matter in rainbow trout in the presence and absence of copper:
sodium uptake kinetics and unidirectional flux rates in hard and softwater. Aquatic
Toxicology 70: 63-81. doi: 10.1016/j.aquatox.2004.07.005
https://doi.org/10.1016/j.aquatox.2004.0...
). Another
possibility is that commercial HA is not as useful to silver catfish as natural black
water, as observed by Wood et al. (2003Wood CM, Matsuo AYO, Wilson RW, Gonzalez RJ, Patrick ML, Playle RC, Val
AL (2003) Protection by natural blackwater against disturbances in ion fluxes caused
by low pH exposure in freshwater stingrays endemic to the Rio Negro. Physiological
and Biochemical Zoology 76: 12-27. doi: 10.1086/367946
https://doi.org/10.1086/367946...
) in
stingrays (Potamotrygon sp.): HA stimulated Na+ and
Cl- leakage, probably because its high affinity for cations ends up
stripping Ca2+ from the gills. Consequently, the authors concluded that this
source of DOC may have different binding characteristics than does natural black water
DOC.
The inhibitory mechanism of Cl- uptake under low pH is possibly associated with the already described mechanism of Na+ uptake inhibition. Besides, it could be due to a reduction in intracellular HCO-3 at the chloride cells, thus exhausting the apical Cl-/HCO-3 exchanger (Wood 2001). Cl- loss in silver catfish was exacerbated at 25 and 50 mg L-1 HA in the fish exposed to pH 4.0, thus demonstrating a greater involvement of HA in Cl- than in Na+ flux. Such difference may be linked to their distinct ionoregulatory mechanisms across the gill epithelium, since Cl- and Na+ are exchanged for base and acid equivalents, respectively (Goss & Wood 1990Goss GG, Wood CM (1990) Kinetic analysis of the relationships between ion exchange and acid-base regulation at the gills of freshwater fish, p. 119-136. In: Truchot JP, Lahlou B (Eds.). Animal Nutrition and Transport Processes. 2. Transport, Respiration and Excretion: Comparative and Environmen tal Aspects. Basel, Karger Publishers.).
Comparing with the responses on Na+ and Cl- balance, a different
effect of HA was observed with regard to the dynamics of K+ regulation. When
there was no HA in the test water, the levels of K+ in silver catfish exposed
to pH 4.0 and 4.2 were higher in comparison to ion levels in fish subjected to pH 7.0. A
similar outcome was observed in the pirapitinga, Piaractus brachypomus,
in a recent investigation (Garcia et al. 2014Garcia LO, Gutiérres-Espinosa MC, Vásques-Torres W, Baldisserotto B
(2014) Dietary protein levels in Piaractus brachypomus submitted to extremely acidic
or alkaline pH. Ciência Rural 44: 301-306. doi:
10.1590/S0103-84782014000200017
https://doi.org/10.1590/S0103-8478201400...
).
Further, Zaions & Baldisserotto (2000Zaions MI, Baldisserotto B (2000) Na+ and K+ body levels and survival of
fingerlings of Rhamdia quelen (Siluriformes, Pimelodidae) exposed to acute changes of
water pH. Ciência Rural 30: 1041-1045. doi:
10.1590/S0103-84782000000600020
https://doi.org/10.1590/S0103-8478200000...
) found
lower body levels of K+ in silver catfish subjected to pH 7.0 than in those
subjected to either acidic or alkaline pH. Mathan et al.
(2010Mathan R, Kurunthachalam SK, Priya M (2010) Alterations in plasma
electrolyte levels of a freshwater fish Cyprinus carpio exposed to acidic pH.
Toxicological and Environmental Chemistry 92: 149-157. doi:
10.1080/02772240902810419
https://doi.org/10.1080/0277224090281041...
) also observed higher plasma K+ levels in the common carp,
Cyprinus carpio, after exposure to acidic pH, and suggested that it
could be due to a release of K+ from the muscle cells as H+ enters
them. Another study assessing plasma ion levels in silver catfish exposed to Aldrich HA
(0, 2.5 and 5 mg L -1) at pH ~ 7.0 observed a progressive increase in
K+ levels with increased HA concentrations, suggesting that HA could limit
gill permeability (Riffel et al. 2014Riffel APK, Saccol EMH, Finamor IA, Ourique GM, Gressler LT, Parodi T,
Goulart LOR, Llesuy S, Baldisserotto B, Pavanato MA (2014) Humic acid and moderate
hypoxia alter oxidative and physiological parameters in different tissues of silver
catfish (Rhamdia quelen). Journal of Comparative Physiology B 184: 469-482. doi:
10.1007/s00360-014-0808-1
https://doi.org/10.1007/s00360-014-0808-...
). In this
study HA did not influence K+ levels at pH 7.0, while at the intermediate pH
levels (4.0 and 4.2) its presence caused a marked decrease in ion levels. Thus, all
concentrations of HA were able to counteract increased K+ levels caused by pH
4.0 and 4.2, bringing K+ levels back to normal values for the species (Bolner & Baldisserotto 2007Bolner KCS, Baldisserotto B (2007) Water pH and urinary excretion in
silver catfish Rhamdia quelen. Journal of Fish Biology 70: 50-64. doi:
10.1111/j.1095-8649.2006.01253.x
https://doi.org/10.1111/j.1095-8649.2006...
), at pH 7.0.
Low pH exposure induced continuous net branchial losses of Na+,
Cl- and K+, and a progressive decline in plasma Na+
and Cl- levels in rainbow trout (McDonald
& Wood 1981McDonald D, Wood CM (1981) Branchial and renal acid and ion fluxes in
the rainbow trout, Salmo gairdneri, at low environmental pH. Journal of Experimental
Biology 93: 101-118.). In spite of an improved tolerance to acidity reported for
fish that are exposed to gradual water acidification in the wild, it is possible that
the same fish will undergo ion loss when faced with sudden environmental acidification.
For instance, Aride et al. (2007Aride PHR, Roubach R, Val AL (2007) Tolerance response of tambaqui
Colossoma macropomum (Cuvier) to water pH. Aquaculture Research 38: 588-594. doi:
10.1111/j.1365-2109.2007.01693.x
https://doi.org/10.1111/j.1365-2109.2007...
) found that
plasma levels of Na+ and K+ in the tambaqui were reduced in acidic
water compared to a circumneutral water. Wilson et al.
(1999Wilson RW, Wood CM, Gonzalez RJ, Patrick ML, Bergman HL, Narahara A, Val
AL (1999) Ion acid-base balance in three species of Amazonian fish during gradual
acidication of extremely soft water. Physiological and Biochemical Zoology 72:
277-285.) observed that acid exposure produced different patterns of
Na+, Cl- and K+ fluxes in three Amazon fish, which
implies that acid tolerance is not necessarily a typical feature of the fish that
inhabit this region. Instead, it is largely related to the occurrence of these fish in
the blackwater areas of that ecosystem, which are known to impose higher levels of
acidity on the species.
Although HA showed some positive effects on hematological and plasma K+ changes provoked in silver catfish by acidic pH exposure, the overall findings suggest that HA does not protect this species against acidic pH burden, since it increased mortality and Cl- loss at pH 4.0.
ACKNOWLEDGMENTS
The authors thank Conselho Nacional de Desenvolvi mento Científico e Tecnológico (CNPq) for the research fellowship to B. Baldisserotto and Fundação de Amparo à Pesquisa do Estado do Rio Grande do Sul (FAPERGS) and Coordenação de Aperfeiçoamento de Pessoal de Nível Superior, Brazil (Capes) for the graduate fellowships to L.T. Gressler and F.J. Sutili respectively. This work was funded by CNPq and Fundação de Amparo à Pesquisa do Estado do Amazonas (FAPEAM - INCT ADAPTA).
- Aride PHR, Roubach R, Val AL (2007) Tolerance response of tambaqui Colossoma macropomum (Cuvier) to water pH. Aquaculture Research 38: 588-594. doi: 10.1111/j.1365-2109.2007.01693.x
» https://doi.org/10.1111/j.1365-2109.2007.01693.x - Bindon SD, Gilmour KM, Fenwick JC, Perry SF (1994) The effects of branquial chloride cell proliferation on respiratory function in the rainbow trout Oncorhyncus mykiss. Journal of Experimental Biology 197: 47-63.
- Bolner KCS, Baldisserotto B (2007) Water pH and urinary excretion in silver catfish Rhamdia quelen. Journal of Fish Biology 70: 50-64. doi: 10.1111/j.1095-8649.2006.01253.x
» https://doi.org/10.1111/j.1095-8649.2006.01253.x - Boyd CE, Tucker CS (1992) Water quality and pond soil analyses for aquaculture. Auburn, Alabama Agricultural Experiment Station, Auburn University, 183p.
- Brown BA (1976) Hematology: Principles and procedures. Philadelphia, Lea & Febiger, 336p.
- Campbell PGC, Twiss MR, Wilkinson KJ (1997) Accumulation of natural organic matter on the surfaces of living cells: implications for the interaction of toxic solutes with aquatic biota. Canadian Journal of Fisheries and Aquatic Sciences 54: 2543-2554.
- Copatti CE, Codebella IJ, Radünz Neto J, Garcia LO, Rocha MC, Baldisserotto B (2005) Effect of dietary calcium on growth and survival of silver catfish fingerlings, Rhamdia quelen (Heptapteridae), exposed to different water pH. Aquaculture Nutrition 11: 345-350. doi: 10.1111/j.1365-2095.2005.00355.x
» https://doi.org/10.1111/j.1365-2095.2005.00355.x - Cunha MA, Zeppenfeld CC, Garcia LO, Loro VL, Fonseca MB, Emanuelli T, Veeck APD, Copatti CE, Baldisserotto B (2010) Anesthesia of silver catfish with eugenol: time of induction, cortisol response and sensory analysis of fillet. Ciência Rural 40: 2107-2114. doi: 10.1590/S0103-84782010005000154
» https://doi.org/10.1590/S0103-84782010005000154 - Dheer JMS, Dheer TR, Mahajan CL (1987) Haematological and haematopoetic responses to acid stress in an air-breathing freshwater fish, Channa punctatus. Journal of Fish Biology 30: 577-588.
- Dorafshan S, KalbAssi MR, Pourkazemi M, Amiri BM, Karimi SS (2008) Effects of triploidy on the Caspian salmon Salmo trutta caspius haematology. Fish Physiology and Biochemistry 34: 195-200. doi: 10.1007/s10695-007-9176-z
» https://doi.org/10.1007/s10695-007-9176-z - Duarte RM, Ferreira MS, Wood CM, Val AL (2013) Effect of low pH exposure on Na+ regulation in two cichlid fish species of the amazon. Comparative Biochemistry and Physiology a-Molecular & Integrative Physiology 166: 441-448. doi: 10.1016/j.cbpa.2013.07.022
» https://doi.org/10.1016/j.cbpa.2013.07.022 - Eaton AD, Clesceri LS, Rice EW, Grennberg AE (2005) Standard methods for the examination of water and wastewater. Springfield, American Public Health Association, 21st ed., 1600p.
- Farjalla VF, Amado AM, Suhett AL, Meirelles-Pereira F (2009) DOC removal paradigms in highly humic aquatic ecosystems. Environmental Science and Pollution Research 16: 531-538. doi: 10.1007/s11356-009-0165-x
» https://doi.org/10.1007/s11356-009-0165-x - Freda J, McDonald DG (1988) Physiological correlates of interspecific variation in acid tolerance in fish. Journal of Experimental Biology 136: 243-258.
- Garcia LO, Gutiérres-Espinosa MC, Vásques-Torres W, Baldisserotto B (2014) Dietary protein levels in Piaractus brachypomus submitted to extremely acidic or alkaline pH. Ciência Rural 44: 301-306. doi: 10.1590/S0103-84782014000200017
» https://doi.org/10.1590/S0103-84782014000200017 - Gonzalez RJ, Dunson WA (1989) Acclimation of sodium regulation to low pH and the role of calcium in the acid-tolerant sunfish Enneacanthus obesus. Physiologycal Zoology 62: 977-992.
- Gonzalez RJ, Wilson RW (2001) Patterns of ion regulation in acidophilic fish native to the ion-poor acidic Rio Negro. Journal of Fish Biology 58: 1680-1690. doi: 10.1111/j.1095-8649.2001.tb02322.x
» https://doi.org/10.1111/j.1095-8649.2001.tb02322.x - Gonzalez RJ, Dalton VM, Patrick ML (1997) Ion regulation in ion-poor, acidic water by the blackskirt tetra (Gymnocorymbus ternetzi), a fish native to the Amazon River. Physiological Zoology 70: 428-435.
- Gonzalez RJ, Wood CM, Wilson RW, Patrick ML, Bergman HL, Narahara A, Val AL (1998) Effects of water pH and calcium concentration on ion balance in fish of the Rio Negro, Amazon. Physiological Zoology 71: 15-22.
- Gonzalez RJ, Wilson RW, Wood CM, Patrick ML, Val AL (2002) Diverse strategies for ion regulation in fish collected from the ion-poor, acidic Rio Negro. Physiological and Biochemical Zoology 75: 37-47. doi: 10.1086/339216
» https://doi.org/10.1086/339216 - Goss GG, Wood CM (1990) Kinetic analysis of the relationships between ion exchange and acid-base regulation at the gills of freshwater fish, p. 119-136. In: Truchot JP, Lahlou B (Eds.). Animal Nutrition and Transport Processes. 2. Transport, Respiration and Excretion: Comparative and Environmen tal Aspects. Basel, Karger Publishers.
- Greco AM, Fenwick JC, Perry SF (1996) The effects of soft-water acclimation on gill structure in the rainbow trout Oncorhynchus mykiss. Cell and Tissue Research 285: 75-82.
- Holland A, Duivenvoorden LJ, Kinnear SHW (2014) The double-edged sword of humic substances: contrasting their effect on respiratory stress in eastern rainbow fish exposed to low pH. Environmental Science and Pollution Research 21: 1701-1707. doi: 10.1007/s11356-013-2031-0
» https://doi.org/10.1007/s11356-013-2031-0 - Küchler IL, Miekeley N, Forsberg BR (2000) A contribution to the chemical characterization of rivers in the rio Negro basin, Brazil. Journal of the Brazilian Chemical Society 11: 286-292. doi: 10.1590/S0103-50532000000300015
» https://doi.org/10.1590/S0103-50532000000300015 - Lima RL, Braun N, Kochhann D, Lazzari R, Radünz-Neto J, Moraes BS, Loro V, Baldisserotto B (2011) Survival, growth and metabolic parameters of silver catfish, Rhamdia quelen, juveniles exposed to different waterborne nitrite levels. Neotropical Ichthyology 9: 147-152. doi: 10.1590/S1679-62252011005000004
» https://doi.org/10.1590/S1679-62252011005000004 - Lin H, Randall DJ (1993) Proton ATPase activity in crude homogenates of fish gill tissue: inhibitor sensitivity and environmental and hormonal regulation. Journal of Experimental Biology 180: 163-174.
- Mathan R, Kurunthachalam SK, Priya M (2010) Alterations in plasma electrolyte levels of a freshwater fish Cyprinus carpio exposed to acidic pH. Toxicological and Environmental Chemistry 92: 149-157. doi: 10.1080/02772240902810419
» https://doi.org/10.1080/02772240902810419 - Matsuo AYO, Val AL (2007) Acclimation to humic substances prevents whole body sodium loss and stimulates branchial calcium uptake capacity in cardinal tetras Paracheirodon axelrodi (Schultz) subjected to extremely low pH. Journal of Fish Biology 70: 989-1000. doi: 10.1111/j.1095-8649.2007.01358.x
» https://doi.org/10.1111/j.1095-8649.2007.01358.x - Matsuo AYO, Playle RC, Val AL, Wood CM (2004) Physiological action of dissolved organic matter in rainbow trout in the presence and absence of copper: sodium uptake kinetics and unidirectional flux rates in hard and softwater. Aquatic Toxicology 70: 63-81. doi: 10.1016/j.aquatox.2004.07.005
» https://doi.org/10.1016/j.aquatox.2004.07.005 - McDonald D, Wood CM (1981) Branchial and renal acid and ion fluxes in the rainbow trout, Salmo gairdneri, at low environmental pH. Journal of Experimental Biology 93: 101-118.
- McGeer JC, Szebedinszky C, McDonald DG, Wood CM (2002) The role of dissolved organic carbon in moderating the bioavailability and toxicity of Cu to rainbow trout during chronic waterborne exposure. Comparative Biochemistry and Physiology C 133: 147-160. doi: 10.1016/S1532-0456(02)00084-4
» https://doi.org/10.1016/S1532-0456(02)00084-4 - Milligan CL, Wood CM (1982) Disturbances in haematology, fluid volume distribution and circulatory function associated with low environmental pH in the rainbow trout, Salmo Gairdneri. Journal of Experimental Biology 99: 397-415.
- Miron DS, Becker AG, Loro VL, Baldisserotto B (2011) Waterborne ammonia and silver catfish, Rhamdia quelen: survival and growth. Ciência Rural 41: 349-353. doi: 10.1590/S0103-84782011000200028
» https://doi.org/10.1590/S0103-84782011000200028 - Riffel APK, Saccol EMH, Finamor IA, Ourique GM, Gressler LT, Parodi T, Goulart LOR, Llesuy S, Baldisserotto B, Pavanato MA (2014) Humic acid and moderate hypoxia alter oxidative and physiological parameters in different tissues of silver catfish (Rhamdia quelen). Journal of Comparative Physiology B 184: 469-482. doi: 10.1007/s00360-014-0808-1
» https://doi.org/10.1007/s00360-014-0808-1 - Sampaio FG, Boijink CL, Oba ET, Santos LRB, Kalinin AL, Rantin FT (2008) Antioxidant defenses and biochemical changes in pacu (Piaractus mesopotamicus) in response to single and combined copper and hypoxia exposure. Comparative Biochemistry and Physiology C 147: 43-51. doi: 10.1016/j.cbpc.2012.07.002
» https://doi.org/10.1016/j.cbpc.2012.07.002 - Steinberg CEW, Saul N, Pietsch K, Meinelt T, Rienau S, Menzel R (2007) Dissolved humic substances facilitate fish life in extreme aquatic environments and have the potential to extend the lifespan of Caenorhabditis elegans. Annals of Environmental Science 1: 81-90.
- Tavares-Dias M, Melo JFB, Moraes G, Moraes FR (2002) Características hematológicas de teleósteos brasileiros: VI. Variáveis do jundiá Rhamdia quelen (Pimelodidae). Ciência Rural 32: 693-698. doi: 10.1590/S0103-84782002000400024
» https://doi.org/10.1590/S0103-84782002000400024 - Tavares-Dias M, Bozzo FR, Sandrin EFS, Campos-Filho E, Moares FR (2004) Células sanguíneas, eletrólitos séricos, relação hepato e esplenossomática de carpa comum, Cyprinus carpio (Cyprinidae) na primeira maturação gonadal. Acta Scientiarum Biological Sciences 26: 73-80. doi: 10.4025/actascibiolsci.v26i1.1661
» https://doi.org/10.4025/actascibiolsci.v26i1.1661 - Thurman EM (1985) Organic geochemistry of natural waters. Dordrecht, Martinus Nijhof, Dr. W. Junk Publishers, 507p.
- Verdouw H, Van Echteld CJA, Dekkers EMJ (1978) Ammonia determination based on indophenols formation with sodium salicylate. Water Research 12: 399-402. doi: 10.1016/0043-1354(78)90107-0
» https://doi.org/10.1016/0043-1354(78)90107-0 - Wendelaar Bonga SE (1997) The stress response in fish. Physiology Reviews 77: 591-625.
- Wilson RW, Wood CM, Gonzalez RJ, Patrick ML, Bergman HL, Narahara A, Val AL (1999) Ion acid-base balance in three species of Amazonian fish during gradual acidication of extremely soft water. Physiological and Biochemical Zoology 72: 277-285.
- Wood CM, McDonald DG (1982) Physiological mechanisms of acid toxicity to fish, p. 197-226. In: Johnson RE (Ed.). Acid Rain/Fisheries: Proceedings of an International Sympo sium on Acid Precipitation and Fishery Impacts in North-Eastern North America. Ithaca, American Fisheries Society.
- Wood CM, Wilson RW, Gonzalez RJ, Patrick ML, Bergaman HL, Narahara A, Val AL (1998) Responses of an Amazonian teleost, the tambaqui (Colossoma macropomum) to low pH in extremely soft water. Physiologycal and Biochemical Zoology 71: 658-670.
- Wood CM (2001) Toxic response of the gill, p. 1-89. In: Schlenk D, Benson WH (Eds.). Target organ toxicity in marine and freshwater teleosts. London, Taylor & Francis.
- Wood CM, Matsuo AYO, Gonzalez RJ, Wilson RW, Patrick ML, Val AL (2002) Mechanisms of ion transport in Potamotrygon, a stenohaline freshwater elasmobranch native to the ion-poor blackwaters of the Rio Negro. Journal of Experimental Biology 205: 3039-3054.
- Wood CM, Matsuo AYO, Wilson RW, Gonzalez RJ, Patrick ML, Playle RC, Val AL (2003) Protection by natural blackwater against disturbances in ion fluxes caused by low pH exposure in freshwater stingrays endemic to the Rio Negro. Physiological and Biochemical Zoology 76: 12-27. doi: 10.1086/367946
» https://doi.org/10.1086/367946 - Wood CM, Al-Reasi HA, Scott DS (2011) The two faces of DOC. Aquatic Toxicology 105S: 3-8. doi: 10.1016/j.aquatox.2011.03.007
» https://doi.org/10.1016/j.aquatox.2011.03.007 - Zaions MI, Baldisserotto B (2000) Na+ and K+ body levels and survival of fingerlings of Rhamdia quelen (Siluriformes, Pimelodidae) exposed to acute changes of water pH. Ciência Rural 30: 1041-1045. doi: 10.1590/S0103-84782000000600020
» https://doi.org/10.1590/S0103-84782000000600020 - Zall DM, Fisher M, Garner MQ (1956) Photometric determination of chlorides in water. Analytical Chemistry 28: 1665-1678. doi: 10.1021/ac60119a009
» https://doi.org/10.1021/ac60119a009
Publication Dates
-
Publication in this collection
May-Jun 2015
History
-
Received
13 Nov 2014 -
Reviewed
03 Apr 2015 -
Accepted
22 Apr 2015