
Abstract
The genotype x environment interaction is frequently observed in many crops and studies on environmental stratification and genotype adaptability have been proposed to understand it. The aim of this study was to carry out factor analysis in data from multi-environment experiments by the mixed model approach (REML/BLUP). Instead of adjusted phenotypic means, a matrix containing the genotypic effects added to the effects of the genotype x environment interaction (G+GE) was used, predicted via REML/BLUP in joint analysis (designated as R-FGGE). In the study, data from 36 common bean lines evaluated in 15 environments were used. By this proposal, 46.7% of the environments were gathered in two groups, one with four and the other with three environments. The R-FGGE has the same characteristics as the previous proposals, that is, ease of identification of mega-environments and genotypes with broad adaptability, along with the advantages associated with the mixed model methodology.
Key words:
Genotype x environment interaction; adaptability; environmental stratification; multivariate analysis
INTRODUCTION
Plant breeders consistently come up against the phenomenon of the genotype x environment interaction (GxE) in the activities of breeding programs, especially in the phases of evaluating genotypes for recommendation to producers. These genotypes are thoroughly evaluated through more replications, crop years, locations, and crop seasons. Always with the purpose of obtaining a genotype with high yields, wide adaptability and high stability of performance (Barili et al. 2015Barili LD, Vale NM, Prado AL, Carneiro JES, Silva FF and Nascimento M (2015) Genotype-environment interaction in common bean cultivars with carioca grain cultivated in Brazil in the last 40 years. Crop Breeding and Applied Biotechnology 15: 244-250. ). When genotypes are evaluated in multi-environment tests, the need arises for studies on the GxE interaction.
Babić et al. (2010Babić V, Babić M, Ivanović M, Kraljević-Balalić M and Dimitrijević M (2010) Understanding and utilization of genotype-by-environment interaction in maize breeding. Genetika 42: 79-90.) report that several years have gone by trying to summarize the effects of the GxE interaction in only one univariate statistic (though it is conceptually multivariate) and they state that recent studies have shown this concept must be abandoned. Silva et al. (2011Silva GO, Carvalho ADF, Vieira JV and Benin G (2011) Verificação da adaptabilidade e estabilidade de populações de cenoura pelos métodos AMMI, GGE biplot e REML/BLUP. Bragantia 70: 494-501.) mentioned that methods that use a multivariate approach, such as the Additive Main Effects and Multiplicative Interaction (AMMI) model (Zobel et al. 1988Zobel R, Wright MJ and Gauch HG (1988) Statistical analysis of yield trial. Agronomy Journal 80: 388-393.) and Genotype plus Genotype x Environment (GGE) biplot (Yan et al. 2000Yan W, Hunt LA, Sheng Q and Szlavnics Z (2000) Cultivar evaluation and mega-environment investigation based on the GGE biplot. Crop Science 40: 597-605. ), more properly explain the main effects (genotypes and environments) and their interaction. Another multivariate method, proposed by Murakami and Cruz (2004Murakami DM and Cruz CD (2004) Proposal of methodologies for environment stratification and analysis of genotype adaptability. Crop Breeding and Applied Biotechnology 4: 7-11.), is factor analysis of the matrix of the adjusted phenotypic mean values of the genotypes in the environments. Various authors have made use of this method to perform environmental stratification. Ribeiro and Almeida (2011Ribeiro JZ and Almeida MIM (2011) Estratificação ambiental pela análise da interação genótipo x ambiente em milho. Pesquisa Agropecuária Brasileira 46: 875-883.), comparing environmental stratification by different methods, have concluded that factor analysis is more realistic and informative and that it more efficiently considers the magnitude of the GxE interaction of genotypes in maize. Garbuglio et al. (2007Garbuglio DD, Gerage AC, Araújo PM, Fonseca Junior NS and Shioga PS (2007) Análise de fatores e regressão bissegmentada em estudos de estratificação ambiental e adaptabilidade em milho. Pesquisa Agropecuária Brasileira 42: 183-191.), like Murakami and Cruz (2004Murakami DM and Cruz CD (2004) Proposal of methodologies for environment stratification and analysis of genotype adaptability. Crop Breeding and Applied Biotechnology 4: 7-11.), observed the efficiency of environmental stratification by factor analysis in studying adaptability on maize. Garbuglio and Ferreira (2015Garbuglio DD and Ferreira DF (2015) FGGE method: description and application in data from maize cultivars. Euphytica 204: 723-737.) later proposed a modification to the Murakami and Cruz (2004Murakami DM and Cruz CD (2004) Proposal of methodologies for environment stratification and analysis of genotype adaptability. Crop Breeding and Applied Biotechnology 4: 7-11.) method through the use of factor analysis in the matrix of genotypic effects (G) added to the effects of the genotype x environment interaction (GE), both fixed, obtained via the ordinary least squares method in joint analysis, designated as FGGE. The authors mentioned that this modification resulted in more precise estimates.
An aspect common to these multivariate techniques is the procedure of considering the genotypic effects as fixed. According to Resende and Duarte (2007Resende MDV and Duarte JB (2007) Precisão e controle de qualidade em experimentos de avaliação de cultivares. Pesquisa Agropecuária Tropical 37: 182-194.), considering the genotype effects as random with a view toward obtaining the Best Linear Unbiased Predictions (BLUPs) of the aforementioned effects under the mixed model approach is more advantageous for breeding purposes because they result in more accurate predictions of the mean future performances of the genotypes.
Seeking to solve this problem, Piepho (1998Piepho HP (1998) Empirical best linear unbiased prediction in cultivar trials using factor analytic variance-covariance structures. Theoretical and Applied Genetics 97: 195-201.) proposed the factor analytic multiplicative mixed models (FAMM), analogous to the AMMI, however, considering the genotypic effects as random. Other options, reported by Resende (2007Resende MDV (2007) Matemática e estatística na análise de experimentos e no melhoramento genético. Embrapa Florestas, Colombo, 435p.), are the Multivariate Linear Mixed Model (MLMM), and principal component analysis under mixed models (PCAM). However, these three techniques have high computational cost and, in some cases, difficulty in reaching convergence. An intermediate alternative is the use of genotypic BLUPs and/or BLUPs of the interaction, predicted in joint analysis via REML/BLUP, instead of the adjusted phenotypic value, recently proposed in the AMMI and GGE analyses.
The aim of this study was to propose a modification of the Murakami and Cruz (2004Murakami DM and Cruz CD (2004) Proposal of methodologies for environment stratification and analysis of genotype adaptability. Crop Breeding and Applied Biotechnology 4: 7-11.) method by using factor analysis in the matrix of the G+GE effects predicted via REML/BLUP for the study of adaptability and environmental stratification.
MATERIAL AND METHODS
Experiments
Data from the lines of the Common Bean Breeding Program of the Universidade Federal de Lavras (Federal University of Lavras), Lavras, Minas Gerais, Brazil, were used for this study. The lines are part of an elite group of the program and were evaluated in the biennial 2006-2008 in three locations of the state of Minas Gerais (Lavras, Lambari, and Patos de Minas) and three crop years, for a total of 18 environments. In these experiments, 36 common bean lines were evaluated in a triple square lattice design. Plots consisted of two 4-m rows and the variable measured was yield, in g plot-1.
Statistical Analyses
Individual and multi-environment analyses
Individual and joint analyses were performed in the R 3.2.1 Program and Statistical Environment (R Core Team 2015R Core Team (2015) R: A language and environment for statistical computing. R Foundation for Statistical Computing, Vienna. Available at <Available at http://www.R-project.org/
>. Accessed in June 2015.
http://www.R-project.org/...
) using the mixed model approach of Henderson. Estimation of the variance components was made via Restricted Maximum Likelihood (REML) through the lmer function of the lme4 package (Bates et al. 2015Bates D, Maechler M, Bolker B and Walker S (2015) Fitting linear mixed-effects models using lme4. Journal of Statistical Software 67: 1-48. ). The significance of the random effects was verified by the Likelihood Ratio Test (LRT) at 5% probability by the rand function of the lmerTest package (Kuznetsova et al. 2015Kuznetsova A, Brockhoff PB and Christensen RHB (2015) lmerTest: Tests in linear mixed effects models. R package version 2.0-25. Available at <Available at http://CRAN.R-project.org/ package=lmerTest
>. Accessed in June 2015.
http://CRAN.R-project.org/ package=lmerT...
).
Individual analyses of grain yield data were performed according to the following model:
y = Xc + Zg + Wb + e
in which y is the data vector; c is the vector of the fixed effects of replications added to the overall mean; g is the vector of the genotypic effects, with g ~ NMV(0,Iσ²g ); b is the vector of the effects of blocks, with b ~ NMV(0,Iσ²b); and e is the error vector, with e ~ NMV(0,Iσ²e). The uppercase letters (X, Z, and W) represent the incidence matrices for the aforementioned effects.
The homogeneity of the residual variances was verified by the LRT test. In addition, the quality of the experiments was checked by the accuracy statistic ( ), presented in Resende and Duarte (2007Resende MDV and Duarte JB (2007) Precisão e controle de qualidade em experimentos de avaliação de cultivares. Pesquisa Agropecuária Tropical 37: 182-194.)

in which r is the number of replications.
Since most of the experiments (73.3%) do not show significant variation (P < 0.05) among blocks within replications, the choice was made to undertake multi-environment analysis under a randomized complete block design (RCBD). Statistical analyses of the multi-environment data were made according to the following model:
y = Xf + Zg + Wge + e
in which y is the data vector; f is the vector of the fixed effects of the replication-environment combinations added to the general mean; g is the vector of the genotypic effects, with g ~ NMV (0,Iσ²g ); ge is the vector of the effects of the genotype x environment interaction, with ge ~ NMV (0,Iσ²ge ); and e is the vector of errors or residues, with e ~ NMV (0,Iσ²e ). Uppercase letters represent the incidence matrices for the aforementioned effects.
Factor analysis of the G+GE matrix
Factor analysis was applied to the matrix whose elements consist of the sum of the BLUPs of the genotypic effects and the BLUPs of the effects of the interaction (G+GE), which were obtained from multi-environment analysis. The proposal for modification of the Murakami and Cruz (2004Murakami DM and Cruz CD (2004) Proposal of methodologies for environment stratification and analysis of genotype adaptability. Crop Breeding and Applied Biotechnology 4: 7-11.) method modified by Gabuglio and Ferreira (2015Garbuglio DD and Ferreira DF (2015) FGGE method: description and application in data from maize cultivars. Euphytica 204: 723-737.), mentioned above, will here be denoted as R-FGGE.
The model for R-FGGE, considering p lines evaluated in n environments, may be expressed in the following manner for each column or environment j of the G+GE matrix: 
in which βjk is the factorial loading for the j-th environment associated with the k-th factor, which reflects the importance of factor k in explanation of the variable or environment j; Fk is the k-th common factor; and εj is the specific factor associated with the j-th environment, which captures the specific variation not explained by the linear combination of the factorial loadings with the common factors.
For this analysis, the fa function of the psych package was used (Revelle 2015Revelle W (2015) Psych: procedures for personality and psychological research. R package version 1.5.4. Northwestern University, Evanston, Illinois, USA. Available at <Available at http://CRAN.R-project.org/package=psych
>. Accessed in June 2015.
http://CRAN.R-project.org/package=psych...
) considering the maximum likelihood factoring method (fm=ml) and the varimax rotation method, which maximizes the sum of squares of the deviations of the loadings.
To carry out environmental stratification, environments with a magnitude of final factorial loadings above 0.70, obtained after rotation, were considered in the same group, representing environments with high correction with that group and low correlation with the others (Murakami and Cruz 2004Murakami DM and Cruz CD (2004) Proposal of methodologies for environment stratification and analysis of genotype adaptability. Crop Breeding and Applied Biotechnology 4: 7-11.). Interpretation of the stability and adaptability of the lines was performed based on factor analysis, by graph analysis, plotting the scores obtained after rotation (Murakami and Cruz 2004, Garbuglio and Ferreira 2015).
RESULTS AND DISCUSSION
Individual and joint analyses
After performing the individual analysis, three of the eighteen experiments were excluded since they did not show significant effects of genotypes. The accuracies of the individual experiments were above 0.75, classified as high to very high in the experimental precision classes of Resende and Duarte (2007Resende MDV and Duarte JB (2007) Precisão e controle de qualidade em experimentos de avaliação de cultivares. Pesquisa Agropecuária Tropical 37: 182-194.), with the exception of A5 and A7, which exhibited accuracies of 0.67, i.e., moderate experimental precision. These results reinforce the quality of the experimental information for the purpose of making inferences regarding the lines under testing.
To perform conventional joint analysis of variance, it is necessary to test the assumption of homogeneity of the residual variances. Nevertheless, the presence of heterogeneity of variances is common in multi-environment trials and it may affect the reliability of selection. The mixed model approach is a more elegant and flexible procedure for dealing with this situation because this approach allows different structures to be taken up in the residual covariance matrix. In this study, this assumption was not satisfied by the LRT test (P < 0.05). The deviance (-2 Residual Log-Likelihood) of the model assuming homoscedasticity was -21,095.8, whereas the value to the heteroscedasticity structure was -20,923.9. Therefore, the microenvironmental variances were relatively different, which results in different precisions for comparison of the lines. Another advantage of the mixed model methodology is that it better deals with unbalanced data, resulting in more accurate estimates and predictions (Smith et al. 2005Smith AB, Cullis BR and Thompson R (2005) The analysis of crop cultivar breeding and evaluation trials: an overview of current mixed model approaches. Journal of Agricultural Science 143: 449-462., Fritsche-Neto et al. 2010aFritsche-Neto R, Gonçalves MC, Vencovsky R and Souza Jr. CL (2010a) Prediction of genotypic values of maize hybrids in unbalanced experiments. Crop Breeding and Applied Biotechnology 10: 32-39. ).
Through multi-environment analysis, it was found that the genotypic effects of the lines and of the line by environment interaction were significant by the LRT test (Table 1). These results demonstrate the genetic variation among the lines, as well as indicate that they performed in a differentiated manner in the environments evaluated. There is therefore the need to carry out a more detailed study of the line by environment interaction, allowing discrimination of mega-environments, as well as of lines, in regard to adaptability.
Environmental stratification is warranted by the need to direct the efforts of a plant breeding program and its financial and human resources so that recommendation of adapted and stable genotypes for specific conditions be as accurate as possible. This reduction in the number of environments tested allows the inclusion of new environments not previously considered, or experiments with more replications in the test environments, leading to more precise results. In this context, some methods have been proposed to carry out this stratification; among them, the factor analysis approach (Murakami and Cruz 2004Murakami DM and Cruz CD (2004) Proposal of methodologies for environment stratification and analysis of genotype adaptability. Crop Breeding and Applied Biotechnology 4: 7-11., Garbuglio and Ferreira 2015Garbuglio DD and Ferreira DF (2015) FGGE method: description and application in data from maize cultivars. Euphytica 204: 723-737.) proves to be quite interesting, through adequately utilizing data from multi-environment experiments and, above all, through its interpretability.
Factor analysis of the G+GE matrix
In regard to factor analysis, one of the most important aspects is in regard to the number of factors to be retained. A commonly adopted criterion is to retain the factors whose eigenvalues are greater than or equal to 1.0 (Kaiser-Guttman criterion); or, if the explanatory proportion of these factors is low, a set of factors should be used which explain up to 80% of the total variation (Garbuglio et al. 2007Garbuglio DD, Gerage AC, Araújo PM, Fonseca Junior NS and Shioga PS (2007) Análise de fatores e regressão bissegmentada em estudos de estratificação ambiental e adaptabilidade em milho. Pesquisa Agropecuária Brasileira 42: 183-191., Mendonça et al. 2007Mendonça O, Carpentieri-Pípolo V, Garbuglio DD and FonsecaJunior NS (2007) Análise de fatores e estratificação ambiental na avaliação da adaptabilidade e estabilidade em soja. Pesquisa Agropecuária Brasileira 42: 1567-1575., Fritsche-Neto et al. 2010bFritsche-Neto R, Miranda GV, Delima RO and Souza HN (2010b) Factor analysis and SREG GGE biplot for the genotype × environment interaction stratification in maize. Ciência Rural 40: 1043-1048., Ribeiro and Almeida 2011Ribeiro JZ and Almeida MIM (2011) Estratificação ambiental pela análise da interação genótipo x ambiente em milho. Pesquisa Agropecuária Brasileira 46: 875-883.). In this study, 80% of the variation is achieved from six factors, which is fewer than the number of factors indicated by the eigenvalues greater than 1.0 (seven). Nevertheless, factor analysis concentrates a maximum of variation on the first axes, leaving little variation for the latter ones, as well as a lot of noise. As may be observed in Table 2, with only one axis, 61% of the total variation is captured and, for each additional axis, the proportion of added variation is low (4%, on average). In the study of Murakami and Cruz (2004Murakami DM and Cruz CD (2004) Proposal of methodologies for environment stratification and analysis of genotype adaptability. Crop Breeding and Applied Biotechnology 4: 7-11.), the first two axes accounted for 81%, 67.3%, and 60.31% of the total variation accounted for in their three crop seasons. Garbuglio et al. (2007Garbuglio DD, Gerage AC, Araújo PM, Fonseca Junior NS and Shioga PS (2007) Análise de fatores e regressão bissegmentada em estudos de estratificação ambiental e adaptabilidade em milho. Pesquisa Agropecuária Brasileira 42: 183-191.) obtained 65.8% of the total variation accounted for in the first two axes, and Ribeiro and Almeida (2011Ribeiro JZ and Almeida MIM (2011) Estratificação ambiental pela análise da interação genótipo x ambiente em milho. Pesquisa Agropecuária Brasileira 46: 875-883.) observed that the first two axes contained 64.73% of the total variation. Brian (2005Brian SE (2005) An R and S-PLUS(r) companion to multivariate analysis. Springer-Verlag, Londres, 221p. ) reports that in situations with few factors used, these few factors will have many high loadings, whereas in situations with many factors, its may be fragmented, hindering interpretation of a convincing nature. This result may be observed in Table 3, where analysis with two factors grouped 4 environments on the first axis and 3 on the second axis and, in the other situations, there was no grouping but rather a scattering of the environments among the axes. Fritsche-Neto et al. (2010bFritsche-Neto R, Miranda GV, Delima RO and Souza HN (2010b) Factor analysis and SREG GGE biplot for the genotype × environment interaction stratification in maize. Ciência Rural 40: 1043-1048.) and Ribeiro and Almeida (2011Ribeiro JZ and Almeida MIM (2011) Estratificação ambiental pela análise da interação genótipo x ambiente em milho. Pesquisa Agropecuária Brasileira 46: 875-883.) obtained similar results, in which environments were spread out by the factors and, as a result, no grouping was obtained.
Another important point is the question of the interpretability provided by graph analysis or biplots. In AMMI analysis, it is common to use the first two axes to facilitate interpretation of the results, and up to three axes may be used. In the GGE Biplot, the standard is to use the first two axes for graph analysis. Using the AMMI procedure, Mohammadi and Amri (2009Mohammadi R and Amri A (2009) Analysis of genotype×environment interactions for grain yield in durum wheat. Crop Science 49: 1177-1186.) found that 66.51% of the variation was explained by the first two axes. Oliveira et al. (2010Oliveira RL, Pinho RGV, Balestre M and Ferreira DV (2010) Evaluation of maize hybrids and environmental stratification by the methods AMMI and GGE biplot. Crop Breeding and Applied Biotechnology 10: 247-253.) reported that the first two principal components captured 51.53% of the G+GE variation in the GGE Biplot analysis, and Balestre et al. (2009Balestre M, Souza JC, Pinho RGV, Oliveira RL and Paes MV (2009) Yield stability and adaptability of maize hybrids based on GGE biplot analysis characteristics. Crop Breeding and Applied Biotechnology 9: 219-228.) showed that 70.36% of the variation was explained by the first two axes, also with GGE Biplot.
According to Piepho (1995Piepho HP (1995) Robustness of statistical test for multiplicative terms in additive main effects and multiplicative interaction model for cultivar trial. Theoretical and Applied of Genetics 89: 438-443.), the number of axes to use is a choice and, in the literature, there is no consensus regarding the number of axes and the proportion of variation captured by them. In light of that, the decision made here was to focus on the first two factors, given the explanation provided by the first two factors (65%), and the ease of interpretability of the visual presentation with these first two axes.
From Table 3, it may be observed that the communalities obtained in the environments with factorial loadings above 0.69 were greater than 0.64, which, according to Cruz and Carneiro (2003Cruz CD and Carneiro PCS (2003) Modelos biométricos aplicados ao melhoramento genético. Volume 2. Editora UFV, Viçosa, 585p.), may be classified as a reasonable level through representing a correlation near 0.80 between the original variable and the common part, which explains this variable. The other communalities are less than this value, indicating that the environments do not show correlation with the factors.
R-FGGE analysis with two factors allowed environmental stratification to be carried out, grouping half of the environments tested on the two axes. Environments A1, A3, A9, and A13 were grouped on factor 1, and environments A2, A5, and A12 on factor 2 (Table 3). The environments contained in each factor, for the most part, exhibit high correlations among themselves. The pair by pair analyses undertaken for the environments that were grouped showed a lack of significance of the effect of the genotype x environment interaction. Similar results were obtained by Murakami and Cruz (2004Murakami DM and Cruz CD (2004) Proposal of methodologies for environment stratification and analysis of genotype adaptability. Crop Breeding and Applied Biotechnology 4: 7-11.), in which the authors estimated the correlation between the pairs of environments classified in the same factor, and the correlation of the pairs with the other non-grouped environments. They confirmed that the correlations between the environments grouped within a determined factor are high, and the correlation of the environments with the other non-grouped environments is low. Garbuglio et al. (2007Garbuglio DD, Gerage AC, Araújo PM, Fonseca Junior NS and Shioga PS (2007) Análise de fatores e regressão bissegmentada em estudos de estratificação ambiental e adaptabilidade em milho. Pesquisa Agropecuária Brasileira 42: 183-191.) broke down the interaction in simple and complex parts for all the pairs of environments and observed that the environments grouped in the same factor contained a large part of the interaction as simple. These results were also observed by Mendonça et al. (2007Mendonça O, Carpentieri-Pípolo V, Garbuglio DD and FonsecaJunior NS (2007) Análise de fatores e estratificação ambiental na avaliação da adaptabilidade e estabilidade em soja. Pesquisa Agropecuária Brasileira 42: 1567-1575.) and Ribeiro and Almeida (2011Ribeiro JZ and Almeida MIM (2011) Estratificação ambiental pela análise da interação genótipo x ambiente em milho. Pesquisa Agropecuária Brasileira 46: 875-883.). These results confirm the efficiency of the groupings obtained via factor analyses after rotation. The environments grouped in the same factor show high correlations among themselves and low correlations with the other non-grouped environments; in addition, they do not show significance of the effect of the genotype x environment interaction.
From Figure 1, quadrant I (Q1), it may be perceived that lines L10, L17, L18, L22, L32, L33, L34 and L35 showed broad adaptability to the group of environments that belong to the groups formed by the first two factors, i.e., to environments A1, A2, A3, A5, A9, A12, and A13. Lines L5, L15, L16, L19, L20, L23, L29 and L31 lie in quadrant IV (Q4) and, for that reason, are classified as adapted to the environments grouped by factor 1 (A1, A3, A9, and A13). Lines L1, L2, L3, L21, L25, L26, L28, L30, and L36, for their part, showed specific adaptability to environments A2, A5, and A12 grouped by factor 2 (Figure 1). The other genotypes, situated in quadrant III (Q3), proved to have low performance in the grouped environments.
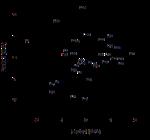
With these results, the breeder may choose to maximize the GxE interaction, using it in his favor, by selecting the individuals specifically adapted to the environment, indicating the genotypes contained in quadrants II and IV for their respective environments, or selecting genotypes with broad adaptation, like those situated in quadrant I.
All the lines plotted in Q1 showed high BLUPs, indicating that they are subject to selection for participation in VCU trials. The lines lying in Q2 and Q4 show intermediate values, whereas the lines contained in Q3 are the least productive and, for that reason, should be discarded. Garbuglio et al. (2007Garbuglio DD, Gerage AC, Araújo PM, Fonseca Junior NS and Shioga PS (2007) Análise de fatores e regressão bissegmentada em estudos de estratificação ambiental e adaptabilidade em milho. Pesquisa Agropecuária Brasileira 42: 183-191.), using the adjusted mean values of maize experiments and three axes, capturing 73.7% of the total variation, observed that the genotypes that fell in Q1 have the greatest mean values, and those that fell in Q3 were the least productive. The intermediate genotypes lay in Q2 and Q4. These results corroborate the efficiency of the method, even using less than 80% of the variation.
In short, it may be concluded that the R-FGGE technique is highly propitious for use by breeders because of its easy interpretation, along with the advantages of mixed models, making more detailed study of the phenomenon of the genotype x environment interaction possible through the formation of potential mega-environments and also through selection of genotypes with broad adaptability or that exhibit specific adaptability.
REFERENCES
- Babić V, Babić M, Ivanović M, Kraljević-Balalić M and Dimitrijević M (2010) Understanding and utilization of genotype-by-environment interaction in maize breeding. Genetika 42: 79-90.
- Balestre M, Souza JC, Pinho RGV, Oliveira RL and Paes MV (2009) Yield stability and adaptability of maize hybrids based on GGE biplot analysis characteristics. Crop Breeding and Applied Biotechnology 9: 219-228.
- Barili LD, Vale NM, Prado AL, Carneiro JES, Silva FF and Nascimento M (2015) Genotype-environment interaction in common bean cultivars with carioca grain cultivated in Brazil in the last 40 years. Crop Breeding and Applied Biotechnology 15: 244-250.
- Bates D, Maechler M, Bolker B and Walker S (2015) Fitting linear mixed-effects models using lme4. Journal of Statistical Software 67: 1-48.
- Brian SE (2005) An R and S-PLUS(r) companion to multivariate analysis. Springer-Verlag, Londres, 221p.
- Cruz CD and Carneiro PCS (2003) Modelos biométricos aplicados ao melhoramento genético. Volume 2. Editora UFV, Viçosa, 585p.
- Fritsche-Neto R, Gonçalves MC, Vencovsky R and Souza Jr. CL (2010a) Prediction of genotypic values of maize hybrids in unbalanced experiments. Crop Breeding and Applied Biotechnology 10: 32-39.
- Fritsche-Neto R, Miranda GV, Delima RO and Souza HN (2010b) Factor analysis and SREG GGE biplot for the genotype × environment interaction stratification in maize. Ciência Rural 40: 1043-1048.
- Garbuglio DD and Ferreira DF (2015) FGGE method: description and application in data from maize cultivars. Euphytica 204: 723-737.
- Garbuglio DD, Gerage AC, Araújo PM, Fonseca Junior NS and Shioga PS (2007) Análise de fatores e regressão bissegmentada em estudos de estratificação ambiental e adaptabilidade em milho. Pesquisa Agropecuária Brasileira 42: 183-191.
- Kuznetsova A, Brockhoff PB and Christensen RHB (2015) lmerTest: Tests in linear mixed effects models. R package version 2.0-25. Available at <Available at http://CRAN.R-project.org/ package=lmerTest >. Accessed in June 2015.
» http://CRAN.R-project.org/ package=lmerTest - Mendonça O, Carpentieri-Pípolo V, Garbuglio DD and FonsecaJunior NS (2007) Análise de fatores e estratificação ambiental na avaliação da adaptabilidade e estabilidade em soja. Pesquisa Agropecuária Brasileira 42: 1567-1575.
- Mohammadi R and Amri A (2009) Analysis of genotype×environment interactions for grain yield in durum wheat. Crop Science 49: 1177-1186.
- Murakami DM and Cruz CD (2004) Proposal of methodologies for environment stratification and analysis of genotype adaptability. Crop Breeding and Applied Biotechnology 4: 7-11.
- Oliveira RL, Pinho RGV, Balestre M and Ferreira DV (2010) Evaluation of maize hybrids and environmental stratification by the methods AMMI and GGE biplot. Crop Breeding and Applied Biotechnology 10: 247-253.
- Piepho HP (1995) Robustness of statistical test for multiplicative terms in additive main effects and multiplicative interaction model for cultivar trial. Theoretical and Applied of Genetics 89: 438-443.
- Piepho HP (1998) Empirical best linear unbiased prediction in cultivar trials using factor analytic variance-covariance structures. Theoretical and Applied Genetics 97: 195-201.
- R Core Team (2015) R: A language and environment for statistical computing. R Foundation for Statistical Computing, Vienna. Available at <Available at http://www.R-project.org/ >. Accessed in June 2015.
» http://www.R-project.org/ - Resende MDV (2007) Matemática e estatística na análise de experimentos e no melhoramento genético. Embrapa Florestas, Colombo, 435p.
- Resende MDV and Duarte JB (2007) Precisão e controle de qualidade em experimentos de avaliação de cultivares. Pesquisa Agropecuária Tropical 37: 182-194.
- Revelle W (2015) Psych: procedures for personality and psychological research. R package version 1.5.4. Northwestern University, Evanston, Illinois, USA. Available at <Available at http://CRAN.R-project.org/package=psych >. Accessed in June 2015.
» http://CRAN.R-project.org/package=psych - Ribeiro JZ and Almeida MIM (2011) Estratificação ambiental pela análise da interação genótipo x ambiente em milho. Pesquisa Agropecuária Brasileira 46: 875-883.
- Silva GO, Carvalho ADF, Vieira JV and Benin G (2011) Verificação da adaptabilidade e estabilidade de populações de cenoura pelos métodos AMMI, GGE biplot e REML/BLUP. Bragantia 70: 494-501.
- Smith AB, Cullis BR and Thompson R (2005) The analysis of crop cultivar breeding and evaluation trials: an overview of current mixed model approaches. Journal of Agricultural Science 143: 449-462.
- Yan W, Hunt LA, Sheng Q and Szlavnics Z (2000) Cultivar evaluation and mega-environment investigation based on the GGE biplot. Crop Science 40: 597-605.
- Zobel R, Wright MJ and Gauch HG (1988) Statistical analysis of yield trial. Agronomy Journal 80: 388-393.
Publication Dates
-
Publication in this collection
Mar 2016
History
-
Received
04 Apr 2014 -
Accepted
09 Sept 2015


