Abstracts
Atorvastatin (ATV) is an antilipemic drug of great interest to the pharmaceutical industry. ATV does not appear in the monographs of Brazilian pharmacopoeia, and analytical methodologies for its determination have been validated. The chromatographic conditions used included: RP-18 column-octadecylsilane (250 x 4.6 mm, 5 mm), detection at 238 nm, mobile phase containing 0.1% phosphoric acid and acetonitrile (35:65% v/v), flow at 1.5 mL min-1, oven temperature at 30ºC, and injection volume of 10 mL. ATV is classified as a class II product, according to the biopharmaceutical classification system. As such, a dissolution test was proposed to evaluate pharmaceutical formulations on the market today, under the following conditions: water as a dissolution medium, 1000 mL as a volume, paddle apparatus at a rotation speed of 50 rpm, 80% (Q) in 15 minutes with UV spectrophotometer readings at 238 nm. In the pattern condition proposed as the ideal dissolution test, which appropriately differentiates amongst formulations, the generic product was not considered pharmaceutically equivalent; however, in other less differential dissolution methods, which also fall within appropriate legal parameters, this product could come to be regarded as generic.
Pharmaceutical formulations; Atorvastatin; Drugs; Drugs
Atorvastatina (ATV) é um fármaco antilipêmico de grande interesse para a indústria farmacêutica. ATV não apresenta monografia na Farmacopéia Brasileira e metodologias analíticas para sua determinação foram validadas. As condições cromatográficas utilizadas foram: coluna RP-18-octadecilsilano (250 x 4.6 mm, 5 mm), detecção em 238 nm, fase móvel contendo ácido fosfórico 0,1% e acetonitrila (35:65% v/v), fluxo de 1,5 mL min-1, temperatura do forno de 30 ºC e volume de injeção de 10 mL. ATV é classificada como um fármaco de classe II, de acordo com o sistema de classificação biofarmacêutica (SCB). Como tal, um teste de dissolução foi proposto para avaliar as formulações farmacêuticas do mercado atual, sob as seguintes condições: água como meio de dissolução, volume de 1000 mL, aparato pá, velocidade de rotação de 50 rpm, 80% (Q) em 15 minutos com leituras espectrofotômetro UV a 238 nm. Na condição padrão proposta para o teste de dissolução, o qual seria capaz de diferenciar apropriadamente as formulações farmacêuticas, o produto genérico não foi considerado equivalente farmacêutico. No entanto, em outros métodos de dissolução menos discriminativos, que também seriam considerados apropriados pelos parâmetros legais, este produto pode vir a ser considerado como genérico.
Formulações farmacêuticas; Atorvastatina; Fármacos; Fármacos
ARTICLE
Developing methods to compare tablet formulations of atorvastatin
Marcelo Antonio de Oliveira* * Correspondence: M. A. Oliveira. Centro Universitário Norte do Espírito Santo, Universidade Federal Espirito Santo. Rodovia BR 101 Norte, km 60, 29932-540 - São Mateus - ES, Brasil. E-mail: oliveirama.ufes@gmail.com ; Caroline Dutra Lacerda; André Fazôlo Bonella
University Center of the North of Espirito Santo, Federal University of Espirito Santo
ABSTRACT
Atorvastatin (ATV) is an antilipemic drug of great interest to the pharmaceutical industry. ATV does not appear in the monographs of Brazilian pharmacopoeia, and analytical methodologies for its determination have been validated. The chromatographic conditions used included: RP-18 column-octadecylsilane (250 x 4.6 mm, 5 mm), detection at 238 nm, mobile phase containing 0.1% phosphoric acid and acetonitrile (35:65% v/v), flow at 1.5 mL min-1, oven temperature at 30ºC, and injection volume of 10 mL. ATV is classified as a class II product, according to the biopharmaceutical classification system. As such, a dissolution test was proposed to evaluate pharmaceutical formulations on the market today, under the following conditions: water as a dissolution medium, 1000 mL as a volume, paddle apparatus at a rotation speed of 50 rpm, 80% (Q) in 15 minutes with UV spectrophotometer readings at 238 nm. In the pattern condition proposed as the ideal dissolution test, which appropriately differentiates amongst formulations, the generic product was not considered pharmaceutically equivalent; however, in other less differential dissolution methods, which also fall within appropriate legal parameters, this product could come to be regarded as generic.
Uniterms: Pharmaceutical formulations/evaluation. Atorvastatin. Drugs/dissolution test. Drugs/qualitative analysis.
RESUMO
Atorvastatina (ATV) é um fármaco antilipêmico de grande interesse para a indústria farmacêutica. ATV não apresenta monografia na Farmacopéia Brasileira e metodologias analíticas para sua determinação foram validadas. As condições cromatográficas utilizadas foram: coluna RP-18-octadecilsilano (250 x 4.6 mm, 5 mm), detecção em 238 nm, fase móvel contendo ácido fosfórico 0,1% e acetonitrila (35:65% v/v), fluxo de 1,5 mL min-1, temperatura do forno de 30 ºC e volume de injeção de 10 mL. ATV é classificada como um fármaco de classe II, de acordo com o sistema de classificação biofarmacêutica (SCB). Como tal, um teste de dissolução foi proposto para avaliar as formulações farmacêuticas do mercado atual, sob as seguintes condições: água como meio de dissolução, volume de 1000 mL, aparato pá, velocidade de rotação de 50 rpm, 80% (Q) em 15 minutos com leituras espectrofotômetro UV a 238 nm. Na condição padrão proposta para o teste de dissolução, o qual seria capaz de diferenciar apropriadamente as formulações farmacêuticas, o produto genérico não foi considerado equivalente farmacêutico. No entanto, em outros métodos de dissolução menos discriminativos, que também seriam considerados apropriados pelos parâmetros legais, este produto pode vir a ser considerado como genérico.
Unitermos: Formulações farmacêuticas/avaliação. Atorvastatina. Fármacos/teste de dissolução. Fármacos/análise qualitativa.
INTRODUCTION
Lipitor®, the reference product of atorvastatin calcium tablets, has been the world's top selling drug in 2012, yielding a revenue of approximately $8 billion for the manufacturer Pfizer. According to the Brazilian Association of Generic Products, in 2008, Lipitor® sold over 1.3 million units, representing a turnover of U.S. $85 million, ranking third in Brazilian pharmaceutical industry sales (Blenkinsopp, 2003; Neuman, 2010).
Atorvastatin (ATV) is used to reduce the levels of lipoproteins, which are rich in cholesterol, as well as the risk of coronary artery disease (CAD). This is due to the inhibitory action that the drug has on the hydroxymethylglutaryl-CoA reductase (HMG-CoA reductase) enzyme which is important in the biosynthesis of cholesterol (Gomes, 2008).
ATV (I) has a molecular formula of C66H68CaF2N4O10.3H2O and a molecular weight of 1209.4 g/mol. It is a white crystalline powder with a partition coefficient (log P (octanol/water)) of 6.36, a constant dissociation (pKa) of 4.46, and a fusion of between 159.2ºC and 160.7ºC. The drug is insoluble in aqueous solutions at pH <; 4.0; very slightly soluble in water, phosphate buffer (pH 7.4), and acetonitrile; slightly soluble in ethanol; and very soluble in methanol (Moffat et al., 2004; Shete et al., 2010).

ATV has no known registration in the Brazilian pharmacopoeia (Brasil, 2010a), but it can be found in one monograph in the American pharmacopoeia (USP, 2012). To perform a chemical analysis with secure and reliable results, and considering the possibility of using the methodology set forth by overseeing bodies, such as the Central Laboratories of Public Health, the validation of methods is of paramount importance in an attempt to provide evidence to support decisions and possible health interventions (Brasil, 2003a). For an analytical method to be considered officially validated, it must include suitable parameters, such as precision, accuracy, linearity, limit of detection and quantification, specificity, and robustness (Brasil, 2003a; ICH, 2005).
Specificity can be evaluated by analyzing drugs after having been submitted to stressful conditions, also called intrinsic or inherent stability, under the effect of temperature, humidity oxidation, exposure to UV light, and hydrolysis at different pH values (ICH, 2005; ICH , 2003; Brasil, 2005; Silva et al., 2009).
The reliability of the analytical method by high performance liquid chromatography is also verified by the system's suitability parameters, or "performance parameters". The main parameters evaluated included: retention factor (k'), number of theoretical plates (N), resolution (Rs), and asymmetry or tailing factor (T) (Brasil, 2010a; ICH, 2005). The retention factor (k') evaluates the analyte's degree of affinity with the stationary phase. The optimum value of k' should be between 0.5 and 20, according to Snyder et al. (1997), or be larger than 2, according to the FDA (1994) and Swartz and Krull (1998) (Snyder et al., 1997; FDA, 1994; Swartz; Krull, 1998). The number of theoretical plates (N) estimates the efficiency of the column upon separation of the analyte, which should be at least 2000 plates/column (ICH, 2005; FDA, 1994; Ribani et al., 2004). According to Snyder et al. (1997) and Swartz and Krull (1998), resolution (Rs) represents the parameter that quantifies the degree of separation between two substances, which should be greater than 1.5, whereas Ribani et al. (2004) report that this value must be greater than 2 (Snyder, 1997; Swartz, Krull, 1998; Ribani et al., 2004). The tailing factor (T) evaluates the symmetry of the peak, which should have a value of 1 when the peak is perfectly symmetrical. T values of less than or equal to 2 are also acceptable (Brasil, 2010a; FDA, 1994; Ribani et al., 2004).
The absorption of drugs from solid pharmaceutical forms, when administered orally, depends on their release, dissolution, or solubility under physiological conditions, as well as the drugs' permeability through the membranes of the gastrointestinal tract. Due to the critical nature, the in vitro dissolution test may well aid in predicting the in vivo performance (Brasil, 2003b).
ATV presents a low solubility in aqueous mediums and a high permeability and is therefore classified in the biopharmaceutical classification system (BCS) as a Class II drug (Amidon et al., 2004; Benet, 2006). For this class, the dissolution is the rate-limiting step in absorption and in vitro in vivo correlation (IVIVC) is to be expected (Brasil, 2003b; FDA, 1997).
To develop a dissolution test, one must: quantitatively evaluate the solubility of active ingredients in the physiological pH range of 1.2 to 6.8, considering the temperature of 37 ºC ± 1 ºC; demonstrate that the dissolution medium is the most appropriate for the active ingredient in the dosage form under investigation; demonstrate that the apparatus, the rotation, and the filters used in the sample collection procedure are best suited for the active ingredient and dosage form; demonstrate the need to use anchors (if applicable); demonstrate the need to use of surfactants and the relevant amount (if applicable); demonstrate and justify the choice of Q value (the quantities of active ingredient dissolved from the dosage units tested in percentage for the specified time); and justify the need for the deaeration (when applicable) (Brasil, 2010b).
The dissolution profile (percent dissolved versus time) allows one to guide the development and optimization of pharmaceutical formulations, to monitor manufacturing processes, to minimize the risk of a lack of bioequivalence between batches, to obtain the approval of registration with the competent organ, to search and detect the influence of critical variables in the production process, to establish the mechanism and release kinetics, to make an in vitro/in vivo correlation, and to make comparative studies of different formulations (Anderson et al., 1998; Castro et al., 2005; Pillay, Fassihi, 1998; Reis, 1998).
The dissolution profile is a comparative study performed with sampling at multiple times to assess the dissolution of a particular drug and to compare two formulations. Graphs are plotted, and the comparison of dissolution profiles of different formulations is performed by calculating the similarity factor (F2), according to equation 1 (Brasil, 2010b).

where: n = number of sampling times, Rt = value of percentage dissolved at time t, obtained with the reference product; Tt = percentage value of the test product dissolved at time t.
According to the RDC 31/2010, two dissolution profiles are considered similar if the similarity factor (F2) is between 50 and 100. The collection samples times must be the same for both the generic and reference formulations, and the number of sampling points must be representative (until a plateau in the curve has been reached) and should have at least five sampling times. In addition, the coefficients of variation for the first collection points should not exceed 20%, while the remaining points should not exceed 10% (Brasil, 2010b).
However, when the active ingredient presents a high solubility and the pharmaceutical formulation produces immediate release tablets, which present a very rapid dissolution for both drugs (average amount dissolved is no less than 85% of the labeled content expressed as percentage within 15 minutes). F2 factor loses its ability to discriminate; therefore, there is no need to calculate this factor. In such cases, it can be observed that the pharmaceutical formulations present a very rapid dissolution by release graphics, performing samples in times of 5, 10, 15, 20, and 30 minutes. The coefficient of variation at 15 minutes should not exceed 10% (Brasil, 2010b).
Another means through which to compare the dissolution profile is by calculating the dissolution efficiency (DE), introduced in 1972 by Khan and Rhodes, which is determined by the ratio of the percentage of the area under the curve (AUC), obtained from the dissolution profile, and by the total area of the rectangle, taken as 100% of dissolution for the same time interval. DE is calculated according to equation 2 (Anderson et al., 1998; Cárcamo, 1981).

where: yxdtx100= AUC at a time t, expressed in percentage; y100xt = area of the rectangle considering 100% dissolution at the same time t.
The results obtained by the F2 and DE may be theoretically correlated with the in vivo data, since the bioavailability can be determined by integrating the AUC of the absorption of a drug versus time (Brasil, 2003b; Brasil, 2010b; Anderson et al., 1998).
The aim of the present study was to develop reliable analytical methods to determination of atorvastatin and determine standard conditions for dissolution test and dissolution profile.
METHODS
Development, optimization, and validation of assay methods
Two methods of assay were used for comparison and definition of a more appropriate method for dosing in the dissolution test. These included:
) The determining of ATV by High Performance Liquid Chromatography coupled to the UV/DAD (HPLC/UV-DAD) detector. The chromatographic conditions used included: RP-18 column - octadecylsilane (250 x 4.6 mm, 5 mm), detection at 238 nm, mobile phase containing 0.1% phosphoric acid and acetonitrile (35:65% v/v), flow at 1.5 mL min-1, oven temperature at 30ºC, injection volume of 10 mL, and analysis time of approximately 10 minutes (Yoshida et al., 2011; USP, 2012). The samples were solubilized in methanol.
2) The determining of ATV by UV spectrophotometer and readings at 238 nm, with solubilization of samples in water.
The methods were optimized and validated according to Resolution n. 899/2003 and ICH Q2 (R1) guidelines, evaluating the following parameters: Precision in the range from 17.5 to 32.5 mg mL-1 in terms of repeatability and intermediate precision; Accuracy, intra-day and between-day, in the range from 17.5 to 32.5 mg mL-1; Linearity in the concentration range from 17.5 to 32.5 µg mL-1; Limit of Detection (LOD) estimated based on the ratio of 3 times the noise baseline and determined according to equation (3); and Limit of Quantification (LOQ), which was determined by equation (4) (Brasil, 2003a; INTERNATIONAL, 2005).

where: SDa is the standard deviation of the intercept with the Y axis of at least three calibration curves containing concentrations of the drug near the presumed limit; IC is the slope of the calibration curve.
The factors considered in determining of the Robustness in the HPLC method included: a change in the mobile phase composition, a variation in temperature, and a variation in the mobile phase flow.
To evaluate the Specificity, the stress conditions (intrinsic stability) of the ATV were investigated after 4 hours of exposure by using: heating under dry heat at 105ºC; reflux in a water bath in pure water, in 1 M NaOH, in 1 M HCl, and in 3% H2O2; as well as exposure to UV light at 254 nm (ICH, (R2), 2003; Silva et al., 2009).
Concerning the chromatographic performance, the parameters were calculated according to formulas proposed by the Brazilian Pharmacopoeia, attaining the retention factor (k'), the tailing factor (T), the number of theoretical plates (N), and resolution (Rs) between peaks (Brasil, 2010a).
Development of dissolution test to compare formulations
The dissolution test was developed according to national and international legislations (Brasil, 2010b). Tablets of the reference drug product and of the generic drug product were evaluated. The first tests were performed on the generic product and, according to the results, the best conditions to test the reference product was then selected.
The formulation of the drugs used at 80 mg/dose included:
a) Reference Product: calcium carbonate, microcrystalline cellulose, lactose monohydrate, croscarmellose sodium, polysorbate 80, hypromellose, magnesium stearate, dye opadry white®, and simethicone emulsion.
b) Generic Product: lactose monohydrate, trolamine, sodium starch glycolate, docusate sodium, sodium benzoate, sodium stearyl fumarate, hyprolose, titanium dioxide, macrogol, and polysorbate 80.
The content of drugs in the pharmaceutical products was performed using a validated HPLC analytical method with standard and samples diluted at a concentration of 20.0 mg mL-1 in methanol.
The conditions used to determine the dissolution test and the comparison of formulations are shown in Table I.
For each condition a dissolution profile with a sampling aliquot of 15 mL was performed at time periods of 5, 10, 15, 30, 45, and 60 minutes, with no replacement of the medium. These were then filtered through filter quality paper and subsequently diluted until reaching a theoretical final concentration of 32.0 mg mL-1. The absorbance of the solutions was measured by a spectrophotometer at 238 nm using the same solvent for the zero setting. The amount of C66H68CaF2N4O10 dissolved in the medium was calculated by comparing the readings of the sample solution with that of the standard solution at a concentration of 32.0 mg mL-1.
After obtaining the dissolution profiles and having plotted the graphs, the DE was also calculated. The results for the dissolution profile underwent an analysis of variance (ANOVA) to determine the differences in the mean values of two drugs (reference and generic products) at each time; p values of <0.05 were considered significant. Calculations were performed using an OriginPro8® program (ORIGINPRO, 2007).
RESULTS AND DISCUSSION
Validation of assay methods
For the evaluated assay methods, the results of the validation included:
1) The determining of ATV by High Performance Liquid Chromatography coupled to a UV/DAD (HPLC/UV-DAD) detector.
Intermediate precision and repeatability showed a relative standard deviation (RSD) of less than 4%.
Intra-day and between-day accuracy presented average recovery percentages of 99.95% and 100.11%, respectively.
Linearity was performed in the range from 17.5 to 32.5 µg mL-1; the linear correlation coefficient (r) showed the value of 0.9993, which meets the requirements pre-determined by RE 899/03 (greater than 0.99) (Brasil, 2003a).
LOD and LOQ were 1.34 µg mL-1 and 4.06 mg mL-1, respectively, and were evaluated on the third linear curves, as required.
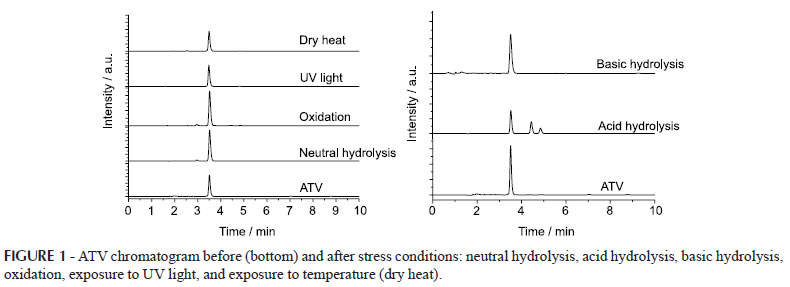
Specificity was evaluated after the drug had been subjected to conditions of stress, and the samples were then analyzed by HPLC. Figure 1 shows the chromatograms of the drug and samples after undergoing stress under acid and basic hydrolysis, exposure to dry heat, UV light exposure, neutral hydrolysis, and oxidation.
Considering the results, it could be observed that the drug showed a retention time (RT) of 3.517 minutes and that the drug presented degradation after undergoing stress caused by acidic and basic hydrolysis. It was also noted that the peak of the sample submitted to oxidation with an RT of 3.0 minutes represented the peak of hydrogen peroxide.
The sample treated by acid hydrolysis showed partial degradation with the formation of two degradation products, with RT = 4.440 and 4.853 minutes (Figure 1). The specificity proved to be adequate, with resolution (Rs) between the peaks satisfactory. The resolution between ATV and the first degradation product (DP1) was 5.89, and between DP1 and the second degradation product (DP2) was 2.39, indicating a good separation between the peaks. The degradation in a basic medium can be observed by reducing the area corresponding to the drug.
Regarding the peak purity, which is a requirement for specificity, the Waters equipment mark indicates that a pure peak must have a value of Purity Angle < Purity Threshold to be considered pure. The ATV peak, in the presence of degradation products and under acid hydrolysis, showed a Purity Angle of 0.127 and a Purity Threshold of 0.239. Figure 2 shows the spectra obtained by a UV/DAD detector at the beginning, on top, and at the end of the ATV peak for the sample when in the presence of degradation products, demonstrating the similarity among the spectra and confirming no coeluition.
The chromatographic performance was evaluated for the ATV peak, where the retention factor (k') was 1.49, the tailing factor (T) was 1.3, and the number of theoretical plates (N) was 8601 plates/column. All parameters were in accordance with a chromatographic method.
The robustness was evaluated against three variations in chromatographic conditions, using a flow of 1 mL min-1, a mobile phase ratio of 30:70, and the furnace turned off. The results proved to be satisfactory, with a difference of less than 1% of the content range in the analysis conditions.
2) Determination of ATV by spectrophotometry in the UV region and lectures at 238 nm of samples diluted in water.
Intermediate precision and repeatability showed an RSD of less than 4%.
Intra-day and between-day accuracy presented average recovery percentages of 99.85% and 100.42%, respectively.
Linearity was performed in the range 17.5 to 32.5 µg mL-1, and the linear correlation coefficient (r) showed the value of 0.9963, which meets the requirements pre-determined by RE 899/03 (greater than 0.99) (Brasil, 2003a).
LOD and LOQ were 3.01 µg mL-1 and 7.12 mg mL-1, respectively and were evaluated on the third linear curves, as required.
Specificity was evaluated after the drug had been subjected to conditions of stress. This method proved to be unsatisfactory, since the degradation products resulting from the stress caused by an acidic medium interfered with the reading.
Given the results obtained by UV spectrophotometry and the absence of specificity of this method, when the ATV is diluted in an acid medium, a degradation of the drug can be observed. This method is suitable only when the ATV is diluted in water, producing satisfactory results for precision, accuracy, linearity, LOD, LOQ, and specificity. Thus, UV spectrophotometry is a great alternative to being tested for dissolution in water, due to the advantages of cost and facility.
Development of dissolution test to compare formulations
According to RE 31/2010, to develop a dissolution test, the parameters to be set include: dissolution medium, pH, apparatus, rotation, use of anchors, use of surfactants, deaeration, and the choice of the dissolved amount (Q value). The suitable dissolution test should not be too little nor too great discriminatory, and it should be able to distinguish between good and bad formulations (Brasil, 2010b).
To perform evaluations and comparisons among pharmaceutical formulations, the analysis of the obtained ATV presented 99.82% of the labeled amount for reference product and 100.82% of the labeled amount for the generic product.
To choose the dissolution medium, the tests were not performed within the full range of physiological pH (1.2 to 6.8), as recommended in the legislation. ATV presented problems because of the degradation caused by the acidic medium, as could be observed in the intrinsic stability study. Therefore, the present study chose to use water, together with the possible addition of surfactants. The addition of surfactants is justified by their low solubility (class II second BCS product). These were evaluated to determine the discriminatory power of the method. The usual rotation method with paddles and baskets was set to between 50 and 100 rpm, and then they were evaluated.
Table II shows the results found in the dissolution profile of the generic product and the investigated dissolution conditions (medium, rotation, and apparatus).
It can be observed in Table II that the addition of surfactants was not necessary, since the product showed a release (solubility) that was only suitable with water. The rotation speed of 75 rpm showed an adequate release with low RSD which presented a satisfactory second RE 31/2010 resolution. The use of anchors was unnecessary because the pharmaceutical formulation did not fluctuate (Brasil, 2010b).
To complete the study of choice for dissolution conditions, the reference drug product was evaluated using the optimal condition observed for the generic product, in which water was used as the dissolution medium and the rotation speed was 75 rpm (Condition III). However, according to the results, dissolution of greater than 90% could be observed within 5 minutes. Next, the test was performed at 50 rpm (Condition II), which also showed a rapid dissolution of the drug of up to 90% in 10 minutes. In both cases, the RSD was adequate, below the limit, and lower than that of the generic product, which shows the homogeneity and quality of the reference product. The basket method was also evaluated for the reference product. However, as the tablet weight is quite high, with large amounts of excipients, it commits the use of the basket, given that there was obstruction of the mesh, which can be confirmed through the results from the high value of RSD among samples at the same times. The use of anchors in conditions with paddle apparatus proved to be unnecessary because the formulation did not fluctuate.
Table III presents the results for the dissolution profile of the reference product and the conditions of the evaluated dissolution tests (medium, rotation, and apparatus).
To compare the F2 and the DE in percentage, the calculations were performed for conditions II and III, which showed the best results, since both RSD were lower than recommended.
The DE percentage was calculated for all samples, using the AUC as described in Figure 3 and considering that the dissolution of the area equivalent to 100% in 60 minutes was 6000, as follows:
a) Reference Product, condition II = 92.41%
b) Generic Product, condition II = 48.62%
c) Reference Product, condition III = 95.08%
d) Generic Product, condition III = 84.66%
Statistical calculations were analyzed by ANOVA, with p<0.05, which were done for each sampling time between the two tested formulations. The critical F and the calculated F were compared in an attempt to determine the similarity between the points of the dissolution curve between the two formulations. Table IV shows the calculated F for each point. It can be seen that only at times of 30, 45, and 60 minutes, under condition III, did the results show no statistically significant differences. Statistically significant differences could be observed when the calculated F was higher than the critical F of 4.30, considering a 5% significance.
It could be observed that in condition II (50 rpm) all results for reference and generic products presented statistically significant differences. In condition III (75 rpm), a similarity in the results could be observed beginning at 30 minutes, when the drug dissolution was 100% in both samples. However, in the ascending portion of the dissolution curve, which represents the initial point of dissolution, the results show a statistically significant difference. The calculation of the F2 value is only important in the initial portion of the dissolution curve, which shows the dissolution kinetics. When the curve reaches the plateau (maximum release of the drug), no variation between the points can be identified, thus showing no significant difference in the results in this range of rotation speed.
The formulation of both generic and reference products presents a combination of super-disintegrants and surfactants, which is consistent with the high solubility of the drugs in a few minutes, even in the Class II drugs. As the dissolution average was greater than 85% in 15 minutes, the impact on the reference product may be considered very rapid dissolution. As such, the evaluation of F2 loses its discriminative power and even becomes unsuitable for comparisons in pharmaceutical formulations.
In the F2 calculation, the legislation adopts the following criteria to select the sampling points: at least five sampling collections, only one of which may be at a point after both drugs reach 85% of dissolution. The determination of these points gives value to the ascending portion of the dissolution profile curve, thus making it possible to evaluate the pharmaceutical formulations with more distinct criteria (Brasil, 2010b).
When developing a new product containing ATV as an active ingredient, to compare it with the reference drug product, the ideal conditions to be used in the dissolution test would include condition II, using water as a dissolution medium and a paddle apparatus at a rotation speed of 50 rpm, so as to be more discriminative in relation to the condition III, which uses the same dissolution medium, but with the paddle apparatus rotation speed set at 75 rpm. Thus, the tolerance (Q) in the dissolution test can be defined as 80% (Q) at 15 minutes, which is the defining characteristic of a drug's very rapid dissolution.
Although the generic product could be identified, in the test proposed in condition II (50 rpm), this product would not be considered pharmaceutically equivalent. However, as the manner in which the test was conducted by the manufacturing laboratory is unknown, since there is no pharmacopoeial monograph, the manufacturer may legally have chosen a less discriminatory condition to gain approval as a generic product. In addition, Bioequivalence results prevail over Equivalence results, and, despite a more rigorous control of the experiments using dissolution profiles, companies have used the supposed legality of these Bioequivalence results to formally register drugs.
CONCLUSIONS
The analytical method proposed in this study was able to generate reliable results, given that all parameters were satisfactory, allowing for the validation of methodologies.
The HPLC method was validated to determine the ATV content, which employs a reverse C18 column phase (250 x 4.6 mm 5 mm), a mobile phase containing 0.1% of phosphoric acid, and acetonitrile (35:65% v/v) with a flow of 1.5 mL.min-1 and detection at 238 nm. The HPLC method presented all the validation parameters according to requirements, in addition to the performance parameters, producing a chromatographic retention factor (k') of 1.49, a tailing factor (T) of 1.3, and a number of theoretical plates (N) of 8,601 plates/column.
The validated method proposed by UV spectrophotometry, with dilution in water at 238 nm, should only be used for analysis in the dissolution test, as it presented limitations in specificity when there was an alteration in pH levels.
Since no official method currently exists to evaluate the dissolution test, a condition pattern was proposed for the evaluation of pharmaceutical formulations, used under the following conditions: water as a dissolution medium, 1000 mL as a volume, paddle apparatus at a rotation speed of 50 rpm, 80% (Q) in 15 minutes with UV spectrophotometer readings at 238 nm, using the standard concentration of 32.0 mg/mL under the same solvent.
Tablet formulations of ATV can be considered to be very rapid dissolutions, and therefore do not require the calculation of F2. In the condition proposed as the ideal method of dissolution, the generic product was not considered pharmaceutically equivalent. However, upon applying other less discriminative methods, but which also fall within legal parameters, these same generic products can be considered to be pharmaceutical equivalents.
ACKNOWLEDGEMENTS
We wish to thank FAPES and CNPq for their financial support.
DECLARATION OF INTEREST
Financial support for this research was provided by FAPES and CNPq.
Received for publication on 09th May 2012
Accepted for publication on 25th October 2012
- AMIDON, G.L.; KASIM, N.A.; WHITEHOUSE, M.; RAMACHANDRAN, C.; BERMEJO, M.; LENNERNAS, H.; HUSSAIN, A.S.; JUNGINGER, H.E.; STAVCHANSKY, S.A.; MIDHA, K.K.; SHAH, V.P. Molecular properties of WHO essential drugs and provisional biopharmaceutical classification. Mol. Pharm., v.1, n.1, p.85-96, 2004.
- ANDERSON, N.H.; BAUER, M.; BOUSSAC, N.; KHAN-MALEK, R.; MUNDEN, P.; SARDARO, M. An evaluation of fit factors and dissolution efficiency for the comparison of in vitro dissolution profiles. J. Pharm. Biomed. Anal., v.17, n.4-5, p.811-822, 1998.
- BENET, L.Z. Can the BCS be modified to expand the inclusion of drugs in class 1 based on transporter-enzyme interplay In: AAPS ANNUAL MEETING, 2006, San Antonio, 2006. San Antonio: University of California, 2006. 15 p.
- BLENKINSOPP, J. The statin wars. The Lancet, v.362, n.9393, p.1341-1426, 2003.
- BRASIL. Resolução RDC n. 31, de 11 de agosto de 2010. Agência Nacional de Vigilância Sanitária. Dispõe sobre a realização dos Estudos de Equivalência Farmacêutica e de Perfil de Dissolução Comparativo. Diário Oficial da União, Brasília, 12 ago. 2010b. 14 p.
- BRASIL. Resolução RDC nº 49, de 23 de novembro de 2010. Agência Nacional de Vigilância Sanitária. Aprova a 5 ª edição da Farmacopéia Brasileira. Diário Oficial da União, Brasília, 24 nov. 2010a. DOU nº 224, 1331 p.
- BRASIL. Resolução RE n. 1, de 29 de julho de 2005. Agência Nacional de Vigilância Sanitária. Publicação do Guia para a Realização de Estudos de Estabilidade. Diário Oficial da União, Brasília, 01 ago. 2005. 6 p.
- BRASIL. Resolução RE n. 901, 29 de maio de 2003. Agência Nacional de Vigilância Sanitária. Guia para ensaios de dissolução para formas farmacêuticas sólidas orais de liberação imediata (FFSOLI). Diário Oficial da União, Brasília, 02 jun. 2003b. 7 p.
- BRASIL. Resolução RE n. 899, de 29 de maio de 2003. Agência Nacional de Vigilância Sanitária. Determina a publicação do Guia para validação de métodos analíticos e bioanalíticos. Diário Oficial da União, Brasília, 02 jun. 2003a. Available at: <http://www.anvisa.gov.br/legis/resol/2003/re/899_03re.htm>. Acessed on: 08 may 2012.
- CÁRCAMO, E.C. Cinetica de disolución de medicamentos. Secretaria General de la Organización de los Estados Americanos. Washington: OEA, 1981. p.102.
- CASTRO, W.V.; OLIVEIRA, M.O.; NUNAN, A.E.; MOREIRA, L.M. Avaliação da qualidade e perfil de dissolução de comprimidos gastro-resistentes de diclofenaco sódico 50mg comercializados no Brasil. Rev. Bras. Ciênc. Farm., v.86, n.1, p.45-50, 2005.
- FOOD AND DRUG ADMINISTRATION. FDA. Center for Drug Evaluation and Research. Reviewer Guidance. Validation of chromatographic methods Rockville, 1994. 33 p.
- FOOD AND DRUG ADMINISTRATION. FDA. Guidance for industry: dissolution testing of immediate release solid oral dosage forms Rockville, 1997. 17 p.
- GOMES, F.P. Validação de métodos para análise de estatinas em medicamentos. São Paulo: EDUSP, 2008. 206 p.
- INTERNATIONAL CONFERENCE ON HARMONIZATION. Technical requirements for the registration of drugs for human use. Stability testing of new drug substances and products Q1A(R2). Switzerland, 2003. 16 p.
- INTERNATIONAL CONFERENCE ON HARMONIZATION. ICH. Technical requirements for the registration of drugs for human use. Validation of analytical procedures: text and methodology Q2(R1) Switzerland, 2005. 17 p.
- MOFFAT, A.C.; OSSELTON, M.D.; WIDDOP, B. Clarke's analysis of drugs and poisons: in pharmaceuticals, body fluids and postmortem material 3.ed. London: Pharmaceutical Press, 2004. v.2.
- NEUMAM, C. Dois dos 20 remédios mais vendidos no Brasil têm patente ameaçada R7 Notícias, Rio de Janeiro, Abr. 2010. Available at: <http://noticias.r7.com/saude/noticias/dois-dos-20-remedios-mais-endidosnobrasiltem-patente-ameacada-20100412.html>. Acessed on: 23 jul. 2010.
- OLIVEIRA, M.A.; YOSHIDA, M.I.; GOMES, E.C.L.; MUSSEL, W.N.; SOARES, C.D.V.; PIANETTI, G.A. Análise térmica aplicada a fármacos e formulações farmacêuticas na indústria farmacêutica. Quím. Nova, v.34, n.7, p.1224-1230, 2011.
- OriginPro® 8 SR0 Software, Copyright© 1991-2007, OriginLab Corporation.
- PILLAY, V.; FASSIHI, R. Evaluation and comparison of dissolution data derived from different modified release dosage forms: an alternative method. J. Control. Release, v.55, n.13-14, p.45-55, 1998.
- REIS, A.M.M. Estudo da disponibilidade in vitro de carbonato de cálcio comprimidos Belo Horizonte: Ed. UFMG, 1998. 220 p.
- RIBANI, M.; BOTTOLI, C.B.G.; COLLINS, C.H; JARDIM, I.C.S.F.; MELO, L.F.C. Validação em métodos cromatográficos e eletroforéticos. Quím. Nova, v.27, n.5, p.771-780, 2004.
- SHETE, G.; PURI, V.; KUMAR, L.; BANSAL, A.K. Solid state characterization of commercial crystalline and amorphous atorvastatin calcium samples. AAPS, v.11, n.2, p.598-609, 2010. Available at: <http://www.springerlink.com/content/gk8021q46rl4p700/fulltext.pdf>. Accessed on: 10 oct. 2011.
- SILVA, K.E.R.; ALVES, L.D.S.; SOARES, M.F.R.; PASSOS, R.C.S.; FARIA, A.R.; ROLIM NETO, P.J. Modelos de avaliação da estabilidade de fármacos e medicamentos para a indústria farmacêutica. J. Basic Appl. Pharm. Sci., v.30, n.2, p.1-8, 2009.
- SNYDER, L.R.; KIRKLAND, J.J.; GLAJCH, J.L. Pratical HPLC method development. 2.ed. New York: John Wiley & Sons, 1997. p.189-192.
- SWARTZ, M.E.; KRULL, I.S. Validação de métodos cromatográficos. Pharm. Techol., v.2, n.3, p.12-20, 1998.
- UNITED STATES PHARMACOPOEIA. 35.ed. Rockville: United States Pharmacopeial Convention, 2012. 4200 p.
- YOSHIDA, M.I.; OLIVEIRA, M.A., GOMES, E.C.L.; MUSSEL, W.N.; CASTRO, W.V.; SOARES, C.D.V. Thermal characterization of lovastatin in pharmaceutical Formulations. J. Therm. Anal. Calorim., v.106, n.3, p.657-664, 2011.
Publication Dates
-
Publication in this collection
15 Feb 2013 -
Date of issue
Dec 2012
History
-
Received
09 May 2012 -
Accepted
25 Oct 2012