ABSTRACT
The physicochemical attributes of emulsified systems are influenced by the characteristics of their internal phase droplets (concentration, size and morphology), which can be modified not only by the formulation components, but also by the analytical methodology employed. Thus, the aim of this work involved the physicochemical characterization of cosmetic emulsions obtained from different surfactants, as well as the introduction of the optical coherence tomography (OCT) as the analytical technique employed for the morphological characterization and particle size determination of the formulations. Three emulsions were prepared, differing at the type and concentration of the surfactant used, and their droplet sizes were evaluated through optical microscopy, laser diffraction and OCT. The microscopic analysis and the laser diffraction techniques provided an average particle size minor than 6.0 µm, not detected by the OCT technique, which could identify only bigger particles of the emulsified systems' internal phase. The results testify that OCT was suitable for the morphological characterization of cosmetic emulsions; however, the technique needs to be improved to ensure a better sensitivity in the analysis of smaller particles.
Uniterms:
Cosmetic emulsions/physicochemical characterization; Surfactants; Optical coherence tomography/morphological characterization; Optical microscopy/morphological characterization; Laser diffraction/morphological characterization
RESUMO
Os atributos físico-químicos de sistemas emulsionados são influenciados pelas características de suas gotículas de fase interna (concentração, tamanho e morfologia), as quais podem ser modificadas não apenas pelos componentes da formulação, mas também pela metodologia analítica empregada. Desta forma, o objetivo deste trabalho envolveu a caracterização físico-química de emulsões cosméticas obtidas a partir de diferentes tensoativos, bem como a introdução da tomografia de coerência óptica (OCT) como a técnica analítica utilizada para a caracterização morfológica e determinação do tamanho de partícula das formulações. Três emulsões foram preparadas, diferindo no tipo e concentração do tensoativo empregado, e seus tamanhos de gotícula foram avaliados por meio das técnicas de microscopia óptica, difração a laser e OCT. As técnicas de microscopia óptica e difração a laser forneceram tamanhos de partícula médios menores de 6.0 µm, não detectados pela técnica de OCT, que permitiu apenas a identificação de partículas maiores pertencentes à fase interna dos sistemas emulsionados. Os resultados reforçam a introdução da OCT como metodologia promissora para a caracterização morfológica de emulsões cosméticas; no entanto, a técnica requer aprimoramento para garantir maior sensibilidade na análise de partículas de menor tamanho.
Unitermos:
Emulsões cosméticas/caracterização físico-química; Tensoativos; Tomografia de coerência óptica/caracterização morfológica; Microscopia óptica/ caracterização morfológica; Difração a laser/ caracterização morfológica
INTRODUCTION
The investigation on how physical and chemical parameters influence the morphological micro-organization of emulsion systems is mandatory, once emulsions are a vehicle broadly used in drugs and cosmetics development (McClements, 2007McCLEMENTS, D.J. Critical review of techniques and methodologies for characterization of emulsion stability. Crit. Rev. Food Sci., v.47, n.7, p.611-649, 2007.).
These systems attributes, especially the particles size and morphology, are influenced by the composition of each formulation. Therefore, suitable analytical procedures are required to assess these characteristics - being microscopy and laser diffraction techniques the most broadly applied (Salager, 2000SALAGER, J.L. Formulation concepts for the emulsion maker. In: NIELLOUD, F.; MARTI-MESTRES, G., eds. Pharmaceutical emulsions and suspensions. New York: Marcel Dekker, 2000. p.20-68. (Drugs and the pharmaceutical sciences, v.105).; Aulton, 2005AULTON, M.E. Delineamento de formas farmacêuticas. 2.ed. Porto Alegre: Artmed, 2005. 677p.).
In this context, to contribute with the science and technical improvement, it was suggested the use (advent) of an innovative methodology, the Optical Coherence Tomography (OCT), aiming the characterization of emulsified systems.
The OCT is a non-invasive and non-destructive technique for image diagnosis that generates transversal images with a high (especial) resolution. The technique is capable of obtain microscopic images exploring the short temporal coherence of the sources with large spectral bandwidths, overcoming the confocal optical microscopes and being capable to reach depths of up to 2.0 cm in transparent samples (Freitas et al., 2006FREITAS, A.Z.; ZEZELL, D.M.; VIEIRA Jr., N.D.; RIBEIRO, A.C.; GOMES A.S.L. Imaging carious human dental tissue with optical coherence tomography. J. Appl. Phys., v.99, n.2, p.24906/1-24906/6, 2006.; Pinto, Waksman, 2006PINTO, T.L.; WAKSMAN, R. Clinical applications of optical coherence tomography. J. Interv. Cardiol., v.19, n.6, p.566-573, 2006.; Podoleanu, 2012PODOLEANU, A.G. Optical Coherence Tomography. J. Microsc., v.247, n.3, p.209-219, 2012.).
In the nineties, Huang and coworkers (1991HUANG, D.; SWANSON, E.A.; LIN, C.P.; SCHUMAN, J.S.; STINSON, W.G.; CHANG, W.; HEE, M.R.; FLOTTE, T.; GREGORY, K.; PULIAFITO, C.A.; FUJIMOTO, J.G. Optical coherence tomography. Science, v.254, n.5035, p.1178-118, 1991.) applied the OCT principles in biological tissues images, which disseminated the use of this technique to other areas, such as ophthalmology (Meirelles et al., 2005MEIRELLES, R.L.; AGGIO, F.B.; COSTA, R.A.; FARAH, M.E. STRATUS optical coherence tomography in unilateral colobomatous excavation of the optic disc and secondary retinoschisis. Graefe Arch. Clin. Exp., v.243, n.1, p.76-81, 2005.; Shoughy et al., 2015SHOUGHY, S.S.; JAROUDI, M.O.; KOZAK, I.; TABBARA, K.F. Optical Coherence Tomography in the diagnosis of sclerits and episclerits. Am. J. Ophthalmol., v.159, n.6, p.1045-1049, 2015.), dermatology (Freitas et al., 2010FREITAS, A.Z.; AMARAL, M.M.; RAELE, M.P. Optical coherence tomography: development and applications. In: DUARTE, F.J.(Ed.) Laser pulse phenomena and applications. Rijeka: InTech, 2010. cap.20, p.409-432.), cardiology (Bernelli, Sirbu, Guagliumi, 2015BERNELLI, C.; SIRBU, V.; GUAGLIUMI, G. Percutaneous coronary intervention planning and optimization with Optical Coherence Tomography. Interv. Cardiol. Clin., v.4, n.3, p.251-284, 2015.), odontology (Melo et al., 2005MELO, L.S.A.; ARAUJO, R.E.; FREITAS, A.Z.; ZEZELL, D.M.; VIEIRA, N.D; GIRKIN, J.; HALL, A.; CARVALHO, M.T.; GOMES, A.S.L. Evaluation of enamel dental restoration interface by optical coherence tomography. J. Biomed. Opt., v.10, n.6, p.1-5, 2005.; Freitas et al., 2006FREITAS, A.Z.; ZEZELL, D.M.; VIEIRA Jr., N.D.; RIBEIRO, A.C.; GOMES A.S.L. Imaging carious human dental tissue with optical coherence tomography. J. Appl. Phys., v.99, n.2, p.24906/1-24906/6, 2006.), and industrial area.
Furthermore, OTC is already employed in the cosmetic field: its use covers the evaluation of hair fibers and the skin assessment in order to measure the effectiveness of anti-aging products; however, the technique has never been used to characterize cosmetic emulsions, or to determine the droplet size of its inner phase (Velasco et al., 2009VELASCO, M.V.R.; BABY, A.R.; SARRUF, F.D.; KANEKO, T.M.; SAMAD, R.E.; VIEIRA JÚNIOR, N.D.; FREITAS, A.Z. Prospective ultramorphological characterization of human hair by optical coherence tomography. Skin Res. Technol., v.15, n.4, p.440-443, 2009.; Freitas, Amaral, Raele, 2010FREITAS, A.Z.; AMARAL, M.M.; RAELE, M.P. Optical coherence tomography: development and applications. In: DUARTE, F.J.(Ed.) Laser pulse phenomena and applications. Rijeka: InTech, 2010. cap.20, p.409-432.).
Here, we developed and morphologically evaluated emulsified systems containing the non-ionic surfactants steareth-21 and oleth-20, in different proportions. Additionally, the study aims the introduction of the Optical Coherence Tomography (OTC) as an analytical tool to determine the particle size and morphological characterization of emulsified systems.
MATERIAL AND METHODS
Emulsified systems development
Three emulsified systems were prepared, with different proportions of the following non-ionic surfactants: steareth-21 and oleth-20 (Table I). These surfactants are not electric charged, and, thus, are less irritant and allow the incorporation of a great variety of active compounds to the formulations (Balcan et al., 2002BALCAN, M.; ANGHEL, D.F.; VOICU, A.; BALCAN, D.C. Determination of thermodynamic parameters of ethoxylated nonionic surfactants by means of reversed-phase high-performance liquid chromatography. Coll. Surf. A, v.204, n.1-3, p.141-151, 2002.; Liu, Pohl, 2008LIU, X.; POHL, C. New hydrophilic interaction/reversed-phase mixed-mode stationary phase and its application for analysis of nonionic ethoxylated surfactants. J. Chromatogr. A, v.1191, n.1/2, p.83-89, 2008.; He et al., 2014HE, Z.; ZHANG, M.; FANG, Y.; JIN, G.; CHEN, J. Extended surfactants: a well-designed spacer to improve interfacial performance through a gradual polarity transition. Coll. Surf. A , v.450, p.83-92, 2014.).
Microscopic analysis
The formulations were transferred to a glass slide covered by a cover slip, and evaluated at an optical microscope coupled with a software for image analysis (Image Pro Plus(r)). Three regions of the slide were evaluated randomly to verify the samples homogeneity. The experiment were conducted at room temperature (25.0 ± 2.0 °C), with further counting of the inner phase droplets performed by the equipment software Image(r) Pro Plus (Masson et al., 2005MASSON, D.S.; MORAIS, G.G.; MORAIS, J.M.; ANDRADE, F.F.; SANTOS, O.D.H.; OLIVEIRA, W.P.; ROCHA FILHO, P.A. Polyhydroxy alcohols and peach oil addition influence on liquid crystal formation and rheological behaviour of O/W emulsions. J. Disper. Sci. Technol, v.26, n.4, p.463-468, 2005.; Santos et al., 2005SANTOS, O.D.H.; MIOTTO, J.V.; MORAIS, J.M.; OLIVEIRA, W.P.; ROCHA-FILHO, P.A. Attainment of emulsions with liquid crystal from marigold oil using the required HLB method. J. Disper. Sci. Technol , v.26, n.2, p.243-249, 2005.).
Laser diffraction
The particle size determination was assessed by laser diffraction (LS(r) 230, Beckman Coulter, with optical model of Fraunhofer PIDS). Samples were dispersed in purified water and homogenized in an ultrasound bath for 460 seconds, to guarantee the particles disaggregation; then, samples were slowly added to a suitable compartment of the equipment, containing purified water, in order to obtain an acceptable level of obscuration (up to 8%), specified by the equipment software (Baby et al., 2008BABY, A.R.; SANTORO, D.M.; VELASCO, M.V.R.; SERRA, C.H.R. Emulsified systems based on glyceryl monostearate and potassium cetyl phosphate: scale-up and characterization of physical properties. Int. J. Pharm, v.361, n.1/2, p.99-103, 2008b.).
Results were expressed as the particles diameters dispersed in a certain volume. Therefore, the expression D (v 0.5) means that 50% of the particles, in a certain volume (v), have a lower diameter (D) than the calculated value. The same criteria apply for D (v 0.1) and D (v 0.9), representing 10% and 90% of the particles, respectively. The expression D [4,3] represents the particles medium diameter in the respective volume (Hecq et al., 2006HECQ, J.; DELEERS, M.; FANARA, D.; VRANCKX, H.; BOULANGER, P.; LE LAMER, S.; AMIGHI, K. Preparation and in vitro/in vivo evaluation of nano-sized crystals for dissolution rate enhancement of ucb-35440-3, a highly dosed poorly water-soluble weak base. Eur. J. Pharm. Biopharm.v.64, n.3, p.360-368, 2006. ).
Optical coherence tomography
The emulsified systems morphological characterization was performed by Optical Coherence Tomography (OCP930SR(r), Thorlabs, Newton, NJ, USA).
The equipment specifications were the following: center wavelength of 930 ± 5 nm; spectral width (FWHM - full width at half maximum) of 100 ± 5 nm; and maximum imaging width and depth of 6.2 mm and 1.6 mm, respectively. The optical power was 2.0 mW, with imaging speed of four frames per second (2000 × 512 pixels).
The samples were dispersed in purified water, in ratios of 1:1, 1:10, 1:50, 1:100 and 1:1000, and disposed them in a glass apparatus were longitudinal laser scans were performed, in order to evaluate the droplets physical aspect.
Statistical analysis
Results were carried in triplicate and data were treated considering a confidence interval of 95% (p < 0.05). The statistical package used was Statistica(r) 7.0 (Stat softTM, Tulsa, Oklahoma, USA).
RESULTS AND DISCUSSION
Microscopic analysis
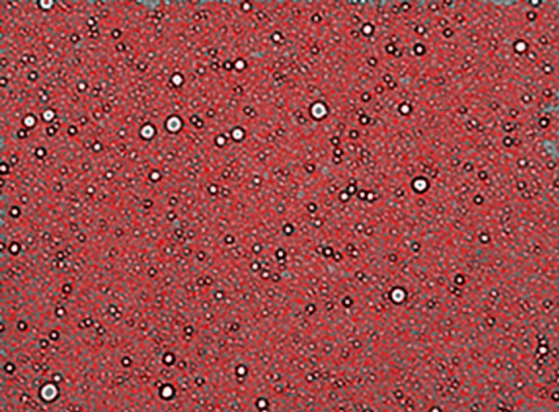
The red portions, observed at Figure 1, represent 6542 droplets. The results obtained through optical microscopy are presented in Table II.

Statistical analysis of average and maximum values of particle sizes, obtained for the emulsified systems ES-1, ES-2 and ES-3, showed no significant differences among the samples (p > 0.05). In most of the cases, systems showed droplet sizes close to 1 µm, but larger droplets could also be observed and they were represented by the maximum particle size values. This phenomenon characterizes these emulsions as polydisperse systems, once they did not present a single droplet size.
Laser diffraction
The particle size results obtained by laser diffraction are presented in Table III. Considering the variables analyzed, the mean values, despite having different droplet sizes, they did not show significant statistical differences. Thus, it was concluded that the surfactants used did not influence the distribution parameter of the particles in the emulsified systems.
Optical coherence tomography
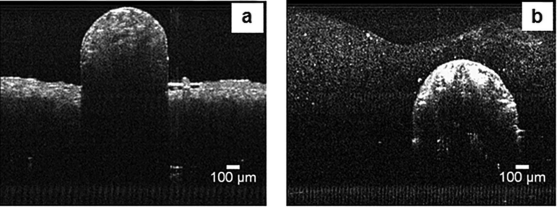
Microspheres, immobilized in a carbomer gel (1.0% w/w), were used as reference to verify the equipment calibration (Figure 2). The results confirmed the calibration status of the equipment, once the spheres diameter were 651.48 µm (a) and 724.84 µm (b), within their recommended diameter range: 425.00 to 850.00 µm.

Microspheres and carbomer gel 1.0% (w/w), (a) sphere above the carbomer gel and (b) sphere within the carbomer gel.
Aiming to determine the optimum parameters for droplet size analysis, preliminary tests were performed. Figure 3 shows the tomographic image of ES-1 without dispersion in purified water. From this image, we observed the need of performing the dispersion procedure, since it was not possible to detect appropriate droplet size of the system internal phase.

Further, in a further test, it was required to minimize the time between the sample dispersion and the droplet size analysis, once the time has led to the droplets accumulation on the surface of the sample - and not in the central region - preventing the correct reading.
After preliminary tests, further studies were conducted with samples dispersed in purified water. Figures 4, 5 and 6 represent tomographic images of the ES-1, ES-2 and ES-3, in the 1:10, 1:50 and 1:100 dispersion ratios, respectively.

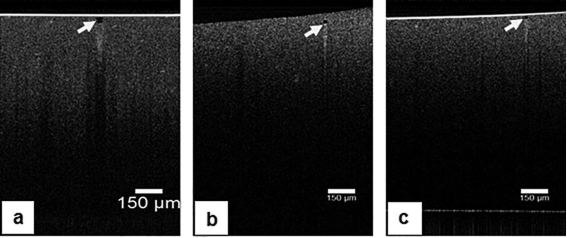
Tomographic images of the emulsified systems (1:10 dispersion in purified water); where (a) ES-1, (b) ES-2 and (c) ES-3. The arrows indicate possible droplets of the emulsion's inner phase.
In OCT analysis, interfaces generally present high light scattering, represented by bright regions in the tomographic images. On the other hand, the internal phase particles of the emulsion are constituted by the oily phase of the system, which does not have the property of spreading light, appearing as dark regions in the images (Schimitt, 1999SCHIMITT, J.M. Optical Coherence Tomography: a review. IEEE J. Sel. Top. Quant, v.5, n.4, p.1205-1215, 1999.; Podoleanu, 2012PODOLEANU, A.G. Optical Coherence Tomography. J. Microsc., v.247, n.3, p.209-219, 2012.). In all tomographic images, it was possible to observe bright and dark regions, due to the intensity of the generated signal. Although there were no differences between the 1:50 (Figure 5) and 1:100 dispersions (Figure 6), the presence of bright regions was pronounced in the 1:10 dispersion (Figure 4), representing particles with high scattering properties. This occurs because this dispersion is the most concentrated, and, therefore, may present agglomerated particles.

Tomographic images of the emulsified systems (1:50 dispersion in purified water); where (a) ES-1, (b) ES-2 and (c) ES-3. The arrows indicate possible droplets of the emulsion's inner phase.

Tomographic images of the emulsified systems (1:100 dispersion in purified water); where (a) ES-1, (b) ES-2 and (c) ES-3. The arrows indicate possible droplets of the emulsion's inner phase.
Another important factor to be considered for the images analysis is the OCT equipment detection limit, which could only measure particles with sizes greater than 6.0 µm (Velasco et al., 2009VELASCO, M.V.R.; BABY, A.R.; SARRUF, F.D.; KANEKO, T.M.; SAMAD, R.E.; VIEIRA JÚNIOR, N.D.; FREITAS, A.Z. Prospective ultramorphological characterization of human hair by optical coherence tomography. Skin Res. Technol., v.15, n.4, p.440-443, 2009.). According to the tests performed by laser diffraction and optical microscopy, the average particle size of the emulsified systems was lower than 6.0 µm and, therefore, below the OTC equipment detection limit.
Considering the above, it is suggested that the dark regions observed on the tomography images (Figures 4, 5 and 6) represent the internal phase droplets of the emulsified systems, while the bright regions represent the interface between different emulsion droplets, which are close to each other and have particles below 6.0 µm microns - not possible to be detected by the equipment. The particle size of the emulsified systems droplets, indicated by the arrows in Figures 4, 5 and 6, is shown in Table IV.
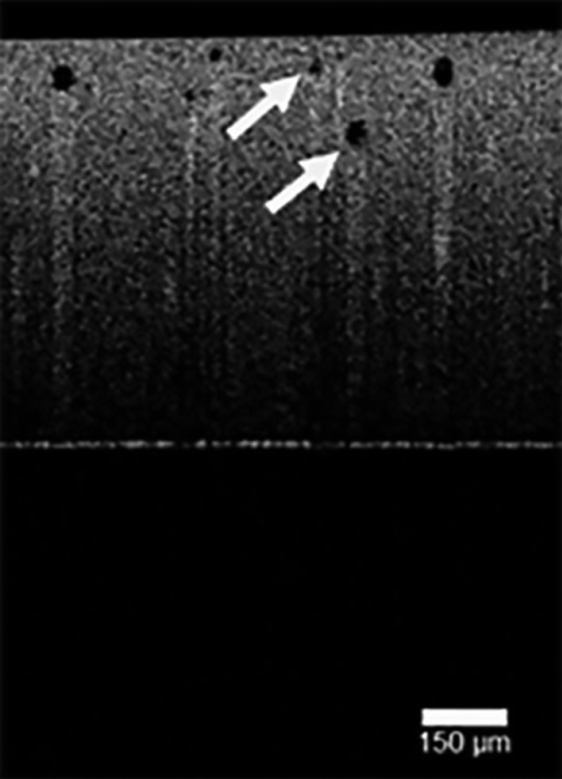
These results corroborate the data obtained by optical microscopy for the maximum particle sizes of the emulsified systems (Table II). Analyzing other images obtained for ES-3 (Figure 7), it was possible to observe dark regions of different sizes, ranging from 17.63 to 33.67 µm.

Tomographic image of the emulsified system ES-3 (1:10 dispersion in purified water). The arrows indicate droplets of different sizes in the emulsion's inner phase.
It is also important to emphasize that, although the results are consistent with those found by other techniques employed in this research, further studies are still suggested to certainly identify the dark regions as the internal phase droplets.
Particle size results - techniques comparison
Comparative particle size results for the optical microscopy and laser diffraction methodologies are described in TABLE V. From the statistical analysis, it was found that the methodologies could not be compared, once they presented statistically different results for the same sample.
This data is corroborated by the literature, which reports that microscopic analysis cannot be compared to laser diffraction technique (optical microscopy examines the diameter of the droplets and, laser diffraction, the volume distribution) (Brewer, Ramsland, 1995BREWER, E.; RAMSLAND, A. Particle size determination by automated microscopical imaging analysis with comparison to laser diffraction. J. Pharm. Sci., v.84, n.4, p.499-501, 1995.).
CONCLUSIONS
The OCT technique allowed the visualization and morphological characterization of particles within the emulsions, suggested to be the internal phase droplets. Optical microscopy and laser diffraction techniques provided average particle sizes lower than 6.0 µm, which could not be measured by OTC due to methodology limitations.
Through microscopic analysis, it was possible to observe particles with sizes greater than 6.0 µm - data also reported by OCT, in which the dark regions probably represented the emulsion's internal phase droplets.
These findings reinforce the introduction of the OCT as methodology for the analysis of cosmetic emulsified systems, which stability and sensory characteristics are greatly influenced by emulsions' particle size and morphology. Although further studies are required in order to improve the equipment sensitivity, it was possible to assess the OTC technique contribution in the cosmetic field, with possibility to expand its application to other areas, such as the morphological study of hair and skin.
ACKNOWLEDGMENTS
The authors would like to thank The São Paulo Research Foundation (FAPESP) - 2009/12502-5 and 2008/57735-4 - and the National Counsel of Technological and Scientific Development (CNPq), for the financial support. Also, authors are greatly thankful to Dra Catarina Rosado for her high quality technical support
REFERENCES
- AULTON, M.E. Delineamento de formas farmacêuticas. 2.ed. Porto Alegre: Artmed, 2005. 677p.
- BABY, A.R.; SANTORO, D.M.; VELASCO, M.V.R.; SERRA, C.H.R. Emulsified systems based on glyceryl monostearate and potassium cetyl phosphate: scale-up and characterization of physical properties. Int. J. Pharm, v.361, n.1/2, p.99-103, 2008b.
- BALCAN, M.; ANGHEL, D.F.; VOICU, A.; BALCAN, D.C. Determination of thermodynamic parameters of ethoxylated nonionic surfactants by means of reversed-phase high-performance liquid chromatography. Coll. Surf. A, v.204, n.1-3, p.141-151, 2002.
- BERNELLI, C.; SIRBU, V.; GUAGLIUMI, G. Percutaneous coronary intervention planning and optimization with Optical Coherence Tomography. Interv. Cardiol. Clin., v.4, n.3, p.251-284, 2015.
- BREWER, E.; RAMSLAND, A. Particle size determination by automated microscopical imaging analysis with comparison to laser diffraction. J. Pharm. Sci., v.84, n.4, p.499-501, 1995.
- FREITAS, A.Z.; ZEZELL, D.M.; VIEIRA Jr., N.D.; RIBEIRO, A.C.; GOMES A.S.L. Imaging carious human dental tissue with optical coherence tomography. J. Appl. Phys., v.99, n.2, p.24906/1-24906/6, 2006.
- FREITAS, A.Z.; AMARAL, M.M.; RAELE, M.P. Optical coherence tomography: development and applications. In: DUARTE, F.J.(Ed.) Laser pulse phenomena and applications. Rijeka: InTech, 2010. cap.20, p.409-432.
- HE, Z.; ZHANG, M.; FANG, Y.; JIN, G.; CHEN, J. Extended surfactants: a well-designed spacer to improve interfacial performance through a gradual polarity transition. Coll. Surf. A , v.450, p.83-92, 2014.
- HECQ, J.; DELEERS, M.; FANARA, D.; VRANCKX, H.; BOULANGER, P.; LE LAMER, S.; AMIGHI, K. Preparation and in vitro/in vivo evaluation of nano-sized crystals for dissolution rate enhancement of ucb-35440-3, a highly dosed poorly water-soluble weak base. Eur. J. Pharm. Biopharm.v.64, n.3, p.360-368, 2006.
- HUANG, D.; SWANSON, E.A.; LIN, C.P.; SCHUMAN, J.S.; STINSON, W.G.; CHANG, W.; HEE, M.R.; FLOTTE, T.; GREGORY, K.; PULIAFITO, C.A.; FUJIMOTO, J.G. Optical coherence tomography. Science, v.254, n.5035, p.1178-118, 1991.
- LIU, X.; POHL, C. New hydrophilic interaction/reversed-phase mixed-mode stationary phase and its application for analysis of nonionic ethoxylated surfactants. J. Chromatogr. A, v.1191, n.1/2, p.83-89, 2008.
- MASSON, D.S.; MORAIS, G.G.; MORAIS, J.M.; ANDRADE, F.F.; SANTOS, O.D.H.; OLIVEIRA, W.P.; ROCHA FILHO, P.A. Polyhydroxy alcohols and peach oil addition influence on liquid crystal formation and rheological behaviour of O/W emulsions. J. Disper. Sci. Technol, v.26, n.4, p.463-468, 2005.
- McCLEMENTS, D.J. Critical review of techniques and methodologies for characterization of emulsion stability. Crit. Rev. Food Sci., v.47, n.7, p.611-649, 2007.
- MEIRELLES, R.L.; AGGIO, F.B.; COSTA, R.A.; FARAH, M.E. STRATUS optical coherence tomography in unilateral colobomatous excavation of the optic disc and secondary retinoschisis. Graefe Arch. Clin. Exp., v.243, n.1, p.76-81, 2005.
- MELO, L.S.A.; ARAUJO, R.E.; FREITAS, A.Z.; ZEZELL, D.M.; VIEIRA, N.D; GIRKIN, J.; HALL, A.; CARVALHO, M.T.; GOMES, A.S.L. Evaluation of enamel dental restoration interface by optical coherence tomography. J. Biomed. Opt., v.10, n.6, p.1-5, 2005.
- PINTO, T.L.; WAKSMAN, R. Clinical applications of optical coherence tomography. J. Interv. Cardiol., v.19, n.6, p.566-573, 2006.
- PODOLEANU, A.G. Optical Coherence Tomography. J. Microsc., v.247, n.3, p.209-219, 2012.
- SALAGER, J.L. Formulation concepts for the emulsion maker. In: NIELLOUD, F.; MARTI-MESTRES, G., eds. Pharmaceutical emulsions and suspensions. New York: Marcel Dekker, 2000. p.20-68. (Drugs and the pharmaceutical sciences, v.105).
- SANTOS, O.D.H.; MIOTTO, J.V.; MORAIS, J.M.; OLIVEIRA, W.P.; ROCHA-FILHO, P.A. Attainment of emulsions with liquid crystal from marigold oil using the required HLB method. J. Disper. Sci. Technol , v.26, n.2, p.243-249, 2005.
- SCHIMITT, J.M. Optical Coherence Tomography: a review. IEEE J. Sel. Top. Quant, v.5, n.4, p.1205-1215, 1999.
- SHOUGHY, S.S.; JAROUDI, M.O.; KOZAK, I.; TABBARA, K.F. Optical Coherence Tomography in the diagnosis of sclerits and episclerits. Am. J. Ophthalmol., v.159, n.6, p.1045-1049, 2015.
- VELASCO, M.V.R.; BABY, A.R.; SARRUF, F.D.; KANEKO, T.M.; SAMAD, R.E.; VIEIRA JÚNIOR, N.D.; FREITAS, A.Z. Prospective ultramorphological characterization of human hair by optical coherence tomography. Skin Res. Technol., v.15, n.4, p.440-443, 2009.
Publication Dates
-
Publication in this collection
Apr-Jun 2016
History
-
Received
27 Jan 2015 -
Accepted
11 Jan 2016