
ABSTRACT
Mucopolysaccharidoses (MPS) are a group of inherited metabolic disorders caused by deficiency of enzymes that degrade glycosaminoglycans (GAGs). Urinary excretion of GAGs is a common feature of MPS, and is considered their major biomarker. We aimed to adapt the GAG electrophoresis method to a commercial agarose gel which would be able to separate urinary GAGs in a simpler way with good sensitivity and reproducibility. Urine samples from patients previously diagnosed with MPS I, IV, and VI were used as electrophoretic standards. Samples from patients on enzyme replacement therapy (ERT) were also assessed. Commercial agarose gel electrophoresis was effective, showing proper definition and separation of GAG bands. Detection sensitivity exceeded 0.1 µg and band reproducibility were consistent. GAG bands quantified in urine samples from patients on ERT correlated very strongly (correlation coefficient = 0.98) with total GAG concentrations. This application of gel electrophoresis demonstrates the possibility of monitoring patients with MPS treated with ERT by analyzing separately the GAGs excreted in urine. We suggest this process should be applied to MPS screening as well as to follow-up of patients on treatment.
Uniterms:
Mucopolysaccharidoses/tests/treatment; Electrophoresis/monitoring method; Glycosaminoglycans/use.
INTRODUCTION
Mucopolysaccharidoses (MPS) are a group of inherited metabolic disorders caused by a deficiency of enzymes needed for the degradation of glycosaminoglycans (GAGs). The intralysosomal accumulation of GAG molecules results in cell, tissue, and organ dysfunction, which involves multiple systems and follows a chronic and progressive course (Clarke et al., 2012CLARKE, L.A.; WINCHESTER, B.; GIUGLIANI, R.; TYLKI-SZYMANSKA, A.; AMARTINO, H. Biomarkers for the mucopolysaccharidoses: discovery and clinical utility. Mol. Genet. Metab. , v.106, p.395-402, 2012.).
Recently, several research groups have been developing methods for the analysis of urinary GAG levels as a tool to be used in the diagnosis and follow-up of MPS treatment through enzyme replacement therapy (ERT), which is currently available for MPS I, II, and VI (Aurays-Blais et al., 2011AURAYS-BLAIS, C.; BHÉRER, P.; GAGNON, R.; YOUNG, S.P.; ZHANG, H.H.; AN, Y.; CLARKE, J.T.; MILLINGTON, D.S. Efficient analysis of urinary glycosaminoglycans by LC-MS/MS in mucopolysaccharidoses type I, II and VI. Mol. Genet. Metab., v.102, p.49-56, 2011.). This treatment has brought new perspectives to patients, as it can slow the progression of the disease by correcting the enzyme deficiency and, therefore, reducing GAG accumulation. The best results for ERT are obtained when it is introduced in the first years of the patient's life, or in milder variants of MPS.
Among several techniques described in the literature, electrophoresis is widely used for separation and identification of different types of accumulated GAGs in patients' urine. This method is known for its good sensitivity, reproducibility, and ease of applicability in laboratories, as it does not require high-cost equipment. In addition, agarose gel electrophoresis provides good visualization and definition of GAG bands (Coppa et al., 2012COPPA, G.V.; BUZZEGA, D.; ZAMPINI, L.; MACCARI, F.; GALAZZI, T.; PADELLA, L.; SANTORO, L.; GABRIELLI, O.; VOLPI, N. Agarose-gel electrophoresis for the diagnosis of mucopolysaccharidoses. Clin. Chem. Lab. Med. v.50, p.589-592, 2012.).
The main objective of this study was to adapt the conventional technique of GAG electrophoresis to a commercially available agarose gel (manufactured by CELM) and assess the ability of this adapted method to separate GAGs with good visualization while maintaining sensitivity and band reproducibility.
MATERIAL AND METHODS
This study was approved by the Federal University of Rio Grande do Sul Research Ethics Committee (CAAE: 07137612.7.0000.5347), and all participants provided informed consent.
Samples
Urine samples (n=8 per group) collected from patients with MPS I, IV, VI, and normal controls, aged 1 to 5 years, were used as standards for the electrophoretic procedure.
GAGs
GAGs were extracted from urine samples based on the procedure described by Di Ferrante and Rich (1956)DI FERRANTE, N.; RICH, C. The mucopolysaccharide of normal human urine. Clin. Chim. Acta. v.1, p.519-524, 1956., which uses the principle of acid precipitation with cetylpyridinium chloride (CPC) as reagent. The technique described by De Jong, Wevers and Sambeek (1992)DE JONG, J.C.N.; WEVERS, R.A.; SAMBEEK, R.L. Measuring urinary glycosaminoglycans in the presence of protein: an improved screening procedure for mucopolysaccharidoses based on dimethylmethylene blue. Clin. Chem. v.38, p.803-807, 1992. was used for total urinary GAG measurement using 1,9-dimethylmethylene blue (DMB), a colorimetric method based on the affinity of DMB dye for the sulfate group of GAG molecules.
Electrophoresis
Electrophoresis was performed according to the principles of Cappelletti, Rosso, and Chiarugi (1979CAPPELLETTI, R.; ROSSO, M.D.; CHIARUGI, V.P. A new electrophoretic method for the complete separation of all known animal glycosaminoglycans in a monodimensional run. Anal. Biochem. v.99, p.311-315, 1979.) and Hopwood and Harrison (1982HOPWOOD, J.J.; HARRISON, J.R. High-resolution of urinary glycosaminoglycans: an improved screening test for the mucopolysaccharidoses. Anal. Biochem. v.119, p.120-127, 1982.). The solid matrix selected for the procedure was a commercially available, ready-to-use 0.9% agarose gel (Geral(r), CELM - Companhia Equipadora de Laboratórios Modernos, Barueri, SP, Brazil). Before sample loading, the gel was set for 2 min with 0.30 M barium acetate buffer (pH 5). For this solid matrix, the electrophoresis run times had to be adjusted, which made the technique faster. Run times and other parameters are presented in Table I. The electrophoresis was performed in 0.30 M barium acetate buffer (pH 5) and developed in the precipitation stages with ethanol and toluidine blue dye, followed by destaining in water and air-drying.
GAG standard curves and electrophoresis of patients on ERT
Chondroitin sulfate (CS) and dermatan sulfate (DS) solutions at concentrations of 0.25, 0.5, 1, and 2 mg/mL were loaded on the commercial agarose gel and GAG electrophoresis was performed using the protocol described in Table I. Each curve was obtained in different gels and days, and trials were repeated three times. Bands were quantified in AlphaEase FC software (Alpha Innotech Corporation, San Leandro, CA). The results were expressed as mean ± standard deviation and differences in band quantification were analyzed using one-way ANOVA, with significance accepted at p<0.0001.
Urine samples from a patient on ERT treated with Aldurazyme(r) (iduronidase) for MPS I and from two other patients treated with Naglazyme(r) (galsulfase) for MPS VI were analyzed. GAG bands quantification results were compared to total urinary GAG measurements by Pearson's correlation.
Quantification of electrophoretic bands
Bands stained with toluidine blue were scanned and quantified in AlphaEase FC software. The results of GAG bands were quantified in AVG (sum of total pixels divided by band size area) and expressed accordingly.
RESULTS
Commercial agarose gel electrophoresis
Commercial agarose gel electrophoresis was effective, showing proper definition and separation of GAG bands. The GAG accumulation patterns observed were in accordance with the literature: DS, HS, and CS bands in MPS I; KS band in MPS IV; and DS and CS bands in MPS VI. Healthy controls did not show any accumulated GAG bands. This electrophoresis technique, adapted to a commercially available solid gel matrix, showed appropriate GAG migration with excellent separation and visualization of bands (Figure 1).
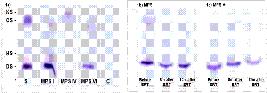
Electrophoresis in a commercial agarose gel (Geral(r), CELM). a) Electrophoresis run showing all GAG bands. KS = keratan sulfate, CS = chondroitin sulfate, HS = heparan sulfate, DS = dermatan sulfate. S = standard, C = control sample. b) Electrophoresis of an MPS I patient before and after enzyme replacement therapy (ERT). c) Electrophoresis of an MPS VI patient before and after ERT. m = months.
CS and DS curves
The sensitivity and reproducibility of the commercial agarose gel electrophoresis technique were demonstrated through GAG standard curves obtained with 0.25, 0.5, 1.0, and 2.0 mg/mL solutions. This technique was sensitive and able to detect very small quantities (>0.1 µg) of GAGs. Three independent trials were carried out for both the CS (y=58.86x + 1.19) and DS (y=89.60x + 10.89) curves (Figure 2a). Reproducibility was analyzed through quantification of bands. Staining intensities were significantly different (p<0.0001, one-way ANOVA).

a) Electrophoretic curve of CS and DS. Electrophoresis performed with different concentrations of CS and DS (0.25, 0.5, 1.0, and 2.0 mg/mL), sample volume 0.5 µl. Analysis of CS and DS quantification curves was performed in by AlphaEase FC software (AVG) and calculated as mean ± standard deviation. Three independent curves were plotted for each GAG. b) Pearson correlation between AVG and DMB methods for GAG quantification. y = 0.43x + 7.15 and r = 0.98.
Follow-up of patients on ERT and quantification
Figure 1b shows electrophoresis of urine samples from patients with MPS and the pattern of the accumulated GAGs bands over time (before and 6 and 12 months after ERT initiation).
The accumulated GAG bands visualized in the commercial agarose gel were quantified individually in AlphaEase FC software, and the total sum was compared to total GAG measurements in urine carried out using the DMB method. The Pearson correlation coefficient between the sum of GAG electrophoretic bands quantification (AVG) and the total GAG measurement was strong and significant at r = 0.98 (y=0.43x + 7.15) (Figure 2b).
Individual analysis of each accumulated band enabled visualization of DS, HS, and CS accumulation in MPS I and DS and CS accumulation in MPS VI, throughout treatment, as well as their differences over time.
DISCUSSION
In the present study, the principles of electrophoretic techniques described in the literature were adapted to a commercial agarose gel, yielding good results in terms of GAG band separation and definition. This can be explained by the small thickness of the gel, which allows faster migration of GAG molecules through the matrix and reduces procedure time. Additionally, reproducibility was demonstrated through CS and DS curves. Another important aspect of this protocol is the short total runtime; due to the quicker electrophoretic runs and destaining procedure, results are obtained in a few hours.
Definitive diagnosis of MPS can only be accomplished through enzyme analysis. However, examining all 11 deficient enzymes in every suspected case is infeasible, because the tests used to measure enzyme activity require high-cost substrates (Reuser et al., 2011REUSER, A.J.; VERHEIJEN, F.W.; BALI, D.; VAN DIGGELEN, O.P.; GERMAIN, D.P.; HWU, W.; LUKACS, Z.; MÜHL, A.; OLIVOVA, P.; PIRAUD, M.; WUYTS, B.; ZHANG, K.; KEUTZER, J. The use of dried blood spot samples in the diagnosis of lysosomal storage disorders - Current status and perspectives. Mol. Genet. Met. v.104, p.144-148, 2011.). Screening through urinary GAG measurement is ideal, as all MPS variants feature GAG accumulation, but quantification of total accumulated GAGs alone is not enough to establish MPS type. Therefore, specific techniques are needed for individual evaluation of the accumulated GAG profile in order to direct enzyme analysis. On the basis of our findings, we suggest that agarose gel electrophoresis using a commercially available gel matrix could be used for neonatal MPS screening through analysis of urinary GAGs. The electrophoretic profile of GAGs separated by electrophoresis has been applied as a screening tool to identify MPS, with satisfactory results (De Lima, Baccarin, Michelacci, 2007DE LIMA, C.R.; BACCARIN, R.Y.A.; MICHELACCI, Y.M. Reliability of 1,9-dimethylmethylene blue tests in comparison to agarose gel electrophoresis for quantification of urinary glycosaminoglycans. Clin. Chim. Acta. v.378, p.206-215, 2007. ; Gallegos-Arreola et al., 2000GALLEGOS-ARREOLA, M.P.; MACHORRO-LAZO, M.V.; FLORES-MARTÍNEZ, S.E.; ZÚÑIGA-GONZÁLES, G.M.; FIGUERA, L.E.; GONZÁLES-NORIEGA, A.; SÁNCHEZ-CORONA, J. Urinary glycosaminoglycan excretion in healthy subjects and in patients with mucopolisaccharidoses. Arch. Med. Res.v.31, p.505-510, 2000.; Piraud et al., 1993PIRAUD, M.; BOYER, S.; MATHIEU, M.; MAIRE, I. Diagnosis of mucopolysaccharidoses in a clinically selected population by urinary glycosaminoglycan analysis: a study of 2,000 urine samples. Clin. Chim. Acta. v.221, p.171-181, 1993.). Electrophoretic analysis can also rule out suspicion of MPS, as our results indicate that healthy individuals do not accumulate GAGs through visible bands.
Urinary GAG measurement is also used for treatment follow-up of patients with MPS, whether treated with ERT or hematopoietic stem cell transplantation, given the importance of GAGs as biomarkers (Aurays-Blais et al., 2011; Wynn et al., 2009WYNN, R.F.; WRAITH, J.E.; MERCER, J.; O'MEARA, A.; TYLEE, K.; THORNLEY, M.; CHURCH, H.J.; BIGGER, B.W. Improved metabolic correlation in patients with lysosomal storage disease treated with hematopoietic stem cell transplant compared with enzyme replacement therapy. J. Pediatr., v.154, p.609-611, 2009.). This field has been widely explored and total GAG analyses have been replaced by methods that directly explore the individual detection of accumulated substrates. Liquid chromatography, ELISA, and mass spectrometry are examples of techniques that have already been evaluated for the direct quantification of DS and HS as a treatment follow-up method (Aurays-Blais et al., 2011AURAYS-BLAIS, C.; BHÉRER, P.; GAGNON, R.; YOUNG, S.P.; ZHANG, H.H.; AN, Y.; CLARKE, J.T.; MILLINGTON, D.S. Efficient analysis of urinary glycosaminoglycans by LC-MS/MS in mucopolysaccharidoses type I, II and VI. Mol. Genet. Metab., v.102, p.49-56, 2011.; De Ru et al., 2013DE RU, M.H.; VAN DER TOL, L.; VAN VLIES, N.; BIGGER, B.W.; HOLLAK, C.E.M.; IJLST, L.; KULIK, W.; VAN LENTHE, H.; SAIF, M.A.; WAGEMANS, T.; VAN DER WAL, W.M.; WANDERS, R.J.; WIJBURG, F.A. Plasma and urinary levels of dermatan sulfate and heparan sulfate derived disaccharides after long-term enzyme replacement therapy (ERT) in MPS I: correlation with the timing of ERT and with total urinary excretion of glycosaminoglycans. J. Inherit. Metab. Dis., v.36, p.247-255, 2013.). In this sense, the electrophoresis technique with commercial agarose gel presented in this study is simple and can be used in small laboratories. In the present study, an individual profile of each accumulated GAG in patients on ERT was obtained. After quantification, differences in GAG accumulation from patient to patient were observed. This is consistent with the literature, as the decrease in GAG accumulation in response to ERT depends on the type of mutation involved, the age at diagnosis and therapy initiation, the presence of neutralizing antibodies, and GAG accumulation status itself (Wynn et al., 2009WYNN, R.F.; WRAITH, J.E.; MERCER, J.; O'MEARA, A.; TYLEE, K.; THORNLEY, M.; CHURCH, H.J.; BIGGER, B.W. Improved metabolic correlation in patients with lysosomal storage disease treated with hematopoietic stem cell transplant compared with enzyme replacement therapy. J. Pediatr., v.154, p.609-611, 2009.). Thus, another suggested application for the method described herein is follow-up of patients treated with ERT by monitoring urinary GAG levels through commercial agarose gel electrophoresis.
In conclusion, our adaptation of established electrophoresis techniques to a commercial agarose gel made this process simpler and faster while ensuring reproducibility and sensitivity. Besides separating and identifying accumulated GAGs in urine samples from MPS patients, GAG bands could be quantified for evaluation of response to ERT. We suggest that this simple, accessible, and reliable methodology can be adopted by clinical laboratories for neonatal screening of MPS among high-risk populations and for follow-up of MPS patients on ERT.
ACKNOWLEDGEMENTS
The authors wish to thank Dr. Charles Marques Lourenço, geneticist, for providing the urine samples from patients with MPS that were used in this study.
We gratefully acknowledge the financial support provided by the Brazilian National Council for Scientific and Technological Development (CNPq).
REFERENCES
- AURAYS-BLAIS, C.; BHÉRER, P.; GAGNON, R.; YOUNG, S.P.; ZHANG, H.H.; AN, Y.; CLARKE, J.T.; MILLINGTON, D.S. Efficient analysis of urinary glycosaminoglycans by LC-MS/MS in mucopolysaccharidoses type I, II and VI. Mol. Genet. Metab., v.102, p.49-56, 2011.
- CAPPELLETTI, R.; ROSSO, M.D.; CHIARUGI, V.P. A new electrophoretic method for the complete separation of all known animal glycosaminoglycans in a monodimensional run. Anal. Biochem. v.99, p.311-315, 1979.
- CLARKE, L.A.; WINCHESTER, B.; GIUGLIANI, R.; TYLKI-SZYMANSKA, A.; AMARTINO, H. Biomarkers for the mucopolysaccharidoses: discovery and clinical utility. Mol. Genet. Metab. , v.106, p.395-402, 2012.
- COPPA, G.V.; BUZZEGA, D.; ZAMPINI, L.; MACCARI, F.; GALAZZI, T.; PADELLA, L.; SANTORO, L.; GABRIELLI, O.; VOLPI, N. Agarose-gel electrophoresis for the diagnosis of mucopolysaccharidoses. Clin. Chem. Lab. Med. v.50, p.589-592, 2012.
- DE JONG, J.C.N.; WEVERS, R.A.; SAMBEEK, R.L. Measuring urinary glycosaminoglycans in the presence of protein: an improved screening procedure for mucopolysaccharidoses based on dimethylmethylene blue. Clin. Chem. v.38, p.803-807, 1992.
- DE LIMA, C.R.; BACCARIN, R.Y.A.; MICHELACCI, Y.M. Reliability of 1,9-dimethylmethylene blue tests in comparison to agarose gel electrophoresis for quantification of urinary glycosaminoglycans. Clin. Chim. Acta. v.378, p.206-215, 2007.
- DE RU, M.H.; VAN DER TOL, L.; VAN VLIES, N.; BIGGER, B.W.; HOLLAK, C.E.M.; IJLST, L.; KULIK, W.; VAN LENTHE, H.; SAIF, M.A.; WAGEMANS, T.; VAN DER WAL, W.M.; WANDERS, R.J.; WIJBURG, F.A. Plasma and urinary levels of dermatan sulfate and heparan sulfate derived disaccharides after long-term enzyme replacement therapy (ERT) in MPS I: correlation with the timing of ERT and with total urinary excretion of glycosaminoglycans. J. Inherit. Metab. Dis, v.36, p.247-255, 2013.
- DI FERRANTE, N.; RICH, C. The mucopolysaccharide of normal human urine. Clin. Chim. Acta. v.1, p.519-524, 1956.
- GALLEGOS-ARREOLA, M.P.; MACHORRO-LAZO, M.V.; FLORES-MARTÍNEZ, S.E.; ZÚÑIGA-GONZÁLES, G.M.; FIGUERA, L.E.; GONZÁLES-NORIEGA, A.; SÁNCHEZ-CORONA, J. Urinary glycosaminoglycan excretion in healthy subjects and in patients with mucopolisaccharidoses. Arch. Med. Res.v.31, p.505-510, 2000.
- HOPWOOD, J.J.; HARRISON, J.R. High-resolution of urinary glycosaminoglycans: an improved screening test for the mucopolysaccharidoses. Anal. Biochem. v.119, p.120-127, 1982.
- PIRAUD, M.; BOYER, S.; MATHIEU, M.; MAIRE, I. Diagnosis of mucopolysaccharidoses in a clinically selected population by urinary glycosaminoglycan analysis: a study of 2,000 urine samples. Clin. Chim. Acta. v.221, p.171-181, 1993.
- REUSER, A.J.; VERHEIJEN, F.W.; BALI, D.; VAN DIGGELEN, O.P.; GERMAIN, D.P.; HWU, W.; LUKACS, Z.; MÜHL, A.; OLIVOVA, P.; PIRAUD, M.; WUYTS, B.; ZHANG, K.; KEUTZER, J. The use of dried blood spot samples in the diagnosis of lysosomal storage disorders - Current status and perspectives. Mol. Genet. Met. v.104, p.144-148, 2011.
- WYNN, R.F.; WRAITH, J.E.; MERCER, J.; O'MEARA, A.; TYLEE, K.; THORNLEY, M.; CHURCH, H.J.; BIGGER, B.W. Improved metabolic correlation in patients with lysosomal storage disease treated with hematopoietic stem cell transplant compared with enzyme replacement therapy. J. Pediatr, v.154, p.609-611, 2009.
Publication Dates
-
Publication in this collection
Dec 2016
History
-
Received
21 July 2015 -
Accepted
13 Sept 2016


