ABSTRACT
This work presents the development of a methodology based on the formation of a charge transfer complex between quinalizarin and rosuvastatin, allowing for the spectrophotometric determination of rosuvastatin at 579 nm. The factors involved in the sensitivity of the technique were studied (nature and proportion of the solvent, reaction time, pH of aqueous phase and quinalizarin concentration). The proposed spectrophotometric procedures were validated with respect to linearity, ranges, precision, accuracy, detection and quantification limits. Calibration curves of the formed color products showed good linear relationships over the concentration range of 6-15 mg L-1. The proposed method has been successfully applied, which can be confirmed by interference test (comparison between the standard curves and addition of analyte), method precision (RSD 2.3% to 6 mg L-1), and by accuracy (statistically equivalent results between the proposed method and a chromatographic method of reference).
Keywords:
Rosuvastatin/spectrophotometric determination; Rosuvastatin/charge transfer complex; Quinalizarin/charge transfer complex; Pharmaceutical formulations.
INTRODUCTION
Cardiovascular diseases, defined as diseases that affect the heart and blood vessels, are the leading cause of death worldwide. These diseases manifest in various ways, one of which being coronary artery disease, which leads to acute myocardial infarction. In this case, there is a progressive accumulation of lipid material on the wall of the arteries that supply blood to the heart, leading to their strengthening due to so-called atheroma plaques (Brats, 2009).
Concerns about these diseases are not new, and have led to the development of many drugs in an attempt to reduce the associated risks. One noteworthy class of drugs in this regard is composed of statins, which have revolutionized the prevention of cardiovascular diseases and are currently the most prescribed drugs in these cases. They act by inhibiting 3-hydroxy-3-methylglutaryl coenzyme A (HMG-CoA) reductase, which is important in the synthesis of intracellular cholesterol in hepatocytes (Campo, Carvalho, 20078. Campo VL, Carvalho I. Estatinas hipolimêmicas e novas tendências terapêuticas. Quím Nova. 2007;30(2):425-430.).
Many drugs belonging to this this class are registered with the Food And Drug Administration (FDA) and differ in terms of potency and pharmacological profile. One of them is rosuvastatin (RSV) (Figure 1), which represents a new class of synthetic statins, with enantiomeric purity (Campo, Carvalho, 20078. Campo VL, Carvalho I. Estatinas hipolimêmicas e novas tendências terapêuticas. Quím Nova. 2007;30(2):425-430.).
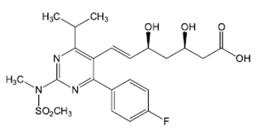
Rosuvastatin ((3R,5S,6E)-7-[4-(4-fluorophenyl)-6-(1-methylrthyl)-2-[methyl(methylsulfonyl)amino]-5-pyrimidinyl]-3,5-dihydroxy-6-heptenoic acid) was approved in 2003 by the FDA and is sold by AstraZeneca as Crestor®. It is sparingly soluble in water and methanol and slightly soluble in ethanol (The Merck Index, 2006).
Some methods have been developed for the quantitation of rosuvastatin in pharmaceutical formulations. Ramadan, Mandil and Alshelhawil (201416. Ramadan AA, Mandil H, Alshelhawi, N. Spectrophotometric determination of rosuvastatin calcium in pure form and pharmaceutical formulations by the oxidation using iodine and formation triiodide complex in acetonitrile. Int J Pharm Pharm Sci. 2014;6(5):579-585.) developed a spectrophotometric method based on a derivatization reaction of rosuvastatin with iodine, as well as an electrochemical method based on differential pulse polarography using a dropping mercury electrode (Ramadan, Mandil, Ghazal, 2015). In addition, some methods based on chromatographic separation have also been proposed (Beludari, Prakash, Mohan, 20135. Beludari MI, Prakash KV, Mohan GK. RP-HPLC method for simultaneous estimation of rosuvastatin and ezetimibe from their combination tablet dosage form. Int J Chem Anal Sci. 2013;4(4):205-209.; Purkar et al., 201415. Purkar AJ, Balap AR, Sathiyanarayanan L, Mahadik, KR. Development and validation of HPTC method for simultaneous determination of rosuvastatin calcium and aspirin in its pure and pharmaceutical dosage form. Int J Pharm Pharm Sci. 2014;6(5):704-706.).
Alzoman et al. (20132. Alzoman NZ, Sultan M, Maher H, Alshehri M, Wani T, Darwish A. Analytical study for the charge-transfer complexes of rosuvastatin calcium with pi-acceptors. Molecules. 2013;18:7711-7725.) and Wani et al. (201322. Wani TA, Darwish IA, Khalil NY. Novel microwell-based spectrophotometric assay for the determination of rosuvasatin calcium in its pharmaceutical formulations. Curr Pharm Anal. 2013;9(1):54-60.) developed and applied a spectrophotometric method based on the charge transfer reaction between calcium rosuvastatin and π acceptors (Alzoman et al., 2013; Wani et al., 2013). El-Bagary also proposed a method for the determination of this drug (El-Bagary, Elkady, Kadry, 201210. El-Bagary RI, Elkady EF, Kadry AM. Spectrofluorimetric determination of certain antihyperlipidemic agents in bulk and pharmaceutical preparations. Spectroscopy: Int J. 2012;27(2):83-92.) in pharmaceutical preparations based on spectrophotometric determinations.
In urine, Silva et al. proposed an electrochemical methodology using carbon nanotubes and graphene oxide as the electrode material (Silva et al., 2015), while Braga et al proposed a fluorimetric determination method after liquid-liquid extraction (Braga et al., 2013).
The present study reports the development of a spectrophotometric method for the determination of rosuvastatin in pharmaceutical formulations by employing a charge transfer reaction with quinalizarin. This reaction leads to the formation of a colored complex, which is the result of the interaction between a donor, in this case rosuvastatin, and an electron acceptor, quinalizarin, (Mostafa, El-Sadek, Alla, 200213. Mostafa M, El-Sadek M, Alla E. Spectrophotometric determination of ciprofloxacin, enrofloxacin and pefloxacin through charge transfer complex formation. J Pharmaceut Biomed Anal. 2002;27(1-2):133-142.) that absorbs in the visible region of the eletromagnetic spectrum and posses a high molar absorptivity coefficient (Arslan, Duymus, 20073. Arslan M, Duymus H. Spectroscopic studies of chrage transfer complexes between colchicine and some pi acceptors. Spectrochim Acta A. 2007;67(3-4):573-577.; Alzoman et al., 20132. Alzoman NZ, Sultan M, Maher H, Alshehri M, Wani T, Darwish A. Analytical study for the charge-transfer complexes of rosuvastatin calcium with pi-acceptors. Molecules. 2013;18:7711-7725.). The anion radical, resulting from the reaction between the drug and quinalizarin, absorbs radiation at a wavelength of 579 nm. This method has the advantage of assessing the reaction product in an area where less interferences from other substances are present, such as in the ultraviolet region.
The methodology was applied to the quantification of rosuvastatin in pharmaceutical formulations acquired from a local market in Niterói City (RJ/Brazil). The results were compared with a reference methodology (HPLC-UV). To the best of our knowledge, this is the first study on the determination of rosuvastatin using quinalizarin.
MATERIAL AND METHODS
Instrumentation
The spectrophotometric measurements were conducted on an Agilent Technologies Cary 60 UV-Vis spectrophotometer, in scanning mode, from 200 to 800 nm. Quartz cuvettes with an optical path of 1 cm were employed. The maximum wavelength set for checking absorbance was 579 nm. For the comparative chromatographic methodology, a 3000 HPLC from Dionex, with injection volume of 20 µL and UV detector set at 241 nm were used. The mobile phase consisted of a mixture 60/40 (v/v) acetonitrile/water with pH adjusted to 2.9 with phosphoric acid, at a flow rate of 1 mL min-1. A C-18 column (150 x 4.6 mm, 4 mm) from Phenomenex was used. The temperature was maintained at 30 °C. The mobile phase was sonicated for 20 min in an USC-1600 ultrasound (Unique, São Paulo, Brazil).
An analytical AY 220 balance (Shimadzu, São Paulo, Brazil) was used for the preparation of all solutions. An ADM-22 model pH meter (Digimed, São Paulo, Brazil) equipped with a combination electrode glass (Ag/AgCl) was used for the pH evaluations.
Reagents and solutions
All reagents were of analytical grade. All solutions were prepared using purified water obtained by a Millipore Direct-Q System 3 (Milford, USA), with resistivity of 18.2 MΩ cm.
The rosuvastatin standard was provided by Neopharma (Minas Gerais, Brazil). The methanolic 200 mg L-1 stock solution used in the spectrophotometric methodology was prepared by dissolving 20.83 mg of rosuvastatin calcium in a 100 mL volumetric flask, subsequently adjusted to 100 mL with methanol.
For the confirmatory chromatographic methodology, the 200 mg L-1stock solution was prepared in the same way, with final volume adjustment by the addition of a (60/40) acetonitrile solution, with subsequent addition of phosphoric acid to pH 2.9. This solution was then filtered through a Millipore Millex - GV hydrophilic PVDF membrane, with 0.22 µm pore size.
Quinalizarin was provided by Acros Organics (St. Louis, USA). The quinalizarin 500 mg L-1 stock solution was prepared by dissolving 25 mg of quinalizarin in dimethylsulfoxide (DMSO) (Tedia, Brazil) with final volume adjusted with the same solvent in a 50 mL volumetric flask.
Analytical curves
The analytical curve used in the spectrometric methodology was prepared by dilutions of a 200 mg L-1RSV stock solution, in 5.0 mL volumetric flasks. The concentrations ranged from 6.0 to 15 mg L-1. The final volume was adjusted by adding water. For the comparative chromatographic study, the analytical curve was prepared by the dilution of the same stock solution in 10 mL volumetric flasks, with the final volume adjusted by adding the 60/40 acetonitrile/phosphoric acid pH 2.9 solution. This curve was prepared in the range from 0.5 to 2.5 mg L-1.
Sample preparation
The samples submitted to the quantification process were acquired from local markets in the city of Niterói - RJ. Three of the samples (A1, A2 and A3) had an RSV amount per tablet of 10 mg, while sample A4 had 20 mg, as stated by the manufacturers.
Two tablets from each sample were taken, weighed and subsequently crushed with a mortar and pestle. An aliquot of each was taken, weighed and transferred to a 50 mL flask, where they were solubilized with methanol and filtered through a Millipore Millex - GV, hydrophilic PVDF membrane (0.22 µm pore size), into a 25.0 mL volumetric flask, followed by 400 µL of the 500 mg L-1quinalizarin solution, 3.75 mL of DMSO and 600 µL of water. The final volume was adjusted with methanol. These solutions were then analyzed spectrophotometrically at 579 nm.
For the comparative HPLC methodology, the solid aliquots were solubilized in the acetonitrile/phosphoric acid (pH 2.9) 60/40 solution and filtered in the same way as described above.
RESULTS AND DISCUSSION
The proposed method optimization was carried out in 3 steps. In the first step, variables such as solvent, time, pH, and the proportion of DMSO/quinalizarin were optimized. The stoichiometry of the reaction between rosuvastatin and quinalizarin was then evaluated by molar ratio calculations. The third step evaluated the possibility of matrix interferences.
After method optimization, the determination of rosuvastatin in pharmaceutical formulations was conducted, with the results subsequently compared to an alternative method.
In preliminary studies, the influence of time was evaluated and no significant alterations were observed in a timeframe of 15 to 6 hours. This indicates that time does not influence the analytical signal, suggesting that the reaction is fast and that the formed product does not degrade.
Nature of the solvent
The first studied parameter was the effect of the nature of the solvent. The solvent acts in promoting the stabilization of the radical anion formed upon the charge transfer reaction, as well as in stabilizing the complex. It is worth emphasizing that polar solvents facilitate this charge transfer reaction (Basavaiah, 20044. Basavaiah K. Determination of some psychotropic phenothiazine drugs by charge-transfer complexation reaction with chloranilic acid. Il Farmaco. 2004;59(4):315-321.). Thus, the evaluated solvents were: DMSO, methanol, ethanol and acetonitrile (ACN). All the solutions were prepared at a 50% solvent, 50% water ratio. The results are displayed in Figure 2.
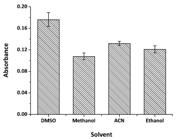
Effect of the solvent on the analytical signal. Conditions: quinalizarin: 30 mg L-1; rosuvastatin: 20 mg L-1 in 50% water solution.
The best analytical signal was attained with the use of DMSO. This is probably due the fact that this solvent has the highest dielectric constant among the tested solvents (The Merck Index, 2006), which provides the best conditions for stabilizing the anion radical formed in the charge transfer reaction. Thus, DMSO was chosen as the solvent in all subsequent assays.
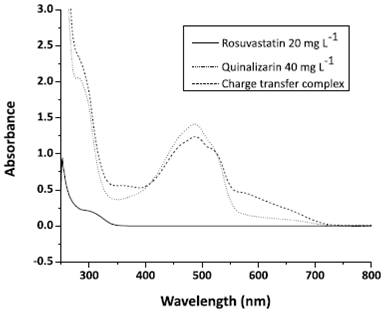
Figure 3 displays the rosuvastatin, quinalizarin and the charge transfer complex absorption spectra in DMSO 50% v/v solutions. Quinalizarin shows an absorption band at 486 nm, while the complex shows an absorption band at 579 nm. Rosuvastatin (colorless) shows only one band at 308 nm.
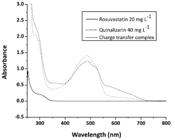
Absorption spectra of rosuvastatin 20 mg L-1, quinalizarin 40 mg L-1 and the radical anionic, all DMSO in solutions.
pH effect
The study of pH is important because both the analyte, rosuvastatin, and the reagent, quinalizarin, show different equilibria as a function of pH (Yamini et al., 200223. Yamini Y, Hassan J, Mohandesi R, Bahramifar N. Preconcentration of trace amounts of beryllium in water samples on octadecyl silica cartridges modified by quinalizarine and its determination with atomic absorption spectrometry. Talanta. 2002;56(3):375-381.). To evaluate the pH effect, different solutions of the anion radical were prepared in different pHs, adjusted by adding the Britton-Robbinson buffer. The condition that provided the best analytical signal was no pH adjustment at all (pH 5.5). To guarantee that the absence of the buffer would not produce a calibration problem, the pH of a sample solution was prepared, and exactly the same value observed for the samples was found.
DMSO/Water proportion
The reaction between rosuvastatin and quinalizarin requires DMSO to stabilize the anion radical, but also requires another solvent, since rosuvastatin was separated by the most of the excipients of the pharmaceutical formulation by solid-liquid extraction in methanol, followed by filtration. As this extract is miscible with water, the effect of the DMSO/water ratio on the analytical signal was investigated.
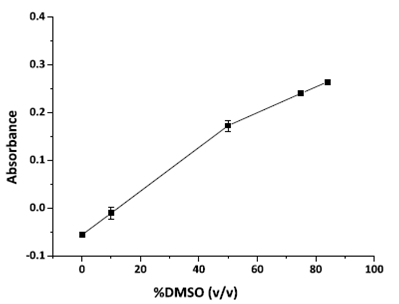
The results of this investigation are displayed in Figure 4. The proportion of 75% DMSO and 25% water was chosen, since the increase in the analytical signal from that value onwards was insignificant.

Investigation of the DMSO/Water proportion effect on the analytical signal. Experimental conditions: quinalizarin: 30 mg L-1; rosuvastatin: 20 mg L-1.
Study of quinalizarin concentration influence
The influence of quinalizarin concentrations on the analytical signal was also investigated. The results displayed in Figure 5 indicate that the analytical signal increased until reaching a plateau, beginning at 30 mg L-1. This maximum is probably due to the end of the reaction. To ensure sufficient robustness, the quinalizarin concentration used in all further assays was 40 mg L-1.

Study of the effect of quinalizarin concentrations on the analytical signal. Experimental conditions: rosuvastatin: 20 mg L-1 in DMSO: 75% (v/v).
Study of the reaction stoichiometry
The stoichiometry of the reaction between rosuvastatin and quinalizarin was evaluated by the molar ratio technique, developed by Yo and Jones (Yoe, Jones, 194424. Yoe JH, Jones AL. Colorimetric determination of iron with disodium-1,2-dihydroxybenzene-3,5-disulfonate. Ind Eng Chem Anal. 1944;16(2):111-115.). Several solutions of the complex were prepared, with constant rosuvastatin concentration, while quinalizarin concentrations ranged from 0 to 70 mg L-1. The absorbances of the solutions were measured and the results are displayed in Figure 6.

Aplication of the molar ration technique to determine the stoichiometry of the charge transfer reaction. Experimental conditions: rosuvastatin: 20 mg L-1 and DMSO: 75% (v/v).
The condition that provided the higher analytical signal was shown to be two quinalizarin for each rosuvastatin, corroborating other studies in the literature for other charge transfer reactions with quinalizarin (Paula, Almeida, Cassella, 201014. Paula CER, Almeida, VGK, Cassella, RJ. Determinação espectrofotométrica de cefalexina em formulações farmacêuticas explorando a sua reação de transferência de carga. Quim Nova. 2010;33(4):914-919.; Gouda, El-Sheikh, El-Azzazy, 201212. Gouda AA, El-Sheikh R, El-Azzazy RM. Charge transfer spectrophotometric determination of Zolmitriptan in pure and dosage forms. J Anal Bioanal Techniques. 2012;3(6):1-8.).
Method evaluation
Analytical parameters of merit
Partial validation, as the establishment of some analytical parameters of merit is called, is performed in order to ensure that the method produces reliable information (Ribani et al., 200418. Ribani M, Bottoli CBG, Collins CH, Jardim ICSF, Melo LE. Validação em métodos cromatográficos e eletroforéticos. Quím Nova. 2004;27(5):771-780.). This is conducted during and after the optimization of all investigated variables. In the present study case, the parameters of merit obtained were linear response range (linearity), repeatability (precision), limit of detection (L.O.D), limit of quantitation (L.O.Q.) and accuracy.
Linearity
The linear response range between the analytical signal and the rosuvastatin concentration was obtained by constructing a calibration curve from 6.0 to 15.0 mg L-1 (Figure 7).

Analytical curve for the determination of rosuvastin using the charge transfer reaction. Experimental conditions: quinalizarin: 40 mg L-1; rosuvastatin: 20 mg L-1 and DMSO 75% (v/v).
Precision
The precision was evaluated by the measurement of 10 standard solutions of the complex, prepared at 6.0 mg L-1, and was of 2.3%, expressed as relative standard deviation (RSD).
The standard deviation of the relative value obtained for this solution indicates that the developed method has adequate precision, since, according the most of references which deals with the validation of analytical RSD values higher than 5% are not acceptable (FDA, 2015; Ermer, Miller, 20069. Ermer J, Miller JHMCB. Method validation in pharmaceutical analysis: a guide to best practice. Weinheim: Wiley; 2006. 403 p.; ANVISA, 2003)
Limit of Detection (L.O.D) and Limit of Quantification (L.O.Q)
The limit of detection (LOD) and the limit of quantification (LOQ) were calculated according equations (1) and (2), where “” is the standard deviation of 10 measurements of the blank, and “S” is the angular coefficient of the linear equation.
The L.O.D. obtained was 0.9, while the L.O.Q was 3.0 mg L-1.
Study of interferences
One of the reasons that methanol is used in the extraction of process of RSV from the pharmaceutical formulation is due to the fact that RSV solubility is higher in this solvent than in water, while the solubility of the excipients is lower in methanol compared to water. Of the several compounds used as vehicles present in the pharmaceutical formulation evaluated in the present study, only lactose is methanol-soluble.
The interference of different lactose concentrations (1.0 x 10⁻⁴ to 1.0 x 10⁻² mol L-1) in the formation of the charge transfer complex was evaluated, and results indicate that this compound does not interfere in the reaction.
Comparisons were also conducted between an analytical curve and an analyte addition curve for all investigated samples. As displayed in Table I, the analyte addition curve showed the same angular coefficient of the analytical curve, demonstrating that this methodology is not susceptible to matrix interferences.
Application of the developed method for the determination of rosuvastatin in pharmaceutical formulations and comparison with a chromatographic methodology
As the proposed method is free from matrix interferences, the developed methodology was applied to the determination of rosuvastatin in samples prepared as described in section 2.3.
To calculate the accuaracy of the proposed method, the same samples analyzed in the present study were also submitted to rosuvastatin quantification by an alternative methodology (HPLC-UV), adapted from Sultana, Arayne and Naveed (201020. Sultana N, Arayne MS, Naveed S. Simultaneous determination of captopril and statins in API, pharmaceutical formulations and in human serum by RP-HPLC. J Chin Chem Soc-Taip. 2010;57(3A):378-383.). The samples were also treated as described in section 2.3, and the results of the quantifications are displayed in Table II.
The paired t-test was then applied to compare the two methods. The calculated t (1.29) is less than the tabulated t (3.18) at a confidence level of 95% and 3 degrees of freedom. This indicates no statistical difference between the two methods.
CONCLUSIONS
In the present study, a novel methodology for rosuvastatin determination in pharmaceutical formulations was proposed, based on a charge transfer reaction between RSV with quinalizarin. An L.O.Q. of 3.0 mg L-1 is enough for the determination of rosuvastatin in pharmaceutical formulations, and the method is free from matrix interferences. The precision of the method was evaluated by ten authentic replicas, and a value of 2.3% (reported as relative standard deviation) was found. The comparison of this methodology with another method reported in the literature (based on HPLC-UV determinations) indicates that the proposed method can be considered accurate, since no statistical difference was observed between the RSV concentrations obtained by both techniques. Furthermore, this is a simple method that does not require many steps with regard to sample preparation. Such a method may be a suitable alternative for the determination of this drug in routine analyses.
ACKNOWLEDGEMENTS
The authors would like to thank FAPERJ for financial support.
REFERENCES
-
1Agência Nacional de Vigilância Sanitária. ANVISA. Resolução nº 899, de 29 de maio de 2003. Guia para validação de métodos analíticos e bioanalíticos. Diário Oficial da República Federativa do Brasil, Brasília, DF, 02 jun. 2003.
-
2Alzoman NZ, Sultan M, Maher H, Alshehri M, Wani T, Darwish A. Analytical study for the charge-transfer complexes of rosuvastatin calcium with pi-acceptors. Molecules. 2013;18:7711-7725.
-
3Arslan M, Duymus H. Spectroscopic studies of chrage transfer complexes between colchicine and some pi acceptors. Spectrochim Acta A. 2007;67(3-4):573-577.
-
4Basavaiah K. Determination of some psychotropic phenothiazine drugs by charge-transfer complexation reaction with chloranilic acid. Il Farmaco. 2004;59(4):315-321.
-
5Beludari MI, Prakash KV, Mohan GK. RP-HPLC method for simultaneous estimation of rosuvastatin and ezetimibe from their combination tablet dosage form. Int J Chem Anal Sci. 2013;4(4):205-209.
-
6Braga VSM, Mancilha TP, Cassella RJ, Pacheco WF. Determination of rosuvastatin in urine by spectrofluorimetry after liquid-liquid extraction and derivatization in acidic medium. J Fluoresc. 2013;23(1):49-55.
-
7Boletim Brasileiro de Avaliação de Tecnologias em Saúde. BRATS. Estatinas na prevenção primária de eventos cardiovasculares. Brasília: ANS; 2009. [citado 2015 Nov 10]. Disponível em: http://www.ans.gov.br/images/stories/Materiais_para_pesquisa/Perfil_setor/Brats/2009_mes09_brats_09.pdf.
-
8Campo VL, Carvalho I. Estatinas hipolimêmicas e novas tendências terapêuticas. Quím Nova. 2007;30(2):425-430.
-
9Ermer J, Miller JHMCB. Method validation in pharmaceutical analysis: a guide to best practice. Weinheim: Wiley; 2006. 403 p.
-
10El-Bagary RI, Elkady EF, Kadry AM. Spectrofluorimetric determination of certain antihyperlipidemic agents in bulk and pharmaceutical preparations. Spectroscopy: Int J. 2012;27(2):83-92.
-
11Food and Drug Administration. FDA. Guidance for industry: analytical procedures and methods validation: chemistry, manufacturing, and controls and documentation. Silver Spring: FDA; 2015. 15 p.
-
12Gouda AA, El-Sheikh R, El-Azzazy RM. Charge transfer spectrophotometric determination of Zolmitriptan in pure and dosage forms. J Anal Bioanal Techniques. 2012;3(6):1-8.
-
13Mostafa M, El-Sadek M, Alla E. Spectrophotometric determination of ciprofloxacin, enrofloxacin and pefloxacin through charge transfer complex formation. J Pharmaceut Biomed Anal. 2002;27(1-2):133-142.
-
14Paula CER, Almeida, VGK, Cassella, RJ. Determinação espectrofotométrica de cefalexina em formulações farmacêuticas explorando a sua reação de transferência de carga. Quim Nova. 2010;33(4):914-919.
-
15Purkar AJ, Balap AR, Sathiyanarayanan L, Mahadik, KR. Development and validation of HPTC method for simultaneous determination of rosuvastatin calcium and aspirin in its pure and pharmaceutical dosage form. Int J Pharm Pharm Sci. 2014;6(5):704-706.
-
16Ramadan AA, Mandil H, Alshelhawi, N. Spectrophotometric determination of rosuvastatin calcium in pure form and pharmaceutical formulations by the oxidation using iodine and formation triiodide complex in acetonitrile. Int J Pharm Pharm Sci. 2014;6(5):579-585.
-
17Ramadan AA, Mandil H, Ghazal, N. Differential pulse polarographic behavior and determination of rosuvastatin in oure form and in pharmaceutical preparations using a static mercury drop electrode. Int J Pharm Pharm Sci. 2015;7(1):389-396.
-
18Ribani M, Bottoli CBG, Collins CH, Jardim ICSF, Melo LE. Validação em métodos cromatográficos e eletroforéticos. Quím Nova. 2004;27(5):771-780.
-
19Silva TA, Zanin H, Vicentini FC, Corat EJ, Filho OF. Electrochemical determination of rosuvasatin calcium in pharmaceutical and human body fluid samples using a composite of vetically aligned carbon nanotubes and graphene oxide as the electrode material. Sensor Actuat B: Chem. 2015;218:51-59.
-
20Sultana N, Arayne MS, Naveed S. Simultaneous determination of captopril and statins in API, pharmaceutical formulations and in human serum by RP-HPLC. J Chin Chem Soc-Taip. 2010;57(3A):378-383.
-
21The Merck Index. 14ª ed. New Jersey: Merck & Co.; 2006.
-
22Wani TA, Darwish IA, Khalil NY. Novel microwell-based spectrophotometric assay for the determination of rosuvasatin calcium in its pharmaceutical formulations. Curr Pharm Anal. 2013;9(1):54-60.
-
23Yamini Y, Hassan J, Mohandesi R, Bahramifar N. Preconcentration of trace amounts of beryllium in water samples on octadecyl silica cartridges modified by quinalizarine and its determination with atomic absorption spectrometry. Talanta. 2002;56(3):375-381.
-
24Yoe JH, Jones AL. Colorimetric determination of iron with disodium-1,2-dihydroxybenzene-3,5-disulfonate. Ind Eng Chem Anal. 1944;16(2):111-115.
Publication Dates
-
Publication in this collection
2017
History
-
Received
07 Oct 2016 -
Accepted
31 Dec 2016