Abstract
Long-term scenarios for mobility within cities usually neglect the energy supply challenge and how the implied risks affect urban mobility services. High levels of private transport and fossil fuel dependency tend to prevail in urban agglomerations of modern cities in many parts of the world. The resilience approach supports a new perspective on transportation solutions, not only based on how to consume less energy or emit less CO2, but how vulnerable urban mobility is in face of a fossil threat. This paper aims to assess the vulnerability of urban mobility in the face of fossil fuel threats under a social and geographical scope. We apply a case study with the city of Rio de Janeiro, confronting city inhabitants with a price increase of gasoline and oil-based public transportation. We found that more than 50% of the districts of Rio de Janeiro presents low-medium or low level of resilience of urban mobility. Furthermore, they are in areas with lower accessibility to metro stations and more citizens with reduced income levels.
Keywords:
Urban mobility; Resilience; Energy security
Resumo
Cenários de longo prazo para a mobilidade dentro das cidades geralmente negligenciam o desafio do fornecimento de energia e como os riscos implícitos podem afetar os serviços de mobilidade urbana. Altos níveis de uso de transporte privado e dependência de combustíveis fósseis tendem a prevalecer nas aglomerações urbanas das cidades em muitas partes do mundo. A abordagem de resiliência suporta uma nova perspectiva sobre soluções de transporte, não apenas com base em quanto menos energia pode ser consumida ou CO2 pode ser emitido, mas também como a mobilidade urbana é vulnerável caso haja uma ameaça de petróleo. O objetivo deste trabalho é avaliar a vulnerabilidade da mobilidade urbana diante das ameaças de combustíveis fósseis em âmbito social e geográfico. Este artigo aplica um estudo de caso à cidade do Rio de Janeiro, confrontando habitantes da cidade com um aumento de preço do transporte público e privado à base de petróleo. Constatou-se que mais de 50% dos distritos do Rio de Janeiro apresentam um baixo-médio ou baixo nível de resiliência da mobilidade urbana. Além disso, estão localizados em áreas com menor acessibilidade às estações de metrô e onde mais habitantes apresentam reduzidos níveis de renda.
Palavras-chave:
Mobilidade urbana; Resiliência; Segurança energética
Introduction
According to the World Bank (2015a)World Bank. (2015a). Urban population (% of total). Washington: World Bank. Retrieved in 2015 January 12, de http://data.worldbank.org/indicator/SP.URB.TOTL.IN.ZS.
http://data.worldbank.org/indicator/SP.U...
, global urban population already outnumbers the rural, this threshold was reached in 2007, generating higher concerns regarding energy supply and consumption in urban areas. It is unquestionable that the world still is mostly dependent on fossil fuels. Approximately 81% of the primary energy consumed in the world comes from fossil fuels, almost unaltered since 1990 (World Bank 2015bWorld Bank. (2015b). Fossil fuel energy consumption (% of total). Washington: World Bank. Retrieved in 2015 January 12, de http://data.worldbank.org/indicator/EG.USE.COMM.FO.ZS.
http://data.worldbank.org/indicator/EG.U...
). Regarding the transport sector, the goal of policies aims to reduce anthropogenic impact on climate change, by reducing the emission of greenhouse gas by fossil fuels.
This research addresses the urban mobility from the resilience perspective, with the intention of focusing on the urban mobility facing challenges regarding shock situations, such as (sudden) price increase or disrupted fossil fuel supply. Such developments can be caused by natural or anthropogenic factors. Most literature on sustainable solutions has been approaching mobility issues from the perspective of reducing greenhouse gas emissions to limit negative impacts on the environment and human health.
However, this paper seeks to understand whether the urban mobility solutions in the city of Rio de Janeiro today represent a “real” transition regarding fossil fuel dependency or are still postponing the problem. Which is keeping the mobility sector dependent on a limited resource that can have a price increase, generating an “uncomfortable” situation for citizens (Parish, 2009Parish, D. (2009). The 1973 – 1975 Energy Crisis and Its Impact on Transport. London: Royal Automobile Club Foundation for Motoring. Retrieved in 2014 June 13, from http://www.racfoundation.org/assets/rac_foundation/content/downloadables/energy%20crisis%20-%20parish%20-%20161009%20-%20report.pdf.
http://www.racfoundation.org/assets/rac_...
; Mogridge, 1978Mogridge, M. J. H. (1978). The effect of oil crisis on the growth in the ownership and use of cars. Transportation, 7(1), 45-67. http://dx.doi.org/10.1007/BF00148371.
http://dx.doi.org/10.1007/BF00148371...
), regarding the availability of financial resources to maintain their mobility conditions. The main hypothesis of this paper is that the city of Rio de Janeiro does not present appropriate social and urban conditions to be resilient in the face of a fossil fuel threat.
Lovelace & Philips (2014)Lovelace, R., & Philips, I. (2014). The ‘oil vulnerability’of commuter patterns: A case study from Yorkshire and the Humber, UK. Geoforum, 51, 169-182. http://dx.doi.org/10.1016/j.geoforum.2013.11.005.
http://dx.doi.org/10.1016/j.geoforum.201...
and Krumdieck et al. (2010)Krumdieck, S., Page, S., & Dantas, A. (2010). Urban form and long-term fuel supply decline: A method to investigate the peak oil risks to essential activities. Transportation Research Part A, Policy and Practice, 44(5), 306-322. http://dx.doi.org/10.1016/j.tra.2010.02.002.
http://dx.doi.org/10.1016/j.tra.2010.02....
is within the few existing works approaching the resilience, urban mobility and fossil fuels issues. The first one addresses the oil vulnerability of commuter patterns, identifying the vulnerability of commuters based on expenses with transportation, energy consumed to reach work and distance to employment centers, considering current social, urban and mobility conditions. The second paper deals with how many trips would be constrained or enhanced under different proposed urban projects and risks of fossil fuel availability, based on the mobility options. In other words, how would the urban mobility adapt under different urban and energy availability circumstances. Different from these authors, this paper approaches the resilience of urban mobility as a process of persistence, adaptability and transformability, based on the conceptual framework and model developed in this paper. Furthermore, applying the proposed model to a city in a developing country, Brazil.
Aiming at the urban scale, there are a few elements that have influence on the relation between the cities and their dependency on fossil fuels. Urban mobility is one of these elements that can make a city vulnerable to fossil fuel crisis, depending on the type of transportation system and land use aspects (Cervero et al., 2009Cervero, R., Sarmiento, O. L., Jacoby, E., Gomez, L. F., & Neiman, A. (2009). Influences of built environments on walking and cycling: lessons from Bogotá. International Journal of Sustainable Transportation, 3(4), 203-226. http://dx.doi.org/10.1080/15568310802178314.
http://dx.doi.org/10.1080/15568310802178...
).
Energy plays an important role for the functioning of all sectors of a country, such as economy, transport, social development, military force, heating/cooling, food sector, and quality of life at large (Brito et al., 2012Brito, T. L. F., Santos, E. M., Chaigneau, I. M. C. R., & Nava, P. C. (2012). A Dialética da Segurança Energética e a Interdependência das Nações Reflexões focadas no papel do petróleo e na dimensão brasileira. In F. Monié, & J. Binsztok (Eds.), Geografia e geopolítica do petróleo. (pp. 15-51.). Rio de Janeiro: Mauad X.). In the twenty-first century, the concern with issues related to energy security is increasing, because of a possible future exhaustion of fossil fuel resources, geopolitical instability and natural disasters.
The purpose of this work is to confront the urban mobility system of Rio de Janeiro with a price increase of gasoline and oil-based public transportation. The methodology for this analysis is based on a conceptual framework and a model for the resilience of urban mobility.
Literature review to build a resilience of urban mobility concept
This section’s objective is to present the theoretical basis used to build the concept of resilience of urban mobility. For this reason, the reviewed concepts are: urban mobility; energy security (Winzer, 2012Winzer, C. (2012). Conceptualizing energy security. Energy Policy, 46, 36-48. http://dx.doi.org/10.1016/j.enpol.2012.02.067.
http://dx.doi.org/10.1016/j.enpol.2012.0...
); resilience (Folke et al., 2010Folke, C., Carpender, S. R., Walker, B., Scheffer, M., Chapin, T., & Rockström, J. (2010). Resilience thinking: integrating resilience, adaptability and transformability. Ecology and Society, 15(4), 20. http://dx.doi.org/10.5751/ES-03610-150420.
http://dx.doi.org/10.5751/ES-03610-15042...
); and human security (UN, 2009United Nations – UN. (2009). Human security in theory and practice. New York: United Nations. Retrieved in 2016 March 8, from http://www.tr.undp.org/content/dam/turkey/docs/news-from-new-horizons/issue-41/UNDP-TR-HSHandbook_2009.pdf.
http://www.tr.undp.org/content/dam/turke...
). Furthermore, a conceptualization of the resilience of urban mobility is proposed, based on the reviewed concepts.
Urban mobility
The presented framework of urban mobility (Figure 1) contributes with a sociological perspective of the issue, through the comprehension of production of urban space and the role of the society in the process of building a “meaning” to the urban mobility, which is – or is not – aligned with the interest of the user of the transport system and urban space.

Figure 1 presents the framework of urban mobility, from the perspective of a social group or individual, pointing out the elements which exert influence on this mobility. Under the logic of direct and indirect demand of Rodrigue et al. (2013)Rodrigue, J. P., Comtois, C., & Slack, B. (2013). The geography of transport systems. New York: Routledge. http://dx.doi.org/10.4324/9780203371183.
http://dx.doi.org/10.4324/9780203371183...
. This means that, for the implementation of a transportation system it is necessary to have demand for movement and energy to supply the system. Therefore, the urban mobility can be stimulated or obstructed by sociological factors (direct influence) and external factors (indirect influence). The external factors can be understood as the built environment, policies, geographical conditions, etc.
The comprehension of urban mobility is based on the urban space as an ecological unit, under the School of Chicago logic, however, locating the social issues in the center of the system (Castells, 2009Castells, M. (2009). A questão urbana. (4th ed.). São Paulo: Editora Paz e Terra S/A.). In addition to that, the urban space is a product of social interests and contradictions, which are spatially distributed in the city (Castells, 2009Castells, M. (2009). A questão urbana. (4th ed.). São Paulo: Editora Paz e Terra S/A.).
Table 1 refers to Figure 1, presenting the description of each element of direct influence. It is proposed in this paper to locate the elements of direct influence as the main representation of the resilience of urban mobility. These elements of direct influence are (Table 1): (1) socioeconomic conditions; (2) origin and destination; (3) social movements; (4) private transportation; (9) attitude/mobility options; (10) right to urban mobility; (11) attractiveness.
The elements of indirect influence are related to built environment, supply of services and opportunities of mobility, which are not necessarily planned and implemented by those who move in the city and “consume” this space (Rodrigue et al., 2013Rodrigue, J. P., Comtois, C., & Slack, B. (2013). The geography of transport systems. New York: Routledge. http://dx.doi.org/10.4324/9780203371183.
http://dx.doi.org/10.4324/9780203371183...
; Hanson & Giuliano, 2004Hanson, S., & Giuliano, G. (2004). The geography of urban transportation. New York: Guilford Press.). Furthermore, there are natural conditions, which are related to aspects, such as morphology of the land, climate, etc. (Rodrigue et al., 2013Rodrigue, J. P., Comtois, C., & Slack, B. (2013). The geography of transport systems. New York: Routledge. http://dx.doi.org/10.4324/9780203371183.
http://dx.doi.org/10.4324/9780203371183...
; Hanson & Giuliano, 2004Hanson, S., & Giuliano, G. (2004). The geography of urban transportation. New York: Guilford Press.)
Resilience, energy security and human security
The resilience concept of Folke et al. (2010)Folke, C., Carpender, S. R., Walker, B., Scheffer, M., Chapin, T., & Rockström, J. (2010). Resilience thinking: integrating resilience, adaptability and transformability. Ecology and Society, 15(4), 20. http://dx.doi.org/10.5751/ES-03610-150420.
http://dx.doi.org/10.5751/ES-03610-15042...
follows a socio-ecological approach. This concept shows that there can be different types of threats, which can influence the socio-ecological system that can vary from economic, social, cultural, environmental or political aspects. There are three categories within this system that may – or may not – be in practice.
Firstly, there is the persistence, which can be interpreted as the potential of a system to maintain current conditions of functionality, when exposed to an internal or external stress. Secondly, there is the factor of adaptability, which is not only linked with the potential of maintaining the system in the stability domain, but also learning, through the combination of experience, knowledge and opportunities, to avoid future instability. Thirdly, the factor of transformability, which is related to the creation of new stability domains, in order to avoid threats that could jeopardize a system in a past stability domain. (Folke et al., 2010Folke, C., Carpender, S. R., Walker, B., Scheffer, M., Chapin, T., & Rockström, J. (2010). Resilience thinking: integrating resilience, adaptability and transformability. Ecology and Society, 15(4), 20. http://dx.doi.org/10.5751/ES-03610-150420.
http://dx.doi.org/10.5751/ES-03610-15042...
)
Regarding the energy security concept, it is considered to be a broad concept, because it deals with risks, however “the number of threats that are caused by or have an impact on the energy supply chain is huge” (Winzer, 2012Winzer, C. (2012). Conceptualizing energy security. Energy Policy, 46, 36-48. http://dx.doi.org/10.1016/j.enpol.2012.02.067.
http://dx.doi.org/10.1016/j.enpol.2012.0...
, p. 37). There a significant complexity when dealing with energy security, presented on Winzer`s framework, from the origin of the threat to the sector or scale of impact of an energy crisis. For this reason, it may sound simple to understand how and where oil threats may generate impact. However it is complex to build a model, considering the complex production chain.
Concerning human security, this concept is appropriated to determine the levels of resilience of urban mobility, not the framework and concept itself. According to UNDP (1994United Nations Development Programme – UNDP. (1994). Human Development Report 1994. New York: Oxford University Press. Retrieved in 2015 September 7, from http://hdr.undp.org/sites/default/files/reports/255/hdr_1994_en_complete_nostats.pdf
http://hdr.undp.org/sites/default/files/...
, p. 22) human security “is a concern with human life and dignity”.
The human security concept involves seven dimensions (UNDP, 1994United Nations Development Programme – UNDP. (1994). Human Development Report 1994. New York: Oxford University Press. Retrieved in 2015 September 7, from http://hdr.undp.org/sites/default/files/reports/255/hdr_1994_en_complete_nostats.pdf
http://hdr.undp.org/sites/default/files/...
; OECD, 2004Organisation for Economic Co-operation and Development – OECD (2004). Security and Human Security: An Overview of Concepts and Initiatives. Paris: OECD. Retrieved in 2015 August 20, from http://www.oecd.org/swac/publications/38826090.pdf.
http://www.oecd.org/swac/publications/38...
; UN, 2009United Nations – UN. (2009). Human security in theory and practice. New York: United Nations. Retrieved in 2016 March 8, from http://www.tr.undp.org/content/dam/turkey/docs/news-from-new-horizons/issue-41/UNDP-TR-HSHandbook_2009.pdf.
http://www.tr.undp.org/content/dam/turke...
): economic security; food security; health security; environmental security; personal security; community security; and political security. The human security concept involves the empowerment of citizens, preparing them to face stresses.
Resilience of urban mobility
Within the logic of the resilience concept, the resilience of urban mobility is based firstly on the persistence factors, and it can aggregate the adaptability and transformability factors, which can be of direct and/or indirect influence.
Therefore, the concept of resilience of urban mobility is the ability of urban mobility to maintain current conditions of functionality and also maintain social-economic conditions (persistence), when direct and indirect elements are exposed to threats. Besides the ability to recover or maintain the functionality of the urban mobility to a stable domain (before the threat), it can involve a gathering of experience, knowledge and opportunities towards avoiding future threats (adaptability), and also develop a way, in which a new stable domain is created (new opportunities, through the transformability), in order to avoid being vulnerable to new threats. (Fernandes, 2017Fernandes, V. A. (2017). Resilience of urban mobility in the face of fossil fuel dependency: an empirical study of Rio de Janeiro (Dissertation). Universitätsbibliothek Tuebingen, Tuebingen. http://dx.doi.org/10.15496/publikation-17153
http://dx.doi.org/10.15496/publikation-1...
).
Resilience of urban mobility: methodological proposal
This section is dedicated to present a way to measure the resilience of urban mobility. Figure 2 presents the system of resilience of urban mobility with regard to fossil fuel dependency, which is illustrated as “threat” in the figure. This system is composed by three stages: persistence, adaptability and transformability.

In order to build an organized process of evaluation and analysis, this research follows a certain order of the presented system, beginning with the persistence stage, which is composed by the description of current conditions of mobility patterns, socio-economic conditions, matrix of expenditure, mobility options and expenditure with transportation.
Under a hypothetical threat, which can be an increase of fuel price or the depletion of fossil fuels, (a) new scenario(s) is (are) created. Under the new scenario(s), the goal is to evaluate how it can affect the aspects within current conditions, in terms of social expenditure and available options (opportunities) in order to maintain (or persist) mobility patterns, before the threat.
Table 2 presents the data used to achieve an adequate quantitative approach, which could be replicable.
This model is built from a conceptual approach of the production of urban space, based on intra-urban scale, in other words, the city itself. First step is to gather information on the transportation system and infrastructure of the case study. Included in this first step, is getting information on the price for each transportation mode, and understand how this price varies with distance travelled.
Second step is to gather data on the wage parameters in each district or neighborhood of the city, plus the gathering of an (approximate) expenditure matrix for each income level. The matrix of expenditure can be divided into four groups (a, b, c, d), which represent the expenses with different elements (Table3).
The third step is to get information related to the number of job positions in each district, considering all sectors, such as agrarian, commercial, industry and services. This attribute represents the level of centrality of the district, in other words, it will weigh the importance of one district in relation to the others of the city.
After collecting the information, it is possible to apply the proposed methodology. Initially, there is the order of importance of expenses, which can vary from one wage to another. However, for this paper, there is an order of importance in expenses based on the human security concept. Based on this perspective, the expenses on housing, food, clothing, education and health are the most important (Table3), because they are the basic needs of human beings. Therefore, they would be the last expenses to be sacrificed, in a crisis scenario.
Based on the notion that if only savings are affected, a person can maintain its living patterns, so savings are established as a less important expense. Through this conception, the savings would be the first expenses to be sacrificed in a crisis scenario. Therefore, leaving expenses with leisure and others as second at the level of importance, because when this expenditure is affected there can be a certain change regarding the quality of urban life.
At last, it is understood that expenses with mobility are obligatory, because the circulation of people within the city is a determining factor for the functioning of the city. However, this does not mean that it is the most important element, for example, one can have zero expenses on transportation, if the person lives in a certain condition.
The proposed level of resilience regards the order of importance on the expenses. When the expenses with transportation affect only the savings (c) there is a high level of resilience, when it affects leisure and others (b) there is a medium level of resilience and when it affects the basic needs (a) there is a low level of resilience.
Regarding the application of the method, firstly, one must calculate the expected and real costs, considering two scenarios, best and worst-case scenarios. These scenarios are based on the income parameters, which the best-case scenarios considers the highest income for each parameters and the worst case scenario the lowest income levels of each parameter. This process includes every citizen of a district in the analysis, and furthermore, it weights the results based on the income parameters that has more people within it.
The expected costs are based on a matrix of expenditure (equation 1-4), which for this paper was collected from the local government. Secondly, one must calculate the real cost of transportation (equation 5) based on the information of the transportation system of the city. Thirdly, one must calculate the real cost of the other expenditures based on the transportation real cost and the order of importance of group of expenses, applying the equation in the following order: equation 6-8. It is important to understand that, if the necessary condition to apply these equations (6-8) does not happen, this means that the expected cost is equal to real costs.
Where:
W1, 2, 3, …: Wage (US$) – in each parameter 1, 2, 3,…
a, b, c, d: monthly expenses (%)
Ea, Eb, Ec, Ed: expected monthly expenses (US$)
Where:
Rd: Real monthly expenses with transportation (US$)
Ed: Expected monthly expenses with transportation (US$)
PMij: Price of Transportation (any mode) to go from district i to j (US$)
Where:
Rc: Real monthly savings (US$)
Rd: Real monthly expenses with transportation (US$)
Ec: Expected monthly savings (US$)
Where:
Rc: Real monthly savings (US$)
Rb: Real monthly expenses with leisure and others (US$)
Eb: Expected monthly expenses with leisure and others (US$)
Where:
Rb: Real monthly expenses with leisure and others (US$)
Ra: Real monthly expenses with basic needs (US$)
Ea: Expected monthly expenses with basic needs (US$)
After calculating the expected and real costs from the city, it will be possible to measure and compare the resilience of one neighborhood to another. This process includes transforming the results in 1 (one) or 0 (zero). If the real cost value is lower than the expected cost, it will then make that expense 0 (zero), and if it is equal or higher than the expected cost, then that expense will be 1 (one). Table 4 is an example of how the output of the data will be. For each origin and destination, there can be different levels of resilience of urban mobility, based on the fact that if the summing of the results of a column is between 0 and 2 this would mean a high level of resilience, between 2 and 3 a medium level and between 3 and 4 a low level of resilience. This logic is based on the proposed order of importance of the expenses.
The last stage of the process is to calculate de resilience of each district in relation to the whole city. This part of the method is based on the first results, as shown in the example (Table 4) and the number of jobs available in each district in relation to the whole city.
Where:
Caij: Codification of the basic needs expenses in 1 or 0, in between the district i (origin) and j (destination)
Cbij: Codification of leisure and other expenses in 1 or 0, in between the district i (origin) and j (destination)
Ccij: Codification of savings in 1 or 0, in between the district i (origin) and j (destination)
Cdij: Codification of transportation expenses in 1 or 0, in between the district i (origin) and j (destination)
WJoj: level of job offers in the district of destination in relation to all other districts of the city based on the percentage of jobs for each district of the city (from 0 to 100)
Based on the example from Table 4 and equation 9, Table 5 shows an example of the output results of the resilience of urban mobility from a district of origin in relation to the entire city.
Naturally, for each district there is a possibility that they can contain a diversity of social groups with different wage conditions. It is proposed for this method to gather information of the quantity of people who are within different wage parameters. For each parameter, there will be a higher and lower income level, which can be referred, respectively, as optimistic (O) and pessimistic (P) scenarios. Table 5 shows the output of data, considering the wage parameters (W). After having this information, one should apply the weighted average based on how many from the sample are within each wage parameter.
Where:
RUMIij: Final result of the resilience of urban mobility index
W1,2,3,…: Percentage of the total sample within each range of wage (0 to 100)
RUMij: Resilience of urban mobility index for district i under the selected wage condition
Based on the examples from Table 6 and equation 10, table 6 shows an example of the results of the resilience of urban mobility considering the wage parameters (ranges).
As shown in the beginning of this section the resilience of urban mobility is divided in three stages, persistence, adaptability and transformability. Table 7 shows the stages of the resilience of urban mobility and the description of each.
The final resilience of urban mobility is generated by a summing of the levels of persistence, adaptability and transformability, and dividing this number by 12. Table 8 shows how the final results are represented in levels, based on the final resilience of urban mobility.
The quantitative method to evaluate the resilience of urban mobility is described through this section of the paper. This method is sensible to the transportation modes and socioeconomic condition in place.
Data for the case study of Rio de Janeiro
This section presents the data used to apply the model of the resilience of urban mobility in the city of Rio de Janeiro. For the adaptability stage of analysis, in this case study, it is considered a 100% price increase of gasoline, alcohol and oil-based public transportation, based on the 2015 transportation price. Figure 3 shows the transportation system considered for the case study (MobiRio, 2014MobiRio (2014). Armazem de dados. Rio de Janeiro: MobiRio. Retrieved in 2015 July 14, de http://www.poli.ufrj.br/noticias/noticias.php?numnews=683
http://www.poli.ufrj.br/noticias/noticia...
). It is possible to observe that the bus stops are widely distributed in the city, while metro, train and tram presents specific pathways that, mainly, the southwest and west part of the city do not have access.

- Transportation System of the City of Rio de Janeiro. Source: prepared by the authors – based on MobiRio (2014)MobiRio (2014). Armazem de dados. Rio de Janeiro: MobiRio. Retrieved in 2015 July 14, de http://www.poli.ufrj.br/noticias/noticias.php?numnews=683
http://www.poli.ufrj.br/noticias/noticia... .
Table 9 presents the transportation modes and fuel prices. For this case study, we consider the 2015 price values. Acknowledging that alcohol price, also increased the price in the last year, for this model the same price increase stablished for the gasoline are applied to alcohol, to evaluate the adaptability level. Besides this observation, the mixed use of transportation modes is more expensive than only using the bus or BRT system or combining two buses or BRTs. These data were collected in the website of the transportation companies of the city of Rio de Janeiro (MetroRio, Supervia, Rio Onibus).
Figure 4 shows the slope conditions for cycling. It is observed that the city of Rio de Janeiro does not present satisfactory slope conditions for long distance cycling trips. The slope data was collected from the Consortium for Spatial Information (Jarvis et al., 2008Jarvis, A., Reuter, H. I., Nelson, A., & Guevara, A. (2008). Hole-Filled SRTM for the Globe Version 4, 2008. CGIAR-CSI SRTM 90 m Database. Retrieved in 2015 July 15, from http://srtm.csi.cgiar.org
http://srtm.csi.cgiar.org...
)

- Slope conditions for cycling in the City of Rio de Janeiro. Source: Fernandes (2017)Fernandes, V. A. (2017). Resilience of urban mobility in the face of fossil fuel dependency: an empirical study of Rio de Janeiro (Dissertation). Universitätsbibliothek Tuebingen, Tuebingen. http://dx.doi.org/10.15496/publikation-17153
http://dx.doi.org/10.15496/publikation-1... .
Based on the average slope for cycling in each district, Figure 5 shows the districts with direct and bicycle accessibility to a train and metro stations. Direct accessibility means that the district has a station in the district and/or has bicycle accessibility to reach a train or metro station in a neighborhood district. For this case study, we consider an average cycling speed of 10 km/h and 15 minutes trip to a district with a train or metro station, leading to a 2.5 km trip.

- Access to Train and Metro Stations in the City of Rio de Janeiro. Source: prepared by the authors.
Table 10 presents the wage parameters applied in the case study. These parameters are based on the data bank of the Brazilian Institute of Geography and Statistics (IBGE, 2010Instituto Brasileiro de Geografia e Estatística – IBGE. (2010). Censo Demográfico 2010. Rio de Janeiro: IBGE.). This information is offered in the district scale, for this reason it is possible to know how many of the inhabitants of each districts are within each income range.
Table 11 presents the matrix of expenditure for each income level, based on Table 10. This data was collected from the Brazilian Institute of Geography and Statistics (IBGE, 2010Instituto Brasileiro de Geografia e Estatística – IBGE. (2010). Censo Demográfico 2010. Rio de Janeiro: IBGE.). This data is based on a national level census.
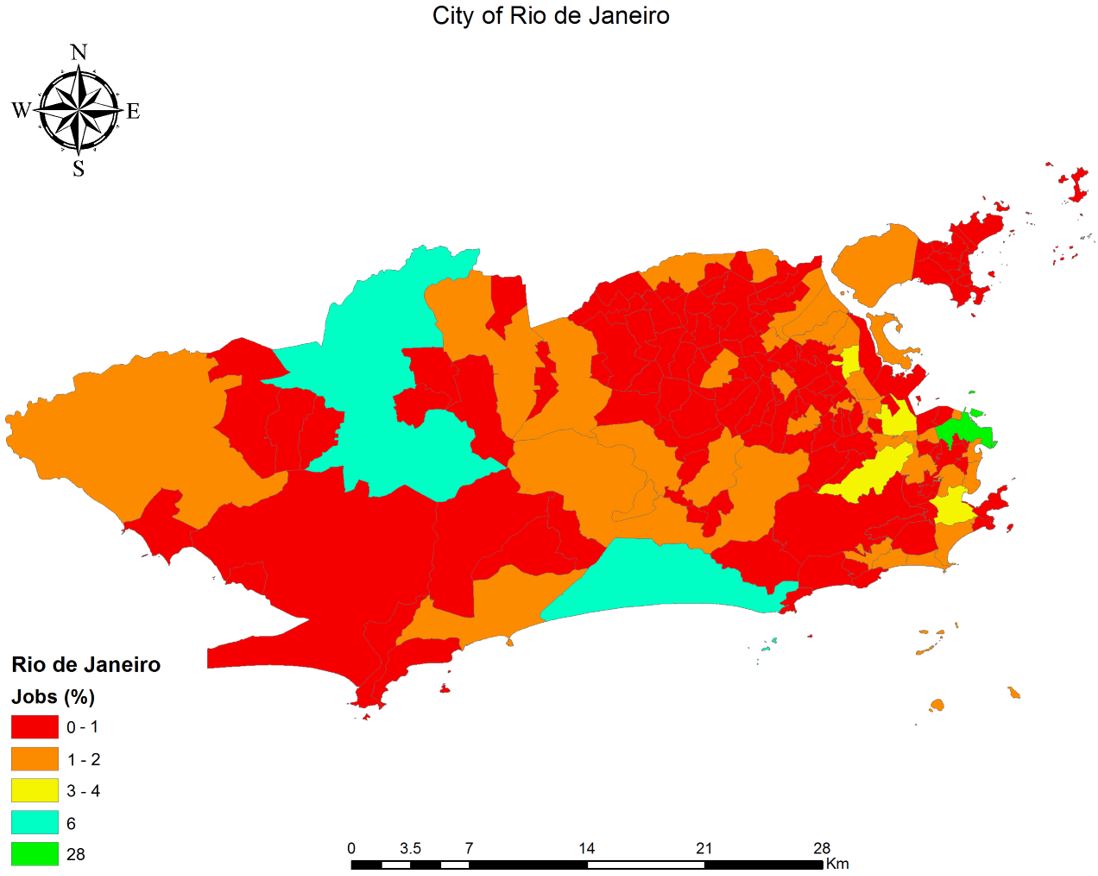
Figure 6 presents the percentage of job distribution in each district in relation to the entire city of Rio de Janeiro (Rio de Janeiro, 2014Rio de Janeiro (2014). Armazém de Dados. Rio de Janeiro: Von Instituto Pereira Passos (IPP). Retrieved in 2014 August 6, from http://www.armazemdedados.rio.rj.gov.br/
http://www.armazemdedados.rio.rj.gov.br/...
). This information was collected in the municipality data bank, and it involves all formal jobs of all economy sectors of the city. The district with 28% of job positions is the Centre of the city, commercial and financial, in other words, the Central Business District of the city. It is possible to observe that most of the job positions of the city are surrounding this district, in exception of the two districts with, approximately, 6% of the job positions.

- Percentage of Jobs in each District in relation to the entire City of Rio de Janeiro. Source: prepared by the authors - based on Prefeitura do Rio de Janeiro (2014)Rio de Janeiro (2014). Armazém de Dados. Rio de Janeiro: Von Instituto Pereira Passos (IPP). Retrieved in 2014 August 6, from http://www.armazemdedados.rio.rj.gov.br/
http://www.armazemdedados.rio.rj.gov.br/... .
Figure 7 addresses the spatial and temporal evolution of the main electric mobility projects in the city of Rio de Janeiro, in the last 20 years. This data was collected from the MobiRio research group, from the Federal University of Rio de Janeiro.

- Electric Mobility Projects in the Last 20 years. Source: prepared by the authors – based on MobiRio (2014)MobiRio (2014). Armazem de dados. Rio de Janeiro: MobiRio. Retrieved in 2015 July 14, de http://www.poli.ufrj.br/noticias/noticias.php?numnews=683
http://www.poli.ufrj.br/noticias/noticia... .
Results: final resilience of urban mobility of the city of Rio de Janeiro
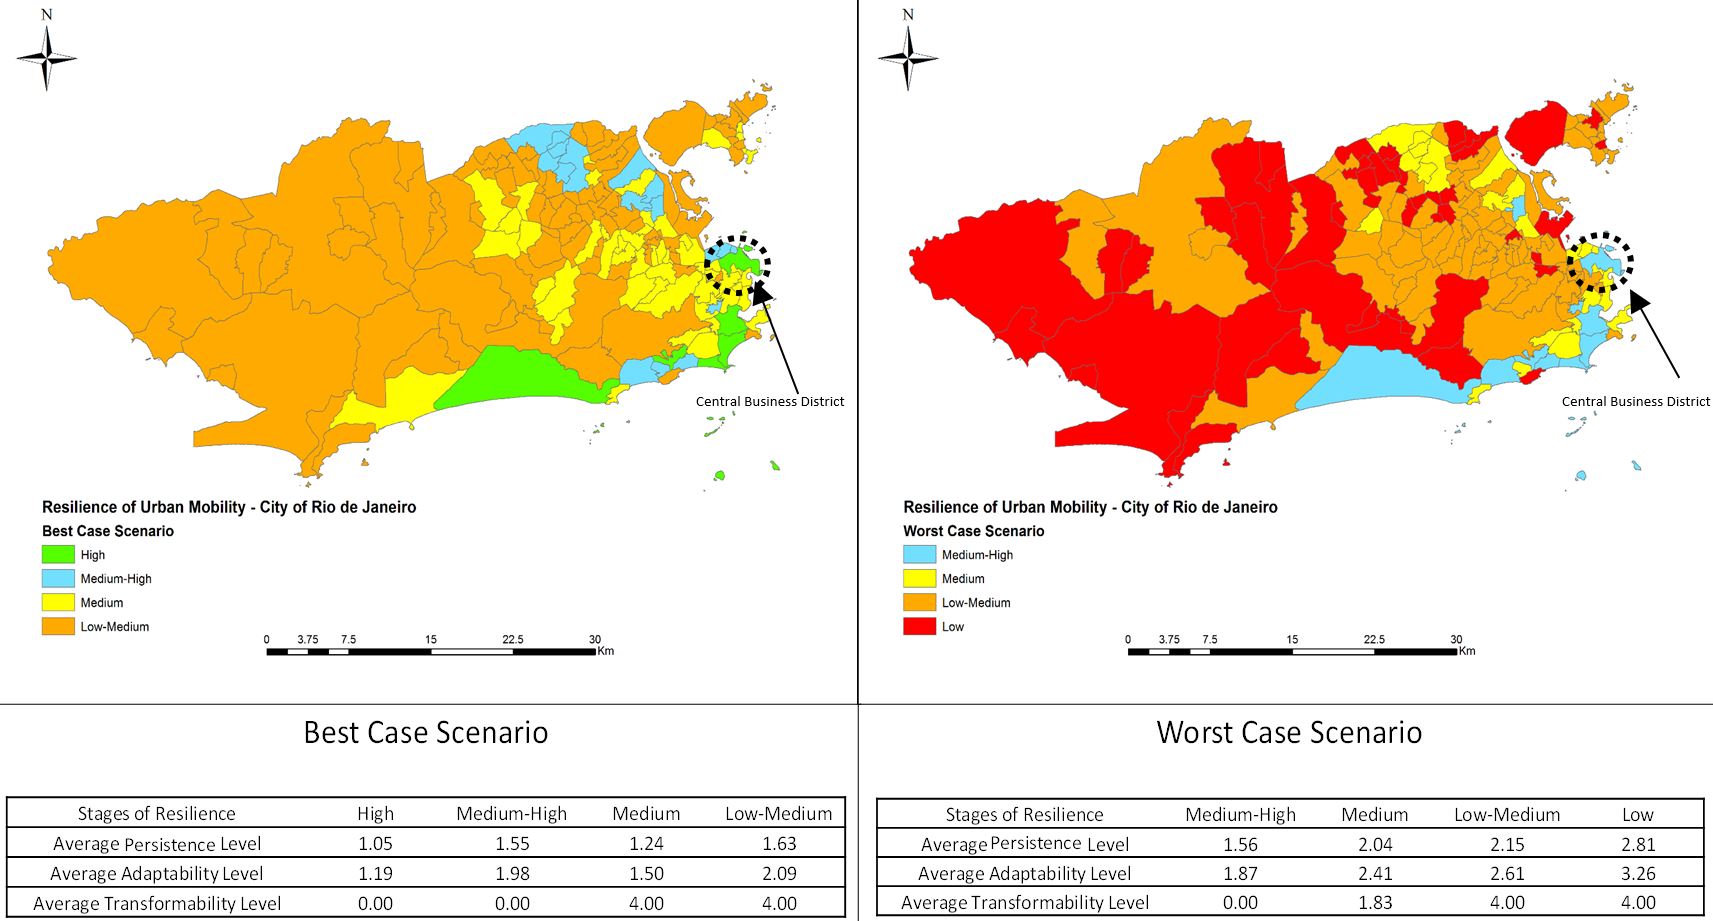
This section presents the final results of the applied case study. The final results are represented in a thematic map (Figure 8) and the results are correlated with variables that were used in the methodology, described in Table 12.

- Final Resilience of Urban Mobility of Rio de Janeiro – Best and Worst Case Scenario. Source: prepared by the authors.
Figure 8 is a geographical representation of the final resilience of urban mobility, adding the average levels of persistence, adaptability and transformability for the districts.
In regard to the best-case scenario results (figure 8), the persistence level is acceptable, with all average values under 2, which means that currently, in average, inhabitants from these districts are sacrificing transportation expected costs and expected savings. The average adaptability levels information shows that only the districts within the low-medium level has the value higher than 2, which means that in average the districts are sacrificing, expected transportation costs, savings and expected costs with leisure and others. In relation to the transformability levels, there are districts within medium and low-medium level of resilience that did not receive any electric transportation projects in the last 20 years, which means there is no efforts in creating new conditions to persist or adapt in the face of fossil fuel threats.
In relation to the worst case scenario results (figure 8), the average persistence values shows that within 3 levels of resilience, medium, low-medium and low, the inhabitants are sacrificing the income until the leisure and other costs, which means that inhabitants are working to maintain basic conditions, already based on current price of the transportation system. In the adaptability level, two of the levels of resilience, meidum and low-medium are sacrificing until leisure and other costs, while inhabitants of the districts within the low level of resilience in average are sacrificing the costs with basic needs, this means that these inhabintants would not be earning enough to cover at least basic living conditions. The average transformability values shows that the districts within the low-medium and low level of resilience did not receive any electric-based transportation projects in the last 20 years.
It is observed that the districts with high, medium-high or medium level of resilience are located near to the central business district of the city or located in the coastal area of the city, where the is a higher number of inhabitants that earns more than two minimum salaries per month. While the districts in the west side of the city have a higher number of people with low income level and dificulted access to electric-based transportation modes.
Table 13 and 14 adresses the characterization of the districts in each level of resilience of urban mobility, respectively, for the best- and worst-case scenario. The variables are based on the description presented on table 12, at the beginning of this section.
- Characterization of the districts within each level of resilience for the best-case scenario results
- Characterization of the districts within each level of resilience for the worst-case scenario results
Table 13 reveals that the the districts with high level of resilience of urban mobility composes the smallest number of districts, inhabitants and people with low income (less than two minimum salaries). Furthermore, there are 67% of districts with access to metro stations, 17% of districts with access to train stations, an average of 18.45 km to districts with job positions and 42% of the jobs of the city are located in these districts.
The districts within the medium-high level of resilience (table 13) are composed by 11% of the districts of the city, 10% of inhabitants, 12% of the population with low income and 8% of job positions. Moreover, 29% of the districts hass access to train and/or metro stations, 6% of the districts has bicycle access to train stations and the average distance to districts with job positions is 17.39 km.
The districts within the medium level of resilience of urban mobility (table 13) are composed by 32% of the city’s districts, 24% of inhabitants, 17% of the low income population and 23% of job positions. Furthermore, 29% of the districts within this resilience level has access to metro stations and 33% to train stations; 14% of the districts has bicycle access to metro stations and 10% to train stations; and the average distance to districts with job positions is 16.75 km.
The districts within the low-medium level of resilience (table 13) composes 54% of the districts, 59% of inhabitants, 67% of the population with low income and 27% of the city’s job positions. Beyond these informations, 9% of the districts has access to metro stations, 57% to train stations, 1% bicycle access to metro stations, 2% bicycle access to train stations and possesses a 23.13 km average distance to districts with job positions.
Table 14 reveals that the the districts with medium-high level of resilience of urban mobility composes the smallest number of districts, inhabitants and people with low income (less than two minimum salaries). Furthermore, there are 40% of districts with access to metro stations, 20% of districts with access to train stations, an average of 17.87 km to districts with job positions and 45% of the jobs of the city are located in these districts.
The districts within the medium level of resilience (table 14) are composed by 15% of the districts of the city, 12% of inhabitants, 13% of the population with low income and 10% of job positions. Moreover, 33% and 25% of the districts has, respectively, access to metro and train stations, 4% of the districts has bicycle access to metro stations, 8% to train stations, and the average distance to districts with job positions is 16.98 km.
The districts within the low-medium level of resilience of urban mobility (table 14) are composed by 51% of the city’s districts, 46% of inhabitants, 41% of the low income population and 35% of job positions. Furthermore, 21% of the districts within this resilience level has access to metro stations and 42% to train stations; 7% of the districts has bicycle access to metro stations and 7% to train stations; and the average distance to districts with job positions is 18.35 km.
The districts within the low-medium level of resilience (table 13) composes 28% of the districts, 33% of inhabitants, 42% of the population with low income and 11% of the city’s job positions. Beyond these informations, 7% of the districts has access to metro stations, 47% to train stations, 2% bicycle access to metro stations and possesses a 26.15 km average distance to districts with job positions.
As a final remark to this analysis, it is observed that for the districts in each level of resilience of urban mobility there are different combination of spatialized factors, such as transportation modes, social conditions and economic opportunities. The districts within the lowest resilience levels are in higher numbers, have larger part of the population and most of the low income inhabitants. Furthermore, there is less job positions in these districts and lower accessibility to the metro system, which is the transportation systems that leads to the districts with more job positions.
Although the urban train system is an electric-based transportation, its presence does not generate an acceptable resilience level. This transportation system is mainly accessible to citizens with less expenses with transportation costs, however, are mostly lower income population. The price of the urban train should be lower, to fit with the socioeconomic conditions of the major part of the population, or the income of this population should be higher, in order to fit with the transportation costs.
Another observation, is that, based on the districts with potential use of bicycle to reach a train or metro station and the existing cycleways, there is disparity. The districts that could most benefit from the bicycle use have less cycleways. A report from the municipal government of Rio de Janeiro admits that there is need to improve the connections of cycleways to BRT, train and metro stations (Rio de Janeiro, 2015Rio de Janeiro (2015). Desafio ÁGORA: Mobilidade Urbana. Rio de Janeiro: Prefeitura do Rio de Janeiro. https://drive.google.com/file/d/0B3K6Qc_wLQZsYlhma29zV2tvODA/view
https://drive.google.com/file/d/0B3K6Qc_...
). Furthermore, there is a need to decentralize job positions in the city, by encouraging the development of local economies.
In overall, it is possible to observe that there is a need for the city of Rio de Janeiro to bind transportation and urban planning. The socio-spatial characteristics of the city presents high inequality levels in terms of income, infrastructure, services and jobs. The challenge that lies ahead for the city of Rio de Janeiro, are related to building a city with less inequality regarding weaknesses identified in this paper. Furthermore, attending to sustainable goals, leading to fair social, economic and environmental conditions.
The city of Rio de Janeiro cannot be consider a resilient city, regarding to urban mobility, because there is a significant level of social and infrastructural inequality. In other words, the city of Rio de Janeiro, would not sustain a 100% price increase of gasoline or oil-based public transportation.
Conclusion
This paper proposes a concept and methodological approach to assess the resilience of urban mobility in the light of a possible fossil fuel crisis, with a case study applied to the city of Rio de Janeiro. The virtue of this methodology and the results presented are the possibility to evaluate the resilience of urban mobility, generating results that can support policy-making and urban and mobility planning. Cities tend to capitalize on agglomeration economies through the concentration of main offices, commercial areas, services and jobs in the Central Business District (CBD). However, there is a localization pattern of social groups, which generates an uneven distribution in terms of distance and accessibility to different transportation modes. Therefore, producing urban space with an uneven distribution of alternative mobility opportunities constitutes a threat to the resilience of the urban mobility system and hence to the respective urban citizens, if fossil fuel prices rise sharply.
To overcome the limitations of the proposed quantitative approach and in order to understand vulnerability of urban mobility in a more realistic context involving the soft factor of human decision-making, a qualitative research component should be added. This will allow to understand transport policies, attitudes and preferences of individuals and different social groups, the role of social movements and the claim for everyone’s right to urban mobility. This type of research requires an application of questionnaires, interviews, analysis of documents and reports.
Furthermore, only one case study was applied with a proposed methodology in the paper. It is proposed that further case studies should be done to test the applied methodology, aiming to increase the validity of this methodology to evaluate the resilience of urban mobility.
Beyond the need for further cases studies, it was observed that the scale of the city could be a significant obstacle for the research. This is because, e.g. in the case of Rio de Janeiro, a city with approximately six million inhabitants and with 1.255 km2, the complexity of urban life and social relations is quite high. In this case, the amount of data associated with such a study and variety of interrelated elements increase the difficulty of understanding reality as it is.
Acknowledgements
The authors are grateful for the Coordenação de Aperfeiçoamento de Pessoal de Nível Superior (Capes) for the full doctoral scholarship abroad for the main author and for the interest in the theme developed here.
-
How to cite: Fernandes, V. A., Rothfuss, R., Hochschild, V., Silva, M. A. V., Silva, W. R., Steiniger, S. & Santos, T. F. (2019). Urban resilience in the face of fossil fuel dependency: the case of Rio de Janeiro’s urban mobility. urbe. Revista Brasileira de Gestão Urbana, v. 11, e20180160. https://doi.org/10.1590/2175-3369.011.e20180160
References
- Brasil. Secretaria de Assuntos Estratégicos. (2012). Comissão para definição da classe média no Brasil Brasília: Governo Federal.
- Brito, T. L. F., Santos, E. M., Chaigneau, I. M. C. R., & Nava, P. C. (2012). A Dialética da Segurança Energética e a Interdependência das Nações Reflexões focadas no papel do petróleo e na dimensão brasileira. In F. Monié, & J. Binsztok (Eds.), Geografia e geopolítica do petróleo (pp. 15-51.). Rio de Janeiro: Mauad X.
- Castells, M. (1983). The city and the grass-roots: cross-cultural theory of urban social movements Berkeley: Univ. Calif. Press.
- Castells, M. (2009). A questão urbana (4th ed.). São Paulo: Editora Paz e Terra S/A.
- Cervero, R., Sarmiento, O. L., Jacoby, E., Gomez, L. F., & Neiman, A. (2009). Influences of built environments on walking and cycling: lessons from Bogotá. International Journal of Sustainable Transportation, 3(4), 203-226. http://dx.doi.org/10.1080/15568310802178314
» http://dx.doi.org/10.1080/15568310802178314 - Fernandes, V. A. (2017). Resilience of urban mobility in the face of fossil fuel dependency: an empirical study of Rio de Janeiro (Dissertation). Universitätsbibliothek Tuebingen, Tuebingen. http://dx.doi.org/10.15496/publikation-17153
» http://dx.doi.org/10.15496/publikation-17153 - Folke, C., Carpender, S. R., Walker, B., Scheffer, M., Chapin, T., & Rockström, J. (2010). Resilience thinking: integrating resilience, adaptability and transformability. Ecology and Society, 15(4), 20. http://dx.doi.org/10.5751/ES-03610-150420
» http://dx.doi.org/10.5751/ES-03610-150420 - Hanson, S., & Giuliano, G. (2004). The geography of urban transportation New York: Guilford Press.
- Harvey, D. (2008). The Right to the City. New Left Review, 53, 23-40. http://newleftreview.org/II/53/david-harvey-the-right-to-the-city
» http://newleftreview.org/II/53/david-harvey-the-right-to-the-city - Instituto Brasileiro de Geografia e Estatística – IBGE. (2010). Censo Demográfico 2010 Rio de Janeiro: IBGE.
- Jarvis, A., Reuter, H. I., Nelson, A., & Guevara, A. (2008). Hole-Filled SRTM for the Globe Version 4, 2008. CGIAR-CSI SRTM 90 m Database Retrieved in 2015 July 15, from http://srtm.csi.cgiar.org
» http://srtm.csi.cgiar.org - Krumdieck, S., Page, S., & Dantas, A. (2010). Urban form and long-term fuel supply decline: A method to investigate the peak oil risks to essential activities. Transportation Research Part A, Policy and Practice, 44(5), 306-322. http://dx.doi.org/10.1016/j.tra.2010.02.002
» http://dx.doi.org/10.1016/j.tra.2010.02.002 - Lovelace, R., & Philips, I. (2014). The ‘oil vulnerability’of commuter patterns: A case study from Yorkshire and the Humber, UK. Geoforum, 51, 169-182. http://dx.doi.org/10.1016/j.geoforum.2013.11.005
» http://dx.doi.org/10.1016/j.geoforum.2013.11.005 - MobiRio (2014). Armazem de dados Rio de Janeiro: MobiRio. Retrieved in 2015 July 14, de http://www.poli.ufrj.br/noticias/noticias.php?numnews=683
» http://www.poli.ufrj.br/noticias/noticias.php?numnews=683 - Mogridge, M. J. H. (1978). The effect of oil crisis on the growth in the ownership and use of cars. Transportation, 7(1), 45-67. http://dx.doi.org/10.1007/BF00148371
» http://dx.doi.org/10.1007/BF00148371 - Organisation for Economic Co-operation and Development – OECD (2004). Security and Human Security: An Overview of Concepts and Initiatives. Paris: OECD. Retrieved in 2015 August 20, from http://www.oecd.org/swac/publications/38826090.pdf
» http://www.oecd.org/swac/publications/38826090.pdf - Parish, D. (2009). The 1973 – 1975 Energy Crisis and Its Impact on Transport. London: Royal Automobile Club Foundation for Motoring. Retrieved in 2014 June 13, from http://www.racfoundation.org/assets/rac_foundation/content/downloadables/energy%20crisis%20-%20parish%20-%20161009%20-%20report.pdf
» http://www.racfoundation.org/assets/rac_foundation/content/downloadables/energy%20crisis%20-%20parish%20-%20161009%20-%20report.pdf - Rio de Janeiro (2014). Armazém de Dados Rio de Janeiro: Von Instituto Pereira Passos (IPP). Retrieved in 2014 August 6, from http://www.armazemdedados.rio.rj.gov.br/
» http://www.armazemdedados.rio.rj.gov.br/ - Rio de Janeiro (2015). Desafio ÁGORA: Mobilidade Urbana Rio de Janeiro: Prefeitura do Rio de Janeiro. https://drive.google.com/file/d/0B3K6Qc_wLQZsYlhma29zV2tvODA/view
» https://drive.google.com/file/d/0B3K6Qc_wLQZsYlhma29zV2tvODA/view - Rodrigue, J. P., Comtois, C., & Slack, B. (2013). The geography of transport systems. New York: Routledge. http://dx.doi.org/10.4324/9780203371183
» http://dx.doi.org/10.4324/9780203371183 - United Nations Development Programme – UNDP. (1994). Human Development Report 1994 New York: Oxford University Press. Retrieved in 2015 September 7, from http://hdr.undp.org/sites/default/files/reports/255/hdr_1994_en_complete_nostats.pdf
» http://hdr.undp.org/sites/default/files/reports/255/hdr_1994_en_complete_nostats.pdf - United Nations – UN. (2009). Human security in theory and practice New York: United Nations. Retrieved in 2016 March 8, from http://www.tr.undp.org/content/dam/turkey/docs/news-from-new-horizons/issue-41/UNDP-TR-HSHandbook_2009.pdf
» http://www.tr.undp.org/content/dam/turkey/docs/news-from-new-horizons/issue-41/UNDP-TR-HSHandbook_2009.pdf - Vasconcellos, E. A. (2014). Urban Transport Environment and Equity: The case for developing countries (1st ed.). London: Routledge. http://dx.doi.org/10.4324/9781315071756
» http://dx.doi.org/10.4324/9781315071756 - Winzer, C. (2012). Conceptualizing energy security. Energy Policy, 46, 36-48. http://dx.doi.org/10.1016/j.enpol.2012.02.067
» http://dx.doi.org/10.1016/j.enpol.2012.02.067 - World Bank. (2015a). Urban population (% of total). Washington: World Bank. Retrieved in 2015 January 12, de http://data.worldbank.org/indicator/SP.URB.TOTL.IN.ZS
» http://data.worldbank.org/indicator/SP.URB.TOTL.IN.ZS - World Bank. (2015b). Fossil fuel energy consumption (% of total) Washington: World Bank. Retrieved in 2015 January 12, de http://data.worldbank.org/indicator/EG.USE.COMM.FO.ZS
» http://data.worldbank.org/indicator/EG.USE.COMM.FO.ZS
Edited by
Publication Dates
-
Publication in this collection
03 Oct 2019 -
Date of issue
2019
History
-
Received
31 Aug 2018 -
Accepted
20 Feb 2019