Abstract
The longitudinal, flexural, and torsional modes of acoustical resonances are presented for a long and small thickness cylindrical fiber spool. The fiber spool is built using a monomode optical fiber tightly wound in a helix form around a cylindrical Styropor. The acoustical resonance values are obtained using a Mach Zehnder interferometer with the fiber spool in the long (2 km) arm and a small linewidth laser. To reduce spurious signals, the interferometer was placed inside a vacuum chamber. The measured and theoretical results reasonably agree up to the first fifteen resonant longitudinal modes and for the first five flexural and torsional resonant modes, with a span from 10 Hz up to 200 Hz.
Index Terms
Acoustical resonances; Donnel-Mushtari Theory; Mach Zehnder interferometer; optical fiber spool
I.INTRODUCTION
Low phase-noise lasers [1[1] S. Gundavarapu, G. M. Brodnik, M. Puckett, et al., “Sub-hertz fundamental linewidth photonic integrated Brillouin laser,” Nature Photonics, vol. 13, pp. 60–67, 2019. [doi:10.1038/s41566-018-0313-2].
https://doi.org/10.1038/s41566-018-0313-...
]-[4[4] T. Kessler, C. Hagemann, C. Grebing, et al., “A sub-40-mHz-linewidth laser based on a silicon single-crystal optical cavity,” Nature Photonics, vol. 6, no.10, pp. 687 – 692, 2012. [doi: 10.1038/NPHOTON.2012.217].
https://doi.org/10.1038/NPHOTON.2012.217...
] have relevant applications in optical fiber communications [5[5] H. Al-Taiy, N. Wenzel, S. Preussler, et al., “Ultra-narrow linewidth, stable and tunable laser source for optical communication systems and spectroscopy,” Optics Letters, vol. 39, no. 20,pp. 5826-5829, 2014.[doi: 10.1364/OL.39.005826].
https://doi.org/10.1364/OL.39.005826...
], temperature and pressure sensing [6[6] R. C. Kamikawachi, I. Abe, H. J. Kalinowski, J.L. Fabris, J.F. Pinto, “Nonlinear temperature dependence of etched fiber Bragg gratings,” IEEE Sensors Journal, vol. 7, no. 8, pp. 1358-1359, 2007. [doi: 10.1109/JSEN.2007.905032]
https://doi.org/10.1109/JSEN.2007.905032...
], medical ultrasound devices [7[7] P. F. Nascimento, A. P. G. O. Franco, R. Fiorin, M. A. de Souza, H. J. Kalinowski, and I. Abe, “Case Study of Muscle Fatigue in Parafunctional Patient using Occlusal Device with Fiber Bragg Grating Sensors,” J. Microw. Optoelectron. (JMOe), vol. 17, no. 2, pp. 306-318, 2018. [doi: 10.1590/2179-10742018v17i21293]
https://doi.org/10.1590/2179-10742018v17...
], [8[8] I. Abe, M.S. Milczewski, M.A. Souza, H.J. Kalinowski, O.F. Machuca, G.C. Marin, and E.S. Camargo, “The force magnitude of a human bite measured at the molar intercuspidation using fiber Bragg gratings”, J. Microw. Optoelectron. (JMOe), vol. 16, pp. 434-444, 2017. [doi: 10.1590/2179-10742017v16i2808]
https://doi.org/10.1590/2179-10742017v16...
], temperature monitoring [9[9] M.S. P. Silva, H. P. Alves. J. F. Nascimento, and J. F. Martins-Filho, “Impact of Pulse Width on the Sensitivity and Range of a Raman-based Distributed Fiber-optic Temperature Sensor,” J. Microw. Optoelectron. (JMOe), vol. 17, no. 4, pp- 539-551, December 2018. [doi: 10.1590/2179-10742018v17i41542]
https://doi.org/10.1590/2179-10742018v17...
,10[10] R. C. Leite, V. Dmitriev, C. Hudon, S. Gingras, J. Piccard, L. Mydlarsky, and C. Guddemi, “Analysis Of Thermo-Mechanical Stress In Fiber Bragg Grating Used For Generator Rotor Temperature Monitoring,” J. Microw. Optoelectron. (JMOe), vol. 16, no. 2, pp. 445-459, 2017. [doi: 10.1590/2179-10742017v16i2818]
https://doi.org/10.1590/2179-10742017v16...
], wide-band fiber optic systems [11[11] G. D. de Andrade, H. R. de O. Rocha, M. E. V. Segatto, M. J. Pontes, and C. E. S. Castellani, “ Study and Optimization of Raman Amplifiers in Tellurite-Based Optical Fibers for Wide-Band Telecommunication Systems”, J. Microw. Optoelectron. (JMOe), vol.18, no. 2, pp. 219-226, 2019. [10.1590/2179-10742019v18i21558].
https://doi.org/10.1590/2179-10742019v18...
], monitoring of power grids [12[12] Q. Chai, Y. Luo, J. Ren, J. Zhang, J. Yang, L. Yuan, G. Peng, “Review on fiber-optic sensing in health monitoring of power grids,” Optical Engineering vol. 58, no. 7, pp. 072007, 2019. [doi: 10.1117/1.OE.58.7.072007].
https://doi.org/10.1117/1.OE.58.7.072007...
], fiber optic interferometric sensors [13[13] L. B. Scandian, M. E. V. Segatto, C. E. S. Castellani, “Analytical Analysis and Experimental Validation of a Multi-parameter Mach-Zehnder Fiber Optic Interferometric Sensor”, J. Microw. Optoelectron. (JMOe), vol. 17, no. 4, pp- 528-538, December 2018. [doi: 10.1590/2179-10742018v17i41540]
https://doi.org/10.1590/2179-10742018v17...
], low-phase-noise photonic oscillator fiber sensors [1[1] S. Gundavarapu, G. M. Brodnik, M. Puckett, et al., “Sub-hertz fundamental linewidth photonic integrated Brillouin laser,” Nature Photonics, vol. 13, pp. 60–67, 2019. [doi:10.1038/s41566-018-0313-2].
https://doi.org/10.1038/s41566-018-0313-...
], and fiber acoustic sensors[14[14] G. B. Hocker, “Fiber optic acoustic sensors with composite structure: an analysis,” Appl. Opt., vol.18, pp. 3679–3683, 1979. [doi:10.1364/AO.18.003679].
https://doi.org/10.1364/AO.18.003679...
]-[17[17] P. Chang, L. Huang, X. Song, et al., “Acoustic Wave Induced Mach-Zehnder Interferometer Based on a Sandwich-Structured Single Mode Fiber,” in 2016 Conference on Lasers and Electro-Optics (CLEO), 1–2, 2016. [doi:10.1364/CLEOAT.2016.JTu5A.88].
https://doi.org/10.1364/CLEOAT.2016.JTu5...
]. Also, laser noise reduction can be obtained using the filtering action of high-quality optical cavities [4[4] T. Kessler, C. Hagemann, C. Grebing, et al., “A sub-40-mHz-linewidth laser based on a silicon single-crystal optical cavity,” Nature Photonics, vol. 6, no.10, pp. 687 – 692, 2012. [doi: 10.1038/NPHOTON.2012.217].
https://doi.org/10.1038/NPHOTON.2012.217...
], integrated phase noise filters [18[18] M. Idjadi and F. Aflatouni, “Nanophotonic phase noise filter in silicon,” Nature Photonics, vol.14, pp. 234-239, 2020. [doi: 10.1038/s41566-020-0605-1]
https://doi.org/10.1038/s41566-020-0605-...
], or actively stabilized optical delay lines [19[19] D. Li, Q. Cheng, Y. Li, et al., “Efficient laser noise reduction method via actively stabilized optical delay line,” Optics Express vol. 25, pp. 9071-9077, 2017. [doi: 10.1364/OE.25.009071].
https://doi.org/10.1364/OE.25.009071...
]. Those applications require the evaluation of the laser parameters such as Lorentzian linewidth [20[20] L. Kazovsky, “Performance analysis and laser linewidth requirements for optical PSK heterodyne communications systems,” Journal of Lightwave Technology vol. 4, pp. 415–425, 1986. [doi:10.1109/JLT.1986.1074727].
https://doi.org/10.1109/JLT.1986.1074727...
]-[21[21] C. Henry, “Phase noise in semiconductor lasers,” Journal of Lightwave Technology, vol. 4, pp. 298–311, 1986. [doi:10.1109/JLT.1986.1074721].
https://doi.org/10.1109/JLT.1986.1074721...
], and several techniques have been developed for linewidth measurements [22[22] T. Okoshi, K. Kikuchi, and A. Nakayama, “Novel method for high resolution measurement of laser output spectrum,” Electronics Letters, vol. 16, pp. 630–631, 1980. [doi:10.1049/el:19800437].
https://doi.org/10.1049/el:19800437...
], comprising: delayed self-heterodyne [23[23] K. Kikuchi and T. Okoshi, “Dependence of semiconductor laser linewidth on measurement time: evidence of predominance of 1/f noise,” Electronics Letters, vol. 21, pp. 1011–1012, 1985. [doi:10.1049/el:19850717].
https://doi.org/10.1049/el:19850717...
]-[24[24] L. B.Mercer, “1/f frequency noise effects on self-heterodyne linewidth measurements,” Journal of Lightwave Technology vol. 9, pp. 485–493, 1991. [doi:10.1109/50.76663].
https://doi.org/10.1109/50.76663...
]; self-homodyne detection with short delay Mach-Zehnder interferometer (MZI) [25[25] H. Ludvigsen, M. Tossavainen, and M. Kaivola, “Laser linewidth measurements using self-homodyne detection with short delay,” Optics Communications, vol. 155, no. 1, pp. 180–186, 1998. [doi:10.1016/S0030-4018(98)00355-1].
https://doi.org/10.1016/S0030-4018(98)00...
]; Brillouin induced self-heterodyne [26[26] P. Sevillano, J. Subas, C. Heras, et al., “Brillouin induced self-heterodyne technique for narrow line width measurement,” Opt. Express, vol. 21, no. 11, pp. 15201–15207, 2010. [doi:10.1364/OE.18.015201].
https://doi.org/10.1364/OE.18.015201...
]; strong coherent envelope [27[27] S. Huang, T. Zhu, M. Liu, et al., “Precise measurement of ultra-narrow laser linewidths using the strong coherent envelope,” Nature Scientific Reports vol. 07, 2017. [doi:10.1038/srep41988].
https://doi.org/10.1038/srep41988...
]; and heterodyne offline digital signal processing [28[28] T. Sutili, R. C. Figueiredo, and E. Conforti, “Laser linewidth and phase noise evaluation using heterodyne offline signal processing,” Journal of Lightwave Technology vol. 34, pp. 4933–4940, 2016. [doi:10.1109/JLT.2016.2597217].
https://doi.org/10.1109/JLT.2016.2597217...
]-[29[29] E. Conforti and T. Sutili, “Offline measurements of photonic devices,” in 2017 SBMO/IEEE MTT-S International Microwave and Optoelectronics Conference (IMOC), 1–5, 2017. [doi:10.1109/IMOC.2017.8121156].
https://doi.org/10.1109/IMOC.2017.812115...
]. The use of the self-homodyne fiber MZI has the advantage of using only one laser with no distinct local oscillator, and the authors employed this technique to analyze narrow linewidth lasers [30[30] F. J. Galdieri, T. Sutili, N. Melnikoff, A. C. Bordonalli, and E. Conforti, “Influence of exterior acoustic noise on narrow linewidth laser measurements using self-homodyne optical fiber interferometer,” Optik, 204, 164101, 2020. [doi:10.1016/j.ijleo.2019.164101].
https://doi.org/10.1016/j.ijleo.2019.164...
].
However, in the above applications concerning small linewidth lasers, the optical fiber spool (OFS) acoustical induced resonance effects may degrade the detected signals due to possible false positive signals or low signal to noise ratio (SNR). Indeed, OFS detectors based on fiber optic pressure-induced refractive index changes [31[31] J. Staudenraus andW. Eisenmenger, “Fibre-optic probe hydrophone for ultrasonic and shock wave measurements in water,” Ultrasonics vol. 31, no. 4, pp. 267 – 273, 1993. [doi:10.1016/0041-624X(93)90020-Z].
https://doi.org/10.1016/0041-624X(93)900...
]-[32[32] H. L. W. Chan and K. S. Chiang, “Optical fiber ultrasonic sensors,” Ultrasonic Exposimetry, pp. 283–314, 1993.] are used for high sensitivity hydrophones [31[31] J. Staudenraus andW. Eisenmenger, “Fibre-optic probe hydrophone for ultrasonic and shock wave measurements in water,” Ultrasonics vol. 31, no. 4, pp. 267 – 273, 1993. [doi:10.1016/0041-624X(93)90020-Z].
https://doi.org/10.1016/0041-624X(93)900...
]. In those applications, the fiber provides immunity to electromagnetic interference, including 3D shaped compact sensor design [33[33] C. Lan, W. Zhou, and Y. Xie, “Detection of ultrasonic stress waves in structures using 3D shaped optic fiber based on a MachZehnder interferometer,” Sensors, vol. 18, no. 4, 2018. [doi:10.3390/s18041218].
https://doi.org/10.3390/s18041218...
], where a thin OFS is formed when a fiber is wrapped around a hollow cylinder. Nevertheless, the resonance effects of the OFS detector may also generate false positive signals in those applications. Additionally, OFS-MZI based self-homodyne (or self-heterodyne) linewidth measurements can be influenced by acoustical induced optical noises [30[30] F. J. Galdieri, T. Sutili, N. Melnikoff, A. C. Bordonalli, and E. Conforti, “Influence of exterior acoustic noise on narrow linewidth laser measurements using self-homodyne optical fiber interferometer,” Optik, 204, 164101, 2020. [doi:10.1016/j.ijleo.2019.164101].
https://doi.org/10.1016/j.ijleo.2019.164...
]. As a result, the OFS acoustical effects characterization is of practical interest on fiber optic sensors design and in small laser linewidth characterizations based on MZI self-homodyne measurements. This paper introduces a technique to characterize OFS acoustical induced frequencies from 10 up to 200 Hz and beyond. The technique is based on an MZI employing a long arm OFS (2 km) and a small linewidth laser signal. The acoustical effects are analyzed using the OFS natural resonances. The measurement errors are evaluated by comparing theory and experiment using the longitudinal, flexural, and torsional modes of the OFS resonances.
A vacuum environment was employed to increase the signal to noise ratio, since the OFS-MZI is sensitive to external acoustical noises. Section II presents a brief description of fiber spool cylindrical acoustic modeling with analytical equations and theoretical results. Section III shows the experimental setup employed with a description of the device parameters. The experimental results of the optical induced acoustical OFS resonances are presented in Section IV. The comparison and discussion of experimental and theoretical results, including Finite Elements simulation software are presented in Section V.
II. Theory of Acoustic Fiber Reel Natural Resonances
The free resonance of finite length and thin circular cylindrical shells has been studied through one and half century [34[34] M. S. Qatu, “Recent research advances in the dynamic behavior of shells: 19892000,” Applied Mechanics Reviews 55, pp. 415–434, 2002. [doi:10.1115/1.1483078].
https://doi.org/10.1115/1.1483078...
]. Exact solutions are complex [35[35] A. W. Leissa, Vibration of Shells, ch. 1, pp. 31–184. Report NASA SP-288, 1973.], and W. Flügge introduced solutions for a few of the simplest types of shells [36[36] W. Flügge, Bending of Circular Cylindrical Shells, 204–316. Springer Berlin Heidelberg, Berlin, Heidelberg, 1973. [doi:10.1007/978-3-642-88291-35].
https://doi.org/10.1007/978-3-642-88291-...
]. The exact solution was available [37[37] K. Forsberg, “Influence of boundary conditions on the modal characteristics of thin cylindrical shells,” AIAA Journal vol. 2, no. 12, pp. 2150–2157, 1964. [doi:10.2514/3.55115].
https://doi.org/10.2514/3.55115...
], but complex calculations are required [35[35] A. W. Leissa, Vibration of Shells, ch. 1, pp. 31–184. Report NASA SP-288, 1973.]. Donnel [38[38] L. H. Donnell, Stability of thin-walled tubes under torsion, Ch. 1, 1–22. Report NACA 479, 1935.] followed by Mushtari and Vlasov presented a simplified theory for quasi-shallow shells called Donnel-Mushtari-Vlasov (DMV) Theory [39[39] F. I. N. (editor), “Chapter 15 – The donnell-mushtari-vlasov theory,” in Shell Theory, North-Holland Series in Applied Mathematics and Mechanics, vol. 29, pp.353–362, North-Holland, 1985. [doi:10.1016/B978-0-444-87640-9.50021-6].
https://doi.org/10.1016/B978-0-444-87640...
], suitable for transversely loaded thin isotropic elastic shell of uniform thickness. An analytical and closed solution for open isotropic circular cylindrical shells has also been obtained [40[40] Y. Xing, B. Liu, and T. Xu, “Exact solutions for free vibration of circular cylindrical shells with classical boundary conditions,” International Journal of Mechanical Sciences, vol. 75, pp. 178–188, 2013. [doi:10.1016 /j.ijmecsci.2013.06.005].
https://doi.org/10.1016/j.ijmecsci.2013....
], [41[41] Y. Xing, T. Xu, and B. Liu, “Recent research advances of exact solutions for free vibrations of plates and shells,” in 11th International Conference on Vibration Problems, Z. Dimitrová et al. Eds. Lisbon Portugal, 1–10, 2013. [https://icoev.org/proceedings2013/231_paper0.pdf]
https://icoev.org/proceedings2013/231_pa...
]. Furthermore, filled cylindrical shells have been analyzed [42[42] MSC Nastran, Patran – Finite Element Analysis and Solver, MSC Software.]-[44[44] H. T. Banks and R. Smith, “Modeling of the structural acoustic coupling inside a thin cylindrical shell,” Proceedings of SPIE - The International Society for Optical Engineering, 1993. [doi: 10.1117/12.148400].
https://doi.org/10.1117/12.148400...
]. We use here the DMV equations [35[35] A. W. Leissa, Vibration of Shells, ch. 1, pp. 31–184. Report NASA SP-288, 1973.], [41[41] Y. Xing, T. Xu, and B. Liu, “Recent research advances of exact solutions for free vibrations of plates and shells,” in 11th International Conference on Vibration Problems, Z. Dimitrová et al. Eds. Lisbon Portugal, 1–10, 2013. [https://icoev.org/proceedings2013/231_paper0.pdf]
https://icoev.org/proceedings2013/231_pa...
], where the orthogonal displacements in the x direction (ux), y direction (uy), and z direction (uz) are shown in the thin shell of Fig. 1 representing an OFS.

Fiber spool cylindrical modeling were R is the radius, L is the length, and h is the cylinder thickness.
The approximate solution with independent variables assumes harmonics displacements u, resulting in the following equation [35[35] A. W. Leissa, Vibration of Shells, ch. 1, pp. 31–184. Report NASA SP-288, 1973.], where the longitudinal displacement ux in the direction x refers to the amplitude A, and so on:
where k = [h2 / (12 R 2)], h is the shell thickness, and R is the cylinder radius. Also, in the above equation, the angular frequency parameter Ω is defined as [35[35] A. W. Leissa, Vibration of Shells, ch. 1, pp. 31–184. Report NASA SP-288, 1973.]:
where ρ is the fiber shell density, ν is the Poisson ratio, and E is the Young’s modulus. In addition, the parameter λ = π R/ L is defined, where the cylinder length L corresponds to the half wavelength in the longitudinal direction x. The solution of Eq. (1) requires that the matrix determinant must be zero. In this way, the free wavelength angular frequency ω can be calculated for a given λ. For an extremely long and small-thickness cylinder, the length L >> 0, the half wavelength tends to infinity and λ tends to zero. So, Eq. (1) is reduced to:
The solution of Eq. (3) requires the upper first element of the matrix to be zero. Physically, this represents a purely axial displacement vibration of the OFS in the x longitudinal direction. These OFS resonances vibrations are called the axial or longitudinal movement modes (LMM) of resonance, and are expressed as:
The roots of the second order determinant of Eq. 3 give the flexural and torsional modes (FTM), also called radial and circumferential modes, of the OFS resonance. They are given by [35[35] A. W. Leissa, Vibration of Shells, ch. 1, pp. 31–184. Report NASA SP-288, 1973.]:
In this experiment, an external acoustic pressure signal is incident on the OFS to induce resonance vibrations. The fiber is wounded over a Styropor ® solid cylinder. The solid Styropor has 0.15 m radius, 0.6 m height, elasticity modulus of YS = 107 Pa, and a density ρS ≈ 40 kg/m3. Otherwise, the monomode OFS is made as a thin cylinder with dimensions: L = 0.4 m height, R = 0.15 m radius, and h = 10−3 m thickness, as shown in Fig. 1. The SiO2 optical fiber Young’s modulus is EFO = 7.3 x 10¹⁰ Pa, and its density is ρFO ≈ 2.2 × 10³ kg/m3. Also, the Poisson ratio is ν = 0.17.
Using the above equations and parameters, the OFS (with small thickness) free resonance frequencies (f = ω/2π) can be calculated. Using Eq. 4, the results for LMM can be calculated. The FTM can be calculated using (5). The mode n=0 is called breathe; n = 1, dipole; n = 2, quadrupole bell; n = 4, octupole. Complete results up to 200 Hz will be presented at Table I.
The thin crust Love-Timoshenko Theory [35[35] A. W. Leissa, Vibration of Shells, ch. 1, pp. 31–184. Report NASA SP-288, 1973.] gives the following equation for the FTM resonances:
The Styropor cylinder influence was not considered on the above analysis. The comparison of theoretical values with the experiments are examined in the following Sections.
III. Experimental Setup
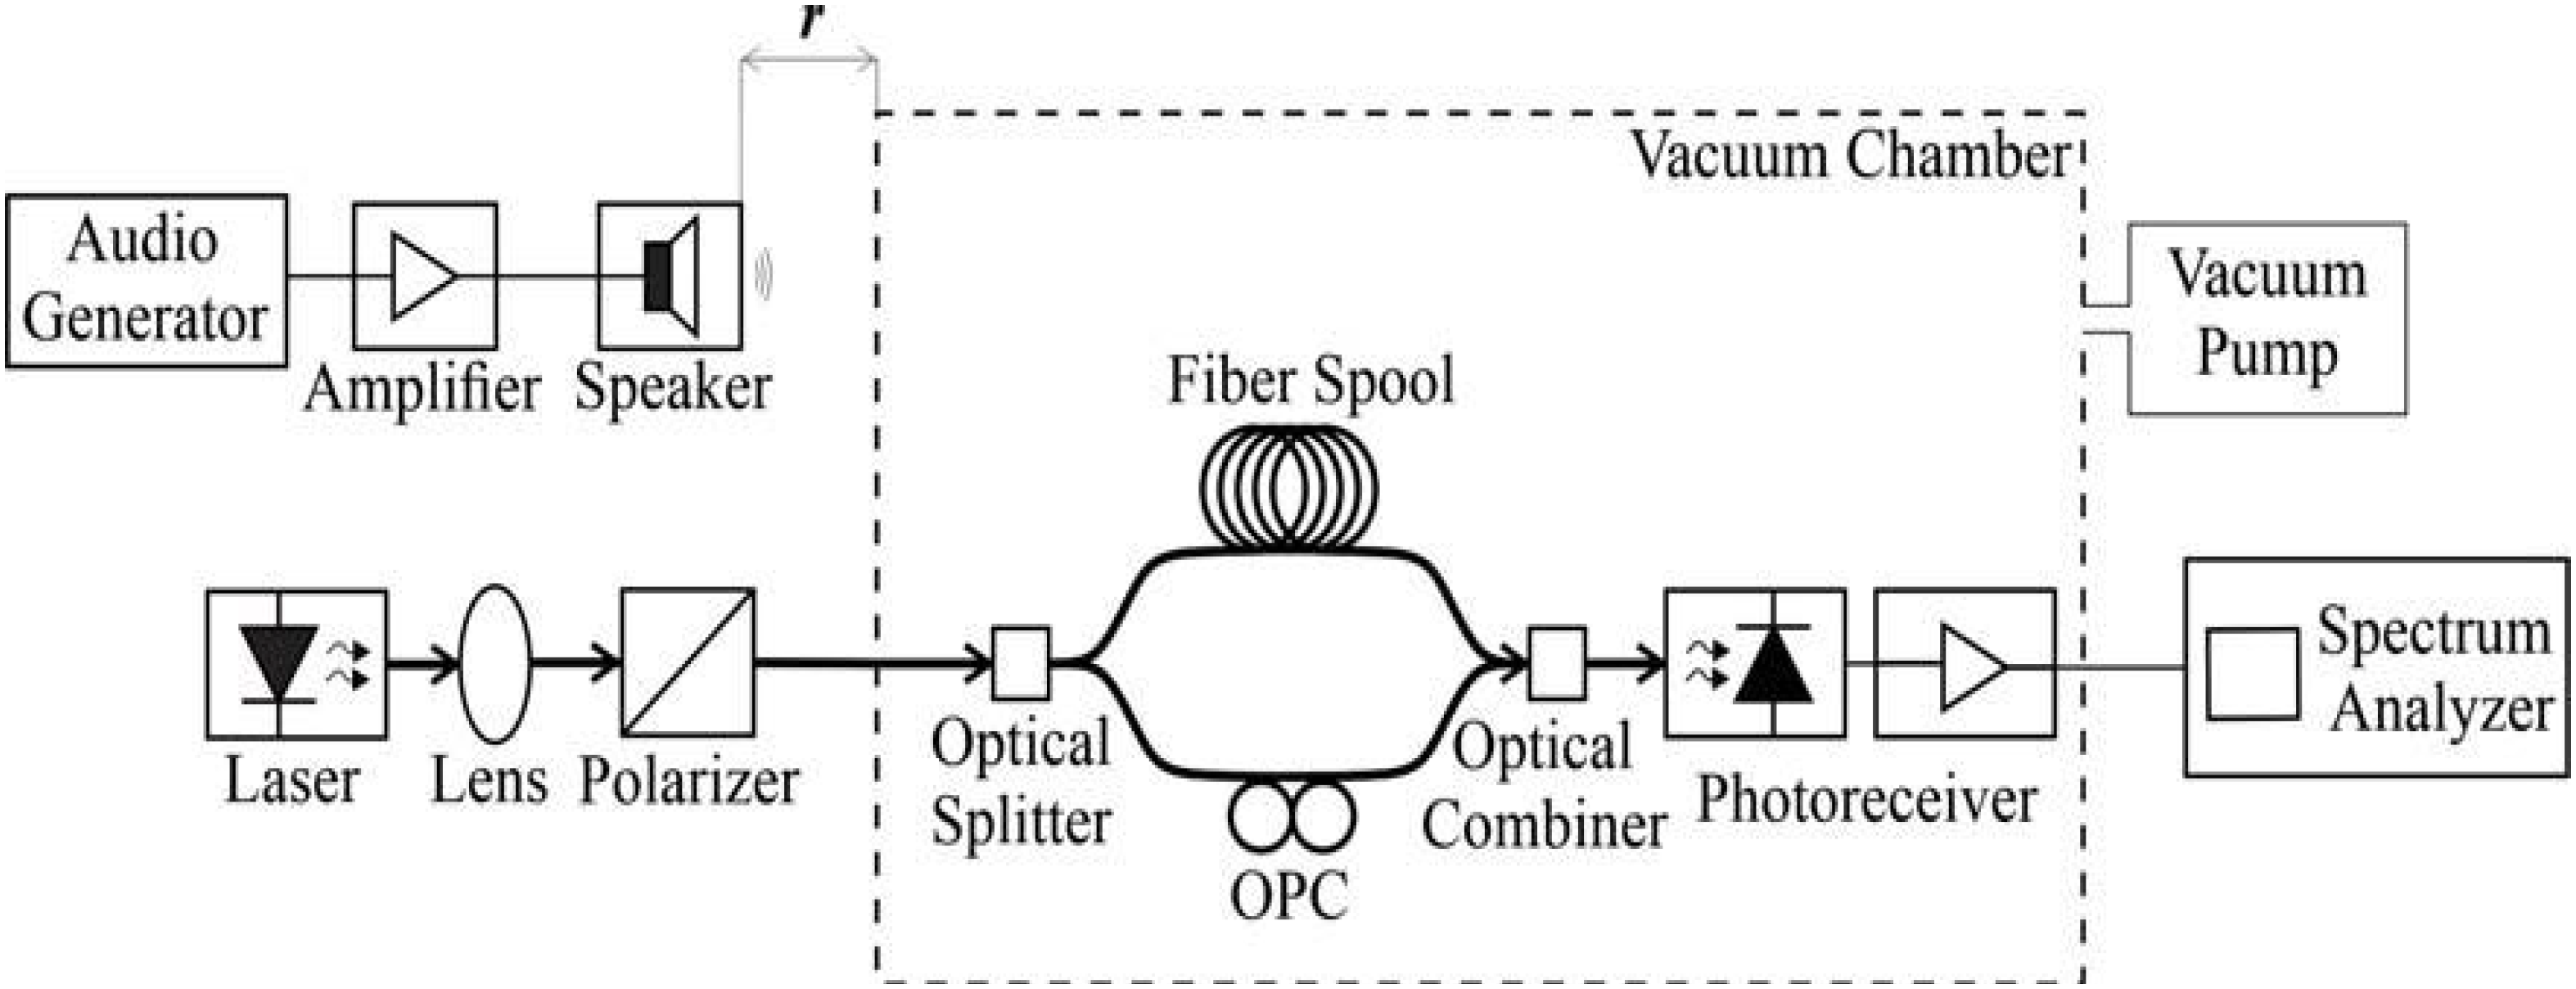
The experimental setup used here is shown in Fig. 2. A narrow linewidth He-Ne laser operating at 632.8 nm continuous wave is lens-coupled to a bare monomode optical fiber. After the surface fiber modes were eliminated, the fiber is introduced in a vacuum chamber with adjustable inside air pressure. The transmitted light goes to the monomode fiber optical MZI made with a 50% fiber coupler, a short arm (1 m) and a long 2 km arm with the cylindrical OFS. Both arms are combined in a second coupler and a polarization controller is adjusted for maximum homodyne beat signal. The chamber inside pressure was kept at 1.2 Torr. The measured laser linewidth at this small pressure was 220 Hz [30[30] F. J. Galdieri, T. Sutili, N. Melnikoff, A. C. Bordonalli, and E. Conforti, “Influence of exterior acoustic noise on narrow linewidth laser measurements using self-homodyne optical fiber interferometer,” Optik, 204, 164101, 2020. [doi:10.1016/j.ijleo.2019.164101].
https://doi.org/10.1016/j.ijleo.2019.164...
]. Finally, the He-Ne homodyne mixed fiber signal is carried outside the vacuum glass chamber and detected by a silicon PIN photodiode. The He-Ne laser polarization controller was adjusted to avoid polarization flipping between the two laser eigenstates (parallel and perpendicular) [45[45] Y. Wu, S. Zhang, and Y. Li, “The intra-cavity phase anisotropy and the polarization flipping in He-Ne laser,” Opt. Express, vol. 18, pp. 13684–13690, 2013. [doi:10.1364/OE.21.013684].
https://doi.org/10.1364/OE.21.013684...
].
Experimental setup employing a He-Ne single polarized laser light, a monomode fiber Mach-Zehnder interferometer with a 2 km long arm optical fiber spool (OFS), inside a vacuum chamber, a silicon PIN photoreceiver and a spectrum analyzer. The 75 Hz seed signal is given by an audio generator, an amplifier, and a speaker.
IV. Experimental Results
After performing a characterization of the OFS shown in Fig. 1, a 75 Hz sinusoidal sound produced by a speaker was placed at a distance r equal to 1.2 m outside the glass chamber, as shown in Fig. 2. Also, this chamber and the laser were mechanically isolated from the environment by double isolation optical tables. At 1.2 Torr, the environment noise was around 23 dB below the signal level [46[46] E. Conforti, M. Rodigheri, T. Sutili, and F. J. Galdieri, “Acoustical and 1/f noises in narrow linewidth lasers,” Optics Communications, vol. 476, pp. 126286, 2020. [doi:10.1016/j.optcom.2020.126286].
https://doi.org/10.1016/j.optcom.2020.12...
]. The produced 75 Hz sound outside the vacuum chamber has an air pressure intensity in the interval of 94 dB > Lp > 85 dB or 1 Pa > Lp > 0.35 Pa. The 75 Hz sound produces a vibration that is enough to provoke the appearance of resonance modes on the OFS, even inside a 1.2 Torr vacuum chamber air pressure, since the MZI is extremely sensitive to any external sound vibration. The 75 Hz frequency and its harmonics were chosen to have no coincidence with the 60 Hz and its harmonics, and to the OFS expected resonances. The vacuum pressure of 1.2 Torr was the minimal achieved with the apparatus here. Increasing the chamber inside air pressure does not change the resonance values but decreases the signal to noise ratio. Different spool geometries were not tested.
The MZI photoreceiver experimental signal (averaged 36 times) using the FFT spectral analyzer from 1 Hz up to 200 Hz scan is shown in the power spectrum density (PSD) of Fig. 3. The incident sinusoidal sound wave exciting the fiber reel (generated at 75 Hz) appears as letter J in Fig. 3 (highest level of -64 dBVRMS /√Hz).
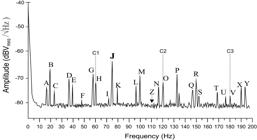
The first harmonic appears as letter R at 150 Hz, with a smaller level of -70 dBVRMS. Also note the undesirable 60 Hz induced noise (H, level of -72 dBVRMS /√Hz) including its harmonics at 120 Hz (O, level of -71.8 dBVRMS /√Hz), and 180 Hz (V, with a smaller level of −77 dBVRMS /√Hz).
The PSD LMM resonances can be identified as: n = 1, f = 16 Hz (letter A in Fig. 3); n = 2, f = 23 Hz (C); n = 3, f = 39 Hz (E); n = 4, f = 48 Hz (F, small amplitude); n = 5, f = 58 Hz (G); n = 6, f = 72 Hz (I, very small amplitude of -77.2 dBVRMS /√Hz); n = 7, f = 79 Hz (K); n = 8, f = 96 Hz (L); n = 9, f= 110 Hz (this small amplitude resonance shown by the letter Z is close to the photodetected signal level of -82 dBVRMS /√Hz); n = 10, f = 116 Hz (N); n = 11, f = 133 Hz (P); n = 12, f = 146 Hz (Q); n= 13, f = 152 Hz (S); n = 14, f = 168 Hz (T); n = 15, f = 176 Hz (U); n = 16, f = 194 Hz (Y). The PSD FTM DVM resonances of the OFS can be identified since they are strong amplitude resonances. The results are: n = 0, (breath), f = 19.5 Hz (B); n = 1, (dipole), f = 23 Hz (C, same frequency as AMM case); n = 2 (quadrupole bell), f = 36 Hz (D); n = 3, f = 99 Hz (M); n = 4, (octupole), f= 190 Hz (X).
V. Results and Discussion
The comparison between results from the PSD experimental setup of Fig. 2 and the theory using DMV equations (for FTM and LMM) is shown in Table I, for 21 resonance frequencies from 12 Hz up to 200 Hz. A maximum error of ± 5 Hz between theory and experiment can be noted. Also, the experimental intensity levels of the various resonances are presented in Table I.
The experimental results employed a Spectrum Analyzer based on Fast Fourier Transform (FFT). The instrument error can be verified with the 60 Hz signal and its harmonics, as shown in Fig. 3 (lines C1, C2, and C3). An error up to 0.5 Hz can be noted. Additionally, a significant source of experimental inaccuracy is related to the influence of the acoustical environment noises. The employment of a vacuum chamber at 1.2 Torr (illustrated in Fig. 2) is necessary to decrease the acoustical noises and to obtain the sharp resonances peaks shown in Fig. 3 [46[46] E. Conforti, M. Rodigheri, T. Sutili, and F. J. Galdieri, “Acoustical and 1/f noises in narrow linewidth lasers,” Optics Communications, vol. 476, pp. 126286, 2020. [doi:10.1016/j.optcom.2020.126286].
https://doi.org/10.1016/j.optcom.2020.12...
]. The results without vacuum are inaccurate and it is almost impossible to distinguish the specific resonances [46[46] E. Conforti, M. Rodigheri, T. Sutili, and F. J. Galdieri, “Acoustical and 1/f noises in narrow linewidth lasers,” Optics Communications, vol. 476, pp. 126286, 2020. [doi:10.1016/j.optcom.2020.126286].
https://doi.org/10.1016/j.optcom.2020.12...
].
Additionally, the PSD intensity level of the measured resonances are shown in the last column of Table I. The FTM resonances have the highest amplitude PSD values (from -66 up to -74 dBVRMS /√Hz). The LMM resonances have smaller amplitudes (from -68 up to -82 dBVRMS /√Hz). Another important aspect of the technique is related to the laser linewidth since the acoustical noises increase the apparent laser linewidth [30[30] F. J. Galdieri, T. Sutili, N. Melnikoff, A. C. Bordonalli, and E. Conforti, “Influence of exterior acoustic noise on narrow linewidth laser measurements using self-homodyne optical fiber interferometer,” Optik, 204, 164101, 2020. [doi:10.1016/j.ijleo.2019.164101].
https://doi.org/10.1016/j.ijleo.2019.164...
]. Indeed, the FFT frequency span shall be less than the laser linewidth of 220 Hz to achieve the best SNR using the MZI configuration of Fig. 2. In our case we used an FFT span of 200 Hz. The obtained laser white noise PSD flat level [46[46] E. Conforti, M. Rodigheri, T. Sutili, and F. J. Galdieri, “Acoustical and 1/f noises in narrow linewidth lasers,” Optics Communications, vol. 476, pp. 126286, 2020. [doi:10.1016/j.optcom.2020.126286].
https://doi.org/10.1016/j.optcom.2020.12...
] of -82 dBVRMS /√Hz (shown in Fig. 3) is well above the noise level (without light) of -105 dBVRMS /√Hz (not shown here). This small noise level at 1.2 Torr is equivalent to 60 nW/√Hz and the laser PSD level is 12 μW√Hz [46[46] E. Conforti, M. Rodigheri, T. Sutili, and F. J. Galdieri, “Acoustical and 1/f noises in narrow linewidth lasers,” Optics Communications, vol. 476, pp. 126286, 2020. [doi:10.1016/j.optcom.2020.126286].
https://doi.org/10.1016/j.optcom.2020.12...
].
The results using the DMV Theory of Section II are presented once more in Table II for the FTM resonances. However, they are supplemented by numerical results based on the Love-Timoshenko Theory [35[35] A. W. Leissa, Vibration of Shells, ch. 1, pp. 31–184. Report NASA SP-288, 1973.] and results [30[30] F. J. Galdieri, T. Sutili, N. Melnikoff, A. C. Bordonalli, and E. Conforti, “Influence of exterior acoustic noise on narrow linewidth laser measurements using self-homodyne optical fiber interferometer,” Optik, 204, 164101, 2020. [doi:10.1016/j.ijleo.2019.164101].
https://doi.org/10.1016/j.ijleo.2019.164...
] using commercial Finite Element Analysis packets: NASTRAN [42[42] MSC Nastran, Patran – Finite Element Analysis and Solver, MSC Software.] and COMSOL [47[47] COMSOL Structural Mechanics Modeling V.3.5a.].
The simplified DMV Theory results (presented in Table II for the FTM resonances from n=2 until n=4) attained values above and below the experimental values, indicating inaccuracies due to the simplified analytical approach. Instead, the Love-Timoshenko Theory has always smaller resonance values than experiment if the correct value of h= 1.0 mm is used (not shown here). Also, if a thicker cylinder of h=1.1 mm is assumed, the results (presented in Table II) for the Love-Timoshenko Theory has a better fit with experimental values. Indeed, a better fit using a ticker cylinder (10% ticker than the real OFS cylinder) may be an indication of the Styropor solid cylinder influence (not considered here).
The Finite Element COMSOL results of Table II assume a 75 Hz acoustical plane wave with amplitude of 1.0 Pa incident on the OFS model based on Fig. 1. The analyzed thin empty cylinder has dimensions: L = 0.4 m height, internal radius of R = 0.15 m, and h = 10−3 m thickness. Those results were used to estimate the fiber induced birefringence [30[30] F. J. Galdieri, T. Sutili, N. Melnikoff, A. C. Bordonalli, and E. Conforti, “Influence of exterior acoustic noise on narrow linewidth laser measurements using self-homodyne optical fiber interferometer,” Optik, 204, 164101, 2020. [doi:10.1016/j.ijleo.2019.164101].
https://doi.org/10.1016/j.ijleo.2019.164...
] and smaller resonance frequencies in relation to the experiment were obtained. This might be a consequence of the Finite Element mesh constraints due to limitations of the computer memory and speed. Finally, the NASTRAN results shown in Table II are closer and always below the experimental values (difference from 2 to 5 Hz), and these differences increase from mode order n=2 to n=4. These discrepancies might be also due to the Styropor solid cylinder undesired effect since we assumed always just an empty OFS.
A possible further explanation for discrepancies between theory and experiment might be: fiber spool wound imperfections; Styropor influence [43[43] J. Verdirame and S. Nayfeh, “Vibration damping in cylindrical shells filled with low-density low-wave-speed media,” Proceedings of SPIE - The International Society for Optical Engineering, 5760, 2005. [doi: 10.1117/12.601739].
https://doi.org/10.1117/12.601739...
, 44[44] H. T. Banks and R. Smith, “Modeling of the structural acoustic coupling inside a thin cylindrical shell,” Proceedings of SPIE - The International Society for Optical Engineering, 1993. [doi: 10.1117/12.148400].
https://doi.org/10.1117/12.148400...
, 48[48] T. Lauwers, A. Glière, and S. Basrour, “Resonant optical transduction for photoacoustic detection,” in SPIE-OPTO, Proceedings 112830R, San Francisco, California, United States, 2020. [doi: 10.1117/12.2544616].
https://doi.org/10.1117/12.2544616...
]; environment noises and vibrations [4[4] T. Kessler, C. Hagemann, C. Grebing, et al., “A sub-40-mHz-linewidth laser based on a silicon single-crystal optical cavity,” Nature Photonics, vol. 6, no.10, pp. 687 – 692, 2012. [doi: 10.1038/NPHOTON.2012.217].
https://doi.org/10.1038/NPHOTON.2012.217...
, 49[49] M. Kwak, D.-H. Yang, and J.-H. Lee, “Active vibration control of a submerged cylindrical shell by piezoelectric sensors and actuators,” Proceedings of SPIE - The International Society for Optical Engineering 8341, 66, 2012.]; theoretical approximations; laser finite linewidth; MZI outside linear modulation range [50[50] T. Sutili and E. Conforti, “Optical Modulator Half-Wave Voltage Measurement using Opposite Phase Sine Waves,” Journal of Lightwave Technology, vol. 34, pp. 2152–2157, 2016. [doi:10.1109/JLT.2016.2525860].
https://doi.org/10.1109/JLT.2016.2525860...
], linear dynamic range [51[51] B. Ouyang, Y. Li,M. Kruidhof, et al., “Highly sensitive silicon Mach-Zehnder interferometer based ultrasound sensor,” SPIE OPTO, Proceedings 112830R, San Francisco, California, United States, 2020). [doi: 10.1117/12.2539573] (2020).
https://doi.org/10.1117/12.2539573...
]; and fiber light-polarization Brillouin effects [52[52] C. Buret, M. Hauden, J. Chretien, et al., “Polarization of Brillouin scattered light in silica nanofibers,” SPIE LASE, Proceedings 112641F, San Francisco, California, United States, 2020. [doi: 10.1117/12.2544894]
https://doi.org/10.1117/12.2544894...
]. However, the frequencies measured here are much lower than the GHz Brillouin frequencies scattered in optical fibers.
The technique presented here might be useful for resonances measurements at higher frequencies if a fiber spool (resonating at ultrasound frequencies) was inserted in one arm of the MZI shown in Fig. 2, and a proper laser is chosen.
VI. Conclusion
The acoustic wave resonances of an OFS as a part of an optical fiber MZI inside a vacuum chamber set at 1.2 Torr have been obtained. The long MZI monomode OFS arm of 2 km and a small linewidth He-Ne laser at 632.8 nm were used. A reasonable correspondence between experiment and theory in the 10 Hz to 200 Hz range was observed and the fundamental resonance modes of the fiber spool were characterized. The results evince the importance of OFS resonances spurious signals for low frequency small linewidth lasers measurements and MZI OFS based sensors.
VII. Acknowledgement
This work was supported in part by the Brazilian Agencies São Paulo Research Foundation (FAPESP – grants 2018/18337-5, 2017/20121-8, 2015/50063-4, 2015/24517-8), and National Council for Scientific and Technological Development (CNPq – grants 301409/2017-0 and 402923/2016-2).
REFERENCES
-
[1]S. Gundavarapu, G. M. Brodnik, M. Puckett, et al., “Sub-hertz fundamental linewidth photonic integrated Brillouin laser,” Nature Photonics, vol. 13, pp. 60–67, 2019. [doi:10.1038/s41566-018-0313-2].
» https://doi.org/10.1038/s41566-018-0313-2 -
[2]W. Loh, S. Yegnanarayanan, F. O’Donnell, et al., “Ultra-narrow linewidth Brillouin laser with nanokelvin temperature self-referencing,” Optica, vol. 6, pp. 152–159, 2019. [doi:10.1364/OPTICA.6.000152].
» https://doi.org/10.1364/OPTICA.6.000152 -
[3]C. Pyrlik, W. Lewoczko-Adamczyk, S. Schwertfeger, et al., “Ultra-Narrow Linewidth, Micro-Integrated Semiconductor ExternalCavity Diode Laser Module for QuantumOptical Sensors in Space,” in 2015 Conference on Lasers and Electro-Optics (CLEO), 1–2, 2015. [doi:10.1364/CLEOAT.2015.JTh2A.79].
» https://doi.org/10.1364/CLEOAT.2015.JTh2A.79 -
[4]T. Kessler, C. Hagemann, C. Grebing, et al., “A sub-40-mHz-linewidth laser based on a silicon single-crystal optical cavity,” Nature Photonics, vol. 6, no.10, pp. 687 – 692, 2012. [doi: 10.1038/NPHOTON.2012.217].
» https://doi.org/10.1038/NPHOTON.2012.217 -
[5]H. Al-Taiy, N. Wenzel, S. Preussler, et al., “Ultra-narrow linewidth, stable and tunable laser source for optical communication systems and spectroscopy,” Optics Letters, vol. 39, no. 20,pp. 5826-5829, 2014.[doi: 10.1364/OL.39.005826].
» https://doi.org/10.1364/OL.39.005826 -
[6]R. C. Kamikawachi, I. Abe, H. J. Kalinowski, J.L. Fabris, J.F. Pinto, “Nonlinear temperature dependence of etched fiber Bragg gratings,” IEEE Sensors Journal, vol. 7, no. 8, pp. 1358-1359, 2007. [doi: 10.1109/JSEN.2007.905032]
» https://doi.org/10.1109/JSEN.2007.905032 -
[7]P. F. Nascimento, A. P. G. O. Franco, R. Fiorin, M. A. de Souza, H. J. Kalinowski, and I. Abe, “Case Study of Muscle Fatigue in Parafunctional Patient using Occlusal Device with Fiber Bragg Grating Sensors,” J. Microw. Optoelectron. (JMOe), vol. 17, no. 2, pp. 306-318, 2018. [doi: 10.1590/2179-10742018v17i21293]
» https://doi.org/10.1590/2179-10742018v17i21293 -
[8]I. Abe, M.S. Milczewski, M.A. Souza, H.J. Kalinowski, O.F. Machuca, G.C. Marin, and E.S. Camargo, “The force magnitude of a human bite measured at the molar intercuspidation using fiber Bragg gratings”, J. Microw. Optoelectron. (JMOe), vol. 16, pp. 434-444, 2017. [doi: 10.1590/2179-10742017v16i2808]
» https://doi.org/10.1590/2179-10742017v16i2808 -
[9]M.S. P. Silva, H. P. Alves. J. F. Nascimento, and J. F. Martins-Filho, “Impact of Pulse Width on the Sensitivity and Range of a Raman-based Distributed Fiber-optic Temperature Sensor,” J. Microw. Optoelectron. (JMOe), vol. 17, no. 4, pp- 539-551, December 2018. [doi: 10.1590/2179-10742018v17i41542]
» https://doi.org/10.1590/2179-10742018v17i41542 -
[10]R. C. Leite, V. Dmitriev, C. Hudon, S. Gingras, J. Piccard, L. Mydlarsky, and C. Guddemi, “Analysis Of Thermo-Mechanical Stress In Fiber Bragg Grating Used For Generator Rotor Temperature Monitoring,” J. Microw. Optoelectron. (JMOe), vol. 16, no. 2, pp. 445-459, 2017. [doi: 10.1590/2179-10742017v16i2818]
» https://doi.org/10.1590/2179-10742017v16i2818 -
[11]G. D. de Andrade, H. R. de O. Rocha, M. E. V. Segatto, M. J. Pontes, and C. E. S. Castellani, “ Study and Optimization of Raman Amplifiers in Tellurite-Based Optical Fibers for Wide-Band Telecommunication Systems”, J. Microw. Optoelectron. (JMOe), vol.18, no. 2, pp. 219-226, 2019. [10.1590/2179-10742019v18i21558].
» https://doi.org/10.1590/2179-10742019v18i21558 -
[12]Q. Chai, Y. Luo, J. Ren, J. Zhang, J. Yang, L. Yuan, G. Peng, “Review on fiber-optic sensing in health monitoring of power grids,” Optical Engineering vol. 58, no. 7, pp. 072007, 2019. [doi: 10.1117/1.OE.58.7.072007].
» https://doi.org/10.1117/1.OE.58.7.072007 -
[13]L. B. Scandian, M. E. V. Segatto, C. E. S. Castellani, “Analytical Analysis and Experimental Validation of a Multi-parameter Mach-Zehnder Fiber Optic Interferometric Sensor”, J. Microw. Optoelectron. (JMOe), vol. 17, no. 4, pp- 528-538, December 2018. [doi: 10.1590/2179-10742018v17i41540]
» https://doi.org/10.1590/2179-10742018v17i41540 -
[14]G. B. Hocker, “Fiber optic acoustic sensors with composite structure: an analysis,” Appl. Opt., vol.18, pp. 3679–3683, 1979. [doi:10.1364/AO.18.003679].
» https://doi.org/10.1364/AO.18.003679 -
[15]E. Udd, “Fiber-Optic Acoustic Sensor Based on the Sagnac Interferometer,” in Single Mode Optical Fibers, A. D. Pearson, Ed., 0425, pp. 90-95, International Society for Optics and Photonics, SPIE, 1983. [doi:10.1117/12.936219]
» https://doi.org/10.1117/12.936219 -
[16]C. Sun, “Multiplexing of fiber-optic acoustic sensors in a Michelson interferometer configuration,” Opt. Lett., vol. 28, pp. 1001–1003, 2003. [doi:10.1364/OL.28.001001].
» https://doi.org/10.1364/OL.28.001001 -
[17]P. Chang, L. Huang, X. Song, et al., “Acoustic Wave Induced Mach-Zehnder Interferometer Based on a Sandwich-Structured Single Mode Fiber,” in 2016 Conference on Lasers and Electro-Optics (CLEO), 1–2, 2016. [doi:10.1364/CLEOAT.2016.JTu5A.88].
» https://doi.org/10.1364/CLEOAT.2016.JTu5A.88 -
[18]M. Idjadi and F. Aflatouni, “Nanophotonic phase noise filter in silicon,” Nature Photonics, vol.14, pp. 234-239, 2020. [doi: 10.1038/s41566-020-0605-1]
» https://doi.org/10.1038/s41566-020-0605-1 -
[19]D. Li, Q. Cheng, Y. Li, et al., “Efficient laser noise reduction method via actively stabilized optical delay line,” Optics Express vol. 25, pp. 9071-9077, 2017. [doi: 10.1364/OE.25.009071].
» https://doi.org/10.1364/OE.25.009071 -
[20]L. Kazovsky, “Performance analysis and laser linewidth requirements for optical PSK heterodyne communications systems,” Journal of Lightwave Technology vol. 4, pp. 415–425, 1986. [doi:10.1109/JLT.1986.1074727].
» https://doi.org/10.1109/JLT.1986.1074727 -
[21]C. Henry, “Phase noise in semiconductor lasers,” Journal of Lightwave Technology, vol. 4, pp. 298–311, 1986. [doi:10.1109/JLT.1986.1074721].
» https://doi.org/10.1109/JLT.1986.1074721 -
[22]T. Okoshi, K. Kikuchi, and A. Nakayama, “Novel method for high resolution measurement of laser output spectrum,” Electronics Letters, vol. 16, pp. 630–631, 1980. [doi:10.1049/el:19800437].
» https://doi.org/10.1049/el:19800437 -
[23]K. Kikuchi and T. Okoshi, “Dependence of semiconductor laser linewidth on measurement time: evidence of predominance of 1/f noise,” Electronics Letters, vol. 21, pp. 1011–1012, 1985. [doi:10.1049/el:19850717].
» https://doi.org/10.1049/el:19850717 -
[24]L. B.Mercer, “1/f frequency noise effects on self-heterodyne linewidth measurements,” Journal of Lightwave Technology vol. 9, pp. 485–493, 1991. [doi:10.1109/50.76663].
» https://doi.org/10.1109/50.76663 -
[25]H. Ludvigsen, M. Tossavainen, and M. Kaivola, “Laser linewidth measurements using self-homodyne detection with short delay,” Optics Communications, vol. 155, no. 1, pp. 180–186, 1998. [doi:10.1016/S0030-4018(98)00355-1].
» https://doi.org/10.1016/S0030-4018(98)00355-1 -
[26]P. Sevillano, J. Subas, C. Heras, et al., “Brillouin induced self-heterodyne technique for narrow line width measurement,” Opt. Express, vol. 21, no. 11, pp. 15201–15207, 2010. [doi:10.1364/OE.18.015201].
» https://doi.org/10.1364/OE.18.015201 -
[27]S. Huang, T. Zhu, M. Liu, et al., “Precise measurement of ultra-narrow laser linewidths using the strong coherent envelope,” Nature Scientific Reports vol. 07, 2017. [doi:10.1038/srep41988].
» https://doi.org/10.1038/srep41988 -
[28]T. Sutili, R. C. Figueiredo, and E. Conforti, “Laser linewidth and phase noise evaluation using heterodyne offline signal processing,” Journal of Lightwave Technology vol. 34, pp. 4933–4940, 2016. [doi:10.1109/JLT.2016.2597217].
» https://doi.org/10.1109/JLT.2016.2597217 -
[29]E. Conforti and T. Sutili, “Offline measurements of photonic devices,” in 2017 SBMO/IEEE MTT-S International Microwave and Optoelectronics Conference (IMOC), 1–5, 2017. [doi:10.1109/IMOC.2017.8121156].
» https://doi.org/10.1109/IMOC.2017.8121156 -
[30]F. J. Galdieri, T. Sutili, N. Melnikoff, A. C. Bordonalli, and E. Conforti, “Influence of exterior acoustic noise on narrow linewidth laser measurements using self-homodyne optical fiber interferometer,” Optik, 204, 164101, 2020. [doi:10.1016/j.ijleo.2019.164101].
» https://doi.org/10.1016/j.ijleo.2019.164101 -
[31]J. Staudenraus andW. Eisenmenger, “Fibre-optic probe hydrophone for ultrasonic and shock wave measurements in water,” Ultrasonics vol. 31, no. 4, pp. 267 – 273, 1993. [doi:10.1016/0041-624X(93)90020-Z].
» https://doi.org/10.1016/0041-624X(93)90020-Z -
[32]H. L. W. Chan and K. S. Chiang, “Optical fiber ultrasonic sensors,” Ultrasonic Exposimetry, pp. 283–314, 1993.
-
[33]C. Lan, W. Zhou, and Y. Xie, “Detection of ultrasonic stress waves in structures using 3D shaped optic fiber based on a MachZehnder interferometer,” Sensors, vol. 18, no. 4, 2018. [doi:10.3390/s18041218].
» https://doi.org/10.3390/s18041218 -
[34]M. S. Qatu, “Recent research advances in the dynamic behavior of shells: 19892000,” Applied Mechanics Reviews 55, pp. 415–434, 2002. [doi:10.1115/1.1483078].
» https://doi.org/10.1115/1.1483078 -
[35]A. W. Leissa, Vibration of Shells, ch. 1, pp. 31–184. Report NASA SP-288, 1973.
-
[36]W. Flügge, Bending of Circular Cylindrical Shells, 204–316. Springer Berlin Heidelberg, Berlin, Heidelberg, 1973. [doi:10.1007/978-3-642-88291-35].
» https://doi.org/10.1007/978-3-642-88291-35 -
[37]K. Forsberg, “Influence of boundary conditions on the modal characteristics of thin cylindrical shells,” AIAA Journal vol. 2, no. 12, pp. 2150–2157, 1964. [doi:10.2514/3.55115].
» https://doi.org/10.2514/3.55115 -
[38]L. H. Donnell, Stability of thin-walled tubes under torsion, Ch. 1, 1–22. Report NACA 479, 1935.
-
[39]F. I. N. (editor), “Chapter 15 – The donnell-mushtari-vlasov theory,” in Shell Theory, North-Holland Series in Applied Mathematics and Mechanics, vol. 29, pp.353–362, North-Holland, 1985. [doi:10.1016/B978-0-444-87640-9.50021-6].
» https://doi.org/10.1016/B978-0-444-87640-9.50021-6 -
[40]Y. Xing, B. Liu, and T. Xu, “Exact solutions for free vibration of circular cylindrical shells with classical boundary conditions,” International Journal of Mechanical Sciences, vol. 75, pp. 178–188, 2013. [doi:10.1016 /j.ijmecsci.2013.06.005].
» https://doi.org/10.1016/j.ijmecsci.2013.06.005 -
[41]Y. Xing, T. Xu, and B. Liu, “Recent research advances of exact solutions for free vibrations of plates and shells,” in 11th International Conference on Vibration Problems, Z. Dimitrová et al. Eds. Lisbon Portugal, 1–10, 2013. [https://icoev.org/proceedings2013/231_paper0.pdf]
» https://icoev.org/proceedings2013/231_paper0.pdf -
[42]MSC Nastran, Patran – Finite Element Analysis and Solver, MSC Software.
-
[43]J. Verdirame and S. Nayfeh, “Vibration damping in cylindrical shells filled with low-density low-wave-speed media,” Proceedings of SPIE - The International Society for Optical Engineering, 5760, 2005. [doi: 10.1117/12.601739].
» https://doi.org/10.1117/12.601739 -
[44]H. T. Banks and R. Smith, “Modeling of the structural acoustic coupling inside a thin cylindrical shell,” Proceedings of SPIE - The International Society for Optical Engineering, 1993. [doi: 10.1117/12.148400].
» https://doi.org/10.1117/12.148400 -
[45]Y. Wu, S. Zhang, and Y. Li, “The intra-cavity phase anisotropy and the polarization flipping in He-Ne laser,” Opt. Express, vol. 18, pp. 13684–13690, 2013. [doi:10.1364/OE.21.013684].
» https://doi.org/10.1364/OE.21.013684 -
[46]E. Conforti, M. Rodigheri, T. Sutili, and F. J. Galdieri, “Acoustical and 1/f noises in narrow linewidth lasers,” Optics Communications, vol. 476, pp. 126286, 2020. [doi:10.1016/j.optcom.2020.126286].
» https://doi.org/10.1016/j.optcom.2020.126286 -
[47]COMSOL Structural Mechanics Modeling V.3.5a.
-
[48]T. Lauwers, A. Glière, and S. Basrour, “Resonant optical transduction for photoacoustic detection,” in SPIE-OPTO, Proceedings 112830R, San Francisco, California, United States, 2020. [doi: 10.1117/12.2544616].
» https://doi.org/10.1117/12.2544616 -
[49]M. Kwak, D.-H. Yang, and J.-H. Lee, “Active vibration control of a submerged cylindrical shell by piezoelectric sensors and actuators,” Proceedings of SPIE - The International Society for Optical Engineering 8341, 66, 2012.
-
[50]T. Sutili and E. Conforti, “Optical Modulator Half-Wave Voltage Measurement using Opposite Phase Sine Waves,” Journal of Lightwave Technology, vol. 34, pp. 2152–2157, 2016. [doi:10.1109/JLT.2016.2525860].
» https://doi.org/10.1109/JLT.2016.2525860 -
[51]B. Ouyang, Y. Li,M. Kruidhof, et al., “Highly sensitive silicon Mach-Zehnder interferometer based ultrasound sensor,” SPIE OPTO, Proceedings 112830R, San Francisco, California, United States, 2020). [doi: 10.1117/12.2539573] (2020).
» https://doi.org/10.1117/12.2539573 -
[52]C. Buret, M. Hauden, J. Chretien, et al., “Polarization of Brillouin scattered light in silica nanofibers,” SPIE LASE, Proceedings 112641F, San Francisco, California, United States, 2020. [doi: 10.1117/12.2544894]
» https://doi.org/10.1117/12.2544894
Publication Dates
-
Publication in this collection
11 Nov 2020 -
Date of issue
Dec 2020
History
-
Received
18 June 2020 -
Reviewed
25 June 2020 -
Accepted
11 Sept 2020