
Abstract
This work presents improvements to a telecommunication service planning tool for optimal positioning of base stations presented in a previous work. The tool uses a propagation loss model based on the K-Nearest Neighborhoods classifier since its conception. The original objective of this tool is to optimize the positioning of transmitting towers in the frequencies of 2.1 GHz and 2.6 GHz in a given environment, maximizing the coverage area. The improvement proposed in this article includes the optimization of the positioning of the towers in order to meet the maximum coverage, prioritizing the locations considered most important. The studied scenario is the campus of the Federal University of Pará, with characteristics similar to some cities in the Amazon region. The analysis of the results was made by comparing the power data received from the measurement campaigns with the coverage estimates obtained with the improved tool. The improved methodology showed better results than those from the previous study, both in the positioning of the antennas and in the time spent. We obtained a reduction of up to 72% in the time to calculate the optimal solution compared to the original study.
Index Terms
Optimization; Radiopropagation Models; Radio Base Station; Telecommunications
I. INTRODUCTION
The planning of coverage projects for communication and mobile internet services is important for the proper functioning of these services. In recent years, many services that used to be performed by analogical means (issuing documents, payments, purchases, provision of services, etc.) are migrating to digital media. In some countries, digital services are already a reality accessible to a large part of the population. In Brazil, this phenomenon has intensified in the last decade.
Radiopropagation models are an important factor in the planning of telecommunications services. However, most models and recommendations are developed with data from temperate climates [11 International Telecommunications Union, Recommendation ITU-R P. 1546-5. Method to point-to-area predictions for terrestrial services in the frequency range of 30 MHz to 3000 MHz. 2019.]. In general, such models become inaccurate for estimates in regions with mixed environments with buildings and dense vegetation. Therefore, a study for this type of environment is necessary to attend not only the reality of Amazonian cities, but also to attend other regions with equatorial forests or even very wooded cities.
In Amazonian cities, it is common to have shading zones on various frequencies used in telecommunications services, especially in cell phone services (calls, 3G, 4G, etc.) and digital television. These regions are called the shading zone, characterized by the natural path of the electromagnetic wave being covered by an obstacle, causing the receiver to be in the shadow of such an obstacle [22 T. S. Rappaport, Wireless Communications: Principles and Practice. Prentice Hall, 2nd edition. 2002.]. Due to this deficiency in the provision of telecommunication services, in particular, on the campus of the Federal University of Pará (UFPA) in Belém, there is a need for tools proposing feasible solutions to this problem.
This article proposes improvements in the work described in [33 C. R. Gomes, I. R. Gomes, R. L. Fraiha Lopes, H. S. Gomes, and G. P. S. Cavalcante, “Optimum Positioning of Base Station for Cellular Service Devices using Discrete Knowledge Model,” Journal of Microwaves, Optoelectronics and Electromagnetic Applications, v. 19, no. 4, pp. 428-443, Dec. 2020, doi: 10.1590/2179-10742020v19i4941
https://doi.org/10.1590/2179-10742020v19...
], which presents a model based on machine learning applied to a tool developed for the optimal positioning of Radio Base Stations (RBS), on the UFPA campus in the city of Belém, state of Pará, Brazil. The main objective is to improve the results obtained at the time, making them closer to reality in an eventual coverage project in the region considered. We made two main improvements in the methodology, which originated the better results exposed in this article. These are: i) Division of the area analyzed in parts, through a meridian, and consequent restriction of the number of RBS in each part; ii) Addition of a territorial priority criterion in the process of choosing the position of the ERBs, based on the initial classification of the environment.
II. RELATED WORKS
Several modeling techniques have emerged with the aim of representing the phenomenon of electromagnetic propagation in its various nuances. Among these, some important works related to this work are [44 Y. S. Meng, Y. H. Lee and B C. Ng, “Further study of rainfall effect on VHF forested radio-wave propagation with four layered model,” Progress in electromagnetics research-PIER99, pp.149-161, 2009.], [55 A. Taufique, M. Jaber, A. Imran, Z. Dawy and E. Yacoub, “Planning Wireless Cellular Networks of Future: Outlook, Challenges and Opportunities,” IEEE Access, vol. 5, pp. 4821-4845, 2017, doi: 10.1109/ACCESS.2017.2680318.
https://doi.org/10.1109/ACCESS.2017.2680...
], [66 I. R. Gomes, C. R. Gomes, H. S. Gomes, G. P. S. Cavalcante, “Empirical radio propagation model for DTV applied to non- homogeneous paths and different climates using machine learning techniques”. PLoS ONE, vol. 13, no. 3, Mar. 2018, doi: e0194511. https://doi.org/10.1371/journal.pone.0194511.
https://doi.org/10.1371/journal.pone.019...
] and [77 N. S. Nkordeh, et al., “LTE Network Planning using the Hata-Okumura and the COST-231 Hata Pathloss Models,” World Congress on Engineering, London, 2014.], which address environments with a strong presence of vegetation.
In the work [44 Y. S. Meng, Y. H. Lee and B C. Ng, “Further study of rainfall effect on VHF forested radio-wave propagation with four layered model,” Progress in electromagnetics research-PIER99, pp.149-161, 2009.], a study of a four-layer model for transmitter and receiver within the forest is presented. The authors take an approach to tropical forests, however, the scenario chosen for measurements is very specific and does not match equatorial natural forests. The authors of [44 Y. S. Meng, Y. H. Lee and B C. Ng, “Further study of rainfall effect on VHF forested radio-wave propagation with four layered model,” Progress in electromagnetics research-PIER99, pp.149-161, 2009.] made a comparison with traditional models, showing that models such as COST231 (Coopération Européenne dans le Domaine de la Recherche Scientifique et Technique) and ITU-R (International Telecommunications Union - Recommendation) do not show good results for forest regions.
The Study authors [55 A. Taufique, M. Jaber, A. Imran, Z. Dawy and E. Yacoub, “Planning Wireless Cellular Networks of Future: Outlook, Challenges and Opportunities,” IEEE Access, vol. 5, pp. 4821-4845, 2017, doi: 10.1109/ACCESS.2017.2680318.
https://doi.org/10.1109/ACCESS.2017.2680...
] describe the main topics for planning the new cellular technologies to be implemented, in particular 5G. The authors emphasize in the planning the importance of switching from large RBS to the small cell format. They also highlight the optimization of the positioning of new RBS for better coverage and propagation models aimed at city maps, reuse of frequencies (refarming), among other aspects.
In [66 I. R. Gomes, C. R. Gomes, H. S. Gomes, G. P. S. Cavalcante, “Empirical radio propagation model for DTV applied to non- homogeneous paths and different climates using machine learning techniques”. PLoS ONE, vol. 13, no. 3, Mar. 2018, doi: e0194511. https://doi.org/10.1371/journal.pone.0194511.
https://doi.org/10.1371/journal.pone.019...
], a propagation model for the Brazilian digital television band is shown, considering mixed paths of the “land-fresh water-land” type in different seasons of the year, in this case, Amazonian summer and winter. A continuous knowledge model for the characterization of losses, is used. The proposed model is a hybrid algorithm of K-nearest neighbors (KNN) and knowledge-based agents, where initially each point in the scenario receives a classification of its attributes and then a received power value is calculated.
The work [77 N. S. Nkordeh, et al., “LTE Network Planning using the Hata-Okumura and the COST-231 Hata Pathloss Models,” World Congress on Engineering, London, 2014.] makes a comparison of the Okumura-Hata and COST-231 Hata models in the planning of wireless networks at frequencies commonly used in Long Term Evolution (LTE) services. Its main results recommend the use of the COST231-Hata model when planning networks for transmission towers with a minimum height of 50 m.
In the paper [88 X. Cai, C. Zhang, J. Rodríguez-Piñeiro, X. Yin, W. Fan and G. F. Pedersen, “Interference Modeling for Low-Height Air-to-Ground Channels in Live LTE Networks,” IEEE Antennas and Wireless Propagation Letters, vol. 18, no. 10, pp. 2011-2015, Oct. 2019, doi: 10.1109/LAWP.2019.2936264.
https://doi.org/10.1109/LAWP.2019.293626...
], the authors calculate the values of the Signal Interference Ratio (SIR) in LTE air- to-ground networks on low-altitude flights. The results indicate that, for macrocells, the SIR is higher than that of microcells, for low altitudes. At higher altitudes, the scenario is the opposite.
Correlations between different models of propagation present in the literature applied to LTE networks in the city of Bogotá are presented in [99 J. E. Arévalo Peña, “Correlation analysis of propagation models for the design of a LTE - A network”, 2016 IEEE International Engineering Summit, II Cumbre Internacional de las Ingenierias (IE-Summit), Boca del Rio, Mexico, 2016, pp. 1-5, doi: 10.1109/IESummit.2016.7459775.
https://doi.org/10.1109/IESummit.2016.74...
]. The results of this study show that geometric models better represent the propagation in the analyzed environment.
In [1010 S. Makridakis, E. Spiliotis, V. Assimakopoulos, “Statistical and Machine Learning forecasting methods: Concerns and ways forward,” PLoS ONE, vol. 13, no. 3, Mar. 2018, doi: e0194889. https://doi.org/10.1371/journal.pone.0194889.
https://doi.org/10.1371/journal.pone.019...
], the authors propose, based on the comparison of results between statistical methods and methods based on machine learning theory, ways to improve the accuracy and computational cost of this last category of algorithms.
Multiobjective optimization methodologies have also been used to solve several problems over the past 40 years. Some examples of studies related to this theme are [1111 Z. He et al., “Multiobjective Reservoir Operation Optimization Using Improved Multiobjective Dynamic Programming Based on Reference Lines”, IEEE Access, vol. 7, pp. 103473-103484, 2019, doi: 10.1109/ACCESS.2019.2929196.
https://doi.org/10.1109/ACCESS.2019.2929...
] and [1212 X. Yu et al., “Set-Based Discrete Particle Swarm Optimization Based on Decomposition for Permutation-Based Multiobjective Combinatorial Optimization Problems,” IEEE Transactions on Cybernetics, vol. 48, no. 7, pp. 2139-2153, July 2018, doi: 10.1109/TCYB.2017.2728120.
https://doi.org/10.1109/TCYB.2017.272812...
].
The study [1111 Z. He et al., “Multiobjective Reservoir Operation Optimization Using Improved Multiobjective Dynamic Programming Based on Reference Lines”, IEEE Access, vol. 7, pp. 103473-103484, 2019, doi: 10.1109/ACCESS.2019.2929196.
https://doi.org/10.1109/ACCESS.2019.2929...
] shows the development and application of a multiobjective optimization technique in the optimal management of reservoirs (distribution/storage of water and inputs, silos in agriculture, etc.), a problem with different types of restrictions, priorities and, of course, objectives to be met. A complex commitment relationship.
The article [1212 X. Yu et al., “Set-Based Discrete Particle Swarm Optimization Based on Decomposition for Permutation-Based Multiobjective Combinatorial Optimization Problems,” IEEE Transactions on Cybernetics, vol. 48, no. 7, pp. 2139-2153, July 2018, doi: 10.1109/TCYB.2017.2728120.
https://doi.org/10.1109/TCYB.2017.272812...
] studies the permutation-based multiobjective combinatorial optimization problems. this paper proposes a set-based particle swarm optimization methodology based on decomposition. The methodology proposed in [1212 X. Yu et al., “Set-Based Discrete Particle Swarm Optimization Based on Decomposition for Permutation-Based Multiobjective Combinatorial Optimization Problems,” IEEE Transactions on Cybernetics, vol. 48, no. 7, pp. 2139-2153, July 2018, doi: 10.1109/TCYB.2017.2728120.
https://doi.org/10.1109/TCYB.2017.272812...
] decomposes a multiobjective problem into single-objective problems and then computes their solutions. The authors of [1212 X. Yu et al., “Set-Based Discrete Particle Swarm Optimization Based on Decomposition for Permutation-Based Multiobjective Combinatorial Optimization Problems,” IEEE Transactions on Cybernetics, vol. 48, no. 7, pp. 2139-2153, July 2018, doi: 10.1109/TCYB.2017.2728120.
https://doi.org/10.1109/TCYB.2017.272812...
] claim that the tests carried out validate that the proposed methodology is promising.
Study [1313 C. R. Gomes, D. K. N. Silva, J. Araujo, H. S. Gomes, G. P. S. Cavalcante, “Radio-Wave Propagation Model for UHF Band in Different Climatic Conditions with Dyadic Green's Function”, J. Microw., Optoelectronics and Electromagn. Appl., vol. 14, pp. 60-72, 2015. doi: 10.1590/2179-10742015v14i1427.
https://doi.org/10.1590/2179-10742015v14...
] proposes a three-layer deterministic model using Dyadic Green's Functions to predict electric field values. The model proposed in [1313 C. R. Gomes, D. K. N. Silva, J. Araujo, H. S. Gomes, G. P. S. Cavalcante, “Radio-Wave Propagation Model for UHF Band in Different Climatic Conditions with Dyadic Green's Function”, J. Microw., Optoelectronics and Electromagn. Appl., vol. 14, pp. 60-72, 2015. doi: 10.1590/2179-10742015v14i1427.
https://doi.org/10.1590/2179-10742015v14...
] considers climatic conditions by means of changing the constants of the medium and was developed for UHF frequencies. The authors emphasize differences in the received power for densely wooded urban scenarios and different climatic conditions in the UHF range.
Article [1414 J. Košmerl and A. Vilhar, “Base stations placement optimization in wireless networks for emergency communications”. 2014 IEEE International Conference on Communications Workshops (ICC), 2014, pp. 200-205, doi: 10.1109/ICCW.2014.6881196.
https://doi.org/10.1109/ICCW.2014.688119...
] presents a computational method for positioning terrestrial and aerial base stations with the goal of minimizing their number, while fully providing the required bandwidth over the region of New Orleans after Katrina. Positioning was achieved with the support of an evolutionary algorithm. The main steps of the algorithm are: (i) Setting the number of base stations, (ii) Initial positioning of base stations, (iii) Variation of station positions, (iv) Coverage calculation and selection, (v) Checking if the result is viable. The main objective of the optimization was to serve all users, even if a large number of antennas were considered.
Study [1515 S. K. Goudos, P. D. Diamantoulakis and G. K. Karagiannidis, “Multi-Objective Optimization in 5G Wireless Networks With Massive MIMO”, in IEEE Communications Letters, vol. 22, no. 11, pp. 2346-2349, Nov. 2018, doi: 10.1109/LCOMM.2018.2868663.
https://doi.org/10.1109/LCOMM.2018.28686...
] the authors presents an optimization framework, which is based on multiobjective evolutionary algorithms. These algorithms optimize all objectives simultaneously based on dominance relations, instead of transforming the problem into a single-objective one. The authors emphasize that the main challenges towards the efficient solution of multiobjective problems are the increased complexity and the selection of the best compromise solution.
III. Methodology
The optimization of the tower positioning process begins similarly to the one proposed in [33 C. R. Gomes, I. R. Gomes, R. L. Fraiha Lopes, H. S. Gomes, and G. P. S. Cavalcante, “Optimum Positioning of Base Station for Cellular Service Devices using Discrete Knowledge Model,” Journal of Microwaves, Optoelectronics and Electromagnetic Applications, v. 19, no. 4, pp. 428-443, Dec. 2020, doi: 10.1590/2179-10742020v19i4941
https://doi.org/10.1590/2179-10742020v19...
], in which the land is discrete and classified according to building and vegetation criteria. The data used were those acquired in [33 C. R. Gomes, I. R. Gomes, R. L. Fraiha Lopes, H. S. Gomes, and G. P. S. Cavalcante, “Optimum Positioning of Base Station for Cellular Service Devices using Discrete Knowledge Model,” Journal of Microwaves, Optoelectronics and Electromagnetic Applications, v. 19, no. 4, pp. 428-443, Dec. 2020, doi: 10.1590/2179-10742020v19i4941
https://doi.org/10.1590/2179-10742020v19...
] at the frequencies of 2.1 GHz and 2.6 GHz, as well as the loss model proposed in that work.
Measurements at 2.1 GHz (Enhanced Data Rates For GSM Evolution - EDGE) and 2.6 GHz (Long Term Evolution - LTE) took place at the premises of UFPA for two reasons: 1) The transmitting antennas of cellular systems radiate with much less power than towers of lower frequency ranges, such as, for example, digital television; 2) The locations chosen for the installation of new towers must be within UFPA, or in surroundings located less than 2 km from UFPA.
The transmitting antenna is located at 01°27’51.3” S / 48°26’56.6” O, with height h = 40 m, frequency 2.1 GHz and 2.6 GHz, operating power of 40 W and gain of 15.4 dB.
Measurements were taken at 24 points with the receiver in two positions: at 1 m and 2 m in height, respectively. At each point, it was measured for 2 minutes at each frequency, resulting in a total of 60 samples per point. After the measurements, it was considered for the calculations, in each measured point, the average of the values of the samples for the received power.
The measurements were made using the Cell Signal Monitor® program, which captures the received power in configurable time intervals. This program also identifies the network that is connected and monitors the Upload and Download speed.
The measurement points were not distributed in radials, since the UFPA area makes such distribution unfeasible, as this would imply the existence of points outside its dependencies. To capture the cellular signal, two identical cellular devices connected to different networks were used.
In this work, in order to improve the study [33 C. R. Gomes, I. R. Gomes, R. L. Fraiha Lopes, H. S. Gomes, and G. P. S. Cavalcante, “Optimum Positioning of Base Station for Cellular Service Devices using Discrete Knowledge Model,” Journal of Microwaves, Optoelectronics and Electromagnetic Applications, v. 19, no. 4, pp. 428-443, Dec. 2020, doi: 10.1590/2179-10742020v19i4941
https://doi.org/10.1590/2179-10742020v19...
], the following complementary criteria were adopted for losses by type of environment: (i) a priority metric (based on the flow of people) by type of environment; (ii) a division of the study space in two parts. A reduction of up to 72% in processing time was measured between calculations without and with criterion (ii). A flowchart of the methodology proposed in [33 C. R. Gomes, I. R. Gomes, R. L. Fraiha Lopes, H. S. Gomes, and G. P. S. Cavalcante, “Optimum Positioning of Base Station for Cellular Service Devices using Discrete Knowledge Model,” Journal of Microwaves, Optoelectronics and Electromagnetic Applications, v. 19, no. 4, pp. 428-443, Dec. 2020, doi: 10.1590/2179-10742020v19i4941
https://doi.org/10.1590/2179-10742020v19...
] and the complementations proposed in this study are shown in Fig. 1.

Flowchart of the work methodology. Blocks in red indicate the new steps in relation to work [33 C. R. Gomes, I. R. Gomes, R. L. Fraiha Lopes, H. S. Gomes, and G. P. S. Cavalcante, “Optimum Positioning of Base Station for Cellular Service Devices using Discrete Knowledge Model,” Journal of Microwaves, Optoelectronics and Electromagnetic Applications, v. 19, no. 4, pp. 428-443, Dec. 2020, doi: 10.1590/2179-10742020v19i4941
https://doi.org/10.1590/2179-10742020v19... ].
IV. PRIORITY CRITERIA AND SCENARIO DIVISION
The UFPA campus area was discretized into 652 squares of side 50 m. For each of the squares, a building and a vegetation criterion were assigned. They are: 1) Cleared, usually streets, areas of undergrowth or without vegetation; 2) Afforestation, characterized by dense green areas; 3) Building, characterized by buildings and masonry structures; 4) Afforestation + Building, combination of environments 1) and 2). The insertion of the values of the attributes was done manually. That is, in the position matrix, information about the 652 squares was inserted, one by one.
In this study, in order to improve the optimization of the positioning of the antennas, it was considered some aspects that approach a real condition, in which the towers must meet a priority of audiences, either by the demand of users or by the “importance” of these users. Therefore, the studied scenario (the UFPA campus in Belem) was partitioned into two large partitions. This is one of the differences of this study, when compared to work [33 C. R. Gomes, I. R. Gomes, R. L. Fraiha Lopes, H. S. Gomes, and G. P. S. Cavalcante, “Optimum Positioning of Base Station for Cellular Service Devices using Discrete Knowledge Model,” Journal of Microwaves, Optoelectronics and Electromagnetic Applications, v. 19, no. 4, pp. 428-443, Dec. 2020, doi: 10.1590/2179-10742020v19i4941
https://doi.org/10.1590/2179-10742020v19...
]. This partition was made so that the number of candidate sites in each of the partitions was similar, this fact is important for the optimization process described in item V of this article. Fig. 2 illustrates the studied scenario delimited by the purple lines, the transmitter antenna (red dot), the measured points (blue squares), the candidate locations (yellow triangles) and the red line that divides the region into two partitions.

Region under study (between purple lines) divided by the meridian (red line). Candidate points as yellow triangles, points measured as the blue square and transmitter shown as a red circle.
In this work, the division was accompanied by the following criteria: There cannot be more than one tower to be installed in a given partition.
The priority criterion adopted takes into consideration, basically, the type of terrain determined for each square of the grid. However, the typification of neighboring squares also influences the importance of a given square. In this work, neighboring squares in the cardinal directions are considered as neighbors: north (N), south (S), east (E) and west (W), as illustrated in Fig. 3a. A grid of 5 squares is considered, in order to know the value of the priority criterion of the central square (point P), it is necessary to know the type of terrain of each of the 4 squares that surround it. Each type of terrain has a value attached to it. These values are shown in Table I.

a) Neighboring points considered for calculating the importance; b) Illustration of an example on calculating importance.
The values shown in Table I were set based on our experience that attend the campus of UFPA. From these values, we take note of the types of land and the importance value of the 4 adjacent squares (as shown in Table I) and sum all these individual values of importance. This sum is considered the priority value of the analyzed square. For example (see Fig. 3b), a square surrounded by 4 type 3 neighbors (buildings), has an importance value of 40, the maximum allowed by the values adopted here. The importance valuation of each type of land can be changed, according to the needs of the project.
This procedure is replicated for all the grid squares, culminating in the plot of importance of the terrain, shown in Fig. 4. The effect of the priority criterion in this study is to optimize the number of people served. The more built up the mesh point, the more priority it will be to receive the signal.

Graph of Importance of the territory of UFPA. Warmer colors indicate most important regions. The red line indicates the meridian we used to divide the studied region.
When comparing with Fig. 2, we conclude that the main populated areas of UFPA coincide with the areas where there are more constructions. More constructions mean more people using them and therefore should be given more priority in signal coverage by the new RBS.
V. Optimization
The proposed improvements for [33 C. R. Gomes, I. R. Gomes, R. L. Fraiha Lopes, H. S. Gomes, and G. P. S. Cavalcante, “Optimum Positioning of Base Station for Cellular Service Devices using Discrete Knowledge Model,” Journal of Microwaves, Optoelectronics and Electromagnetic Applications, v. 19, no. 4, pp. 428-443, Dec. 2020, doi: 10.1590/2179-10742020v19i4941
https://doi.org/10.1590/2179-10742020v19...
] is related to the process used to calculate the optimal solution. We found the received power values from each square of the grid and, then, after all calculations, we evaluated which of the solutions best met the defined criteria. I.e, it used the “brute force” technique. In [33 C. R. Gomes, I. R. Gomes, R. L. Fraiha Lopes, H. S. Gomes, and G. P. S. Cavalcante, “Optimum Positioning of Base Station for Cellular Service Devices using Discrete Knowledge Model,” Journal of Microwaves, Optoelectronics and Electromagnetic Applications, v. 19, no. 4, pp. 428-443, Dec. 2020, doi: 10.1590/2179-10742020v19i4941
https://doi.org/10.1590/2179-10742020v19...
], the sole criterion was to cover the largest area possible. In this study, in addition to serving the largest possible area, the largest usable area of the studied space should be served. In addition, there is a limit on the number of towers within each partition of the UFPA territory. We have, then, three objectives to be simultaneously met, that is, a multiobjective problem.
In [33 C. R. Gomes, I. R. Gomes, R. L. Fraiha Lopes, H. S. Gomes, and G. P. S. Cavalcante, “Optimum Positioning of Base Station for Cellular Service Devices using Discrete Knowledge Model,” Journal of Microwaves, Optoelectronics and Electromagnetic Applications, v. 19, no. 4, pp. 428-443, Dec. 2020, doi: 10.1590/2179-10742020v19i4941
https://doi.org/10.1590/2179-10742020v19...
], there were 105 possibilities for solutions. There were 15 candidate locations and two towers to be allocated at these locations. So there were = 105 options. They were all calculated. Even if, within these options, there were possibilities in which the towers were close enough to generate an intersection area of significant coverage, thus making these solutions, in practice, unfeasible.
In this work, with the separation of the scenario studied in two parts, without changing the number of candidate sites, we have a total of less possibilities than the 105 of the work [33 C. R. Gomes, I. R. Gomes, R. L. Fraiha Lopes, H. S. Gomes, and G. P. S. Cavalcante, “Optimum Positioning of Base Station for Cellular Service Devices using Discrete Knowledge Model,” Journal of Microwaves, Optoelectronics and Electromagnetic Applications, v. 19, no. 4, pp. 428-443, Dec. 2020, doi: 10.1590/2179-10742020v19i4941
https://doi.org/10.1590/2179-10742020v19...
]. In one partition (left, as shown in Fig. 2) we have 8 candidate points. In the other we have 7. The following demonstration illustrates the effect of a partition on reducing possibilities for problems like this.
Theorem: Let n be the total number of local candidates, r the number of candidate locations in the partition A and n-r the number of candidate locations in the partition B. Prove that
Considering that
it follows that
Thus, proving (1) is the same as proving
Through the analysis of the behavior of the right side of (6), it is noted that its maximum value occurs when . If n is even, there is nothing to consider. If n is odd, you have to and (or vice versa) will maximize the right side of (6). In short, the right side of (6) is maximum when
So, if (here we will do the calculation for the case when n is even, for the odd case, we can say that the process is analogous), then
The inequality (8) is valid for n ≥ 3 (initial hypothesis about variable n). This concludes the demonstration.
In the case studied in this work, we have n = 15, r = 8 e n − r = 7. This implies that . It must be remembered that is the number of possible solutions for the case studied. This is a consequence of splitting the original region into two parts. is the number of possible solutions presented in [33 C. R. Gomes, I. R. Gomes, R. L. Fraiha Lopes, H. S. Gomes, and G. P. S. Cavalcante, “Optimum Positioning of Base Station for Cellular Service Devices using Discrete Knowledge Model,” Journal of Microwaves, Optoelectronics and Electromagnetic Applications, v. 19, no. 4, pp. 428-443, Dec. 2020, doi: 10.1590/2179-10742020v19i4941
https://doi.org/10.1590/2179-10742020v19...
]. Comparing the number of possibilities, it follows that, with the advent of the meridian and the original partition region, we obtained a reduction of approximately 47% of the number of possible solutions to the problem, after all, . Therefore, the reduction, now denoted with the use of percentages, can be calculated by (1 − 0.53) x 100% = 46.6%.
VI. Results
In this section, we discuss the results obtained from the optimization of the position of the transmitting towers within UFPA. The received power must be maximized considering the importance of each location on the map considered. These results are compared with the results shown in [33 C. R. Gomes, I. R. Gomes, R. L. Fraiha Lopes, H. S. Gomes, and G. P. S. Cavalcante, “Optimum Positioning of Base Station for Cellular Service Devices using Discrete Knowledge Model,” Journal of Microwaves, Optoelectronics and Electromagnetic Applications, v. 19, no. 4, pp. 428-443, Dec. 2020, doi: 10.1590/2179-10742020v19i4941
https://doi.org/10.1590/2179-10742020v19...
], i.e., the results of the original version of the tool, in which neither the priority criterion nor the restriction of RBS per partition existed in the tool.
We simulated two scenarios considering both the frequencies of 2.1 GHz and 2.6 GHz. The same scenarios as in [33 C. R. Gomes, I. R. Gomes, R. L. Fraiha Lopes, H. S. Gomes, and G. P. S. Cavalcante, “Optimum Positioning of Base Station for Cellular Service Devices using Discrete Knowledge Model,” Journal of Microwaves, Optoelectronics and Electromagnetic Applications, v. 19, no. 4, pp. 428-443, Dec. 2020, doi: 10.1590/2179-10742020v19i4941
https://doi.org/10.1590/2179-10742020v19...
]. These are: 1) Two transmitting towers, when the influence of the existing tower close to UFPA is not considered; 2) Three transmitting towers, one of which is the existing tower in the vicinity of UFPA, the same from where the measured data were collected.
Fifteen candidate sites, internal to UFPA, were chosen for the positioning of the new transmission towers. These locations are the same in both scenarios (two and three new towers). In order to approach a real project, it was decided to limit the number of candidate sites.
For each square of the grid (there are 652), we calculated the value of power loss in each of the possible combinations of the towers. It is, essentially, a (complete) problem of combinatorial optimization in which all solutions have to be verified. As there are 15 candidate sites (in the whole scenario considered) for the positioning of two transmission towers, it is clear that the total possible results in [33 C. R. Gomes, I. R. Gomes, R. L. Fraiha Lopes, H. S. Gomes, and G. P. S. Cavalcante, “Optimum Positioning of Base Station for Cellular Service Devices using Discrete Knowledge Model,” Journal of Microwaves, Optoelectronics and Electromagnetic Applications, v. 19, no. 4, pp. 428-443, Dec. 2020, doi: 10.1590/2179-10742020v19i4941
https://doi.org/10.1590/2179-10742020v19...
] is given by the value of C15,2.
The time to optimize each scenario in [33 C. R. Gomes, I. R. Gomes, R. L. Fraiha Lopes, H. S. Gomes, and G. P. S. Cavalcante, “Optimum Positioning of Base Station for Cellular Service Devices using Discrete Knowledge Model,” Journal of Microwaves, Optoelectronics and Electromagnetic Applications, v. 19, no. 4, pp. 428-443, Dec. 2020, doi: 10.1590/2179-10742020v19i4941
https://doi.org/10.1590/2179-10742020v19...
] was 23 minutes and 53 seconds. With the use of the meridional division, the number of possible scenarios is given by the multiplication n1 × n2, with n1 the number of candidate sites on one side of the hemisphere and n2 the number of candidate locations on the other partition. The optimization program described in this work takes 6 minutes and 30 seconds to obtain the optimal solution. We note, then, how significant the reduction in processing time was, approximately four times faster. In percentage terms, the reduction was approximately 72.3%.
All calculations performed in this paper performed on a portable computer with a processor Intel® Core™ i5-6200 CPU with 2.3 GHz - 2.4 GHz and 8 GB RAM memory in its default settings.
A. Scenario 1: Two Towers
The two-tower scenario can be interpreted as a coverage project in a region not served by a telecommunications service. The criterion for optimization was that the average power received at all points was as high as possible, considering the importance of each region on the map. This prioritizes the location of the towers in regions considered most important.
Fig. 5a shows the result obtained by [33 C. R. Gomes, I. R. Gomes, R. L. Fraiha Lopes, H. S. Gomes, and G. P. S. Cavalcante, “Optimum Positioning of Base Station for Cellular Service Devices using Discrete Knowledge Model,” Journal of Microwaves, Optoelectronics and Electromagnetic Applications, v. 19, no. 4, pp. 428-443, Dec. 2020, doi: 10.1590/2179-10742020v19i4941
https://doi.org/10.1590/2179-10742020v19...
] of the optimization for the case of two towers at the frequency of 2.1 GHz and Fig. 5b for the frequency of 2.6 GHz. Fig. 5c and 5d show the results of the optimization in the scenario of two towers obtained by the multiobjective methodology for 2.1 GHz and 2.6 GHz, respectively. Warmer colors indicate more power received.

Optimization for two towers. a) and b) refer to results of work [33 C. R. Gomes, I. R. Gomes, R. L. Fraiha Lopes, H. S. Gomes, and G. P. S. Cavalcante, “Optimum Positioning of Base Station for Cellular Service Devices using Discrete Knowledge Model,” Journal of Microwaves, Optoelectronics and Electromagnetic Applications, v. 19, no. 4, pp. 428-443, Dec. 2020, doi: 10.1590/2179-10742020v19i4941
https://doi.org/10.1590/2179-10742020v19... ]. c) and d) obtained by the multiobjective methodology for 2.1 GHz and 2.6 GHz, respectively. Transmitting towers located in the centers of the hottest regions of the map. Received power levels (see color bar in the right side of the figures) measured in dBm.
There is a clear change between the solutions found in [33 C. R. Gomes, I. R. Gomes, R. L. Fraiha Lopes, H. S. Gomes, and G. P. S. Cavalcante, “Optimum Positioning of Base Station for Cellular Service Devices using Discrete Knowledge Model,” Journal of Microwaves, Optoelectronics and Electromagnetic Applications, v. 19, no. 4, pp. 428-443, Dec. 2020, doi: 10.1590/2179-10742020v19i4941
https://doi.org/10.1590/2179-10742020v19...
] and those in this work. In this case, both towers were moved to the left, following the density of existing buildings on the campus. The left side of the figures contains several classroom pavilions and the entire UFPA administrative sector. The central region (close to the meridian, however on both sides) contains other class pavilions and different laboratory buildings. The right side is sparsely populated and composed, predominantly, of dense vegetation. Thus, the solution found with the multiobjective methodology and with the criterion of only one tower per hemisphere is in line with the wishes of the UFPA campus community. Even in densely populated spaces and of extreme importance for the development of academic activities, there are still many “shaded areas”, in which there is simply no signal connectivity for cellular services and /or mobile internet.
In this scenario, with only two RBS positioned at the UFPA facilities, the contribution of the additions proposed in this work is already noticeable in improving the results obtained in [33 C. R. Gomes, I. R. Gomes, R. L. Fraiha Lopes, H. S. Gomes, and G. P. S. Cavalcante, “Optimum Positioning of Base Station for Cellular Service Devices using Discrete Knowledge Model,” Journal of Microwaves, Optoelectronics and Electromagnetic Applications, v. 19, no. 4, pp. 428-443, Dec. 2020, doi: 10.1590/2179-10742020v19i4941
https://doi.org/10.1590/2179-10742020v19...
]. Although this is a hypothetical scenario, since there are RBS outside UFPA that are able to serve, even if partially, the rightmost region of the analyzed map. This reality will be discussed in the next subsection, which deals with the simulations considering three towers (two RBS inside UFPA and an external one already existing and represented in Fig. 2 by a red dot in the northeast region).
B. Scenario 2: Three Towers
The same criteria were applied in the scenario with three towers. In [33 C. R. Gomes, I. R. Gomes, R. L. Fraiha Lopes, H. S. Gomes, and G. P. S. Cavalcante, “Optimum Positioning of Base Station for Cellular Service Devices using Discrete Knowledge Model,” Journal of Microwaves, Optoelectronics and Electromagnetic Applications, v. 19, no. 4, pp. 428-443, Dec. 2020, doi: 10.1590/2179-10742020v19i4941
https://doi.org/10.1590/2179-10742020v19...
] the results of this scenario guaranteed the maximum coverage area, but did not necessarily guarantee that the covered area was an important area of the campus. This was due to the existence of a tower in the outskirts of UFPA (the same transmitting antenna from which the measurement data were collected). As the work of [33 C. R. Gomes, I. R. Gomes, R. L. Fraiha Lopes, H. S. Gomes, and G. P. S. Cavalcante, “Optimum Positioning of Base Station for Cellular Service Devices using Discrete Knowledge Model,” Journal of Microwaves, Optoelectronics and Electromagnetic Applications, v. 19, no. 4, pp. 428-443, Dec. 2020, doi: 10.1590/2179-10742020v19i4941
https://doi.org/10.1590/2179-10742020v19...
] did not use a multiobjective optimization, the results, although good, can be improved.
Fig. 6a and 6b show the coverage maps from the three towers scenario of [33 C. R. Gomes, I. R. Gomes, R. L. Fraiha Lopes, H. S. Gomes, and G. P. S. Cavalcante, “Optimum Positioning of Base Station for Cellular Service Devices using Discrete Knowledge Model,” Journal of Microwaves, Optoelectronics and Electromagnetic Applications, v. 19, no. 4, pp. 428-443, Dec. 2020, doi: 10.1590/2179-10742020v19i4941
https://doi.org/10.1590/2179-10742020v19...
] for the frequencies of 2.1 GHz and 2.6 GHz, respectively. Fig. 6c and 6d show, respectively, the results for 2.1 GHz and 2.6 GHz obtained by multiobjective methodology proposed here. Warmer colors indicate more power received.
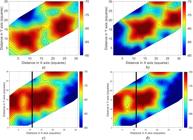
Optimization for three towers. a) and b) refer to results of work [33 C. R. Gomes, I. R. Gomes, R. L. Fraiha Lopes, H. S. Gomes, and G. P. S. Cavalcante, “Optimum Positioning of Base Station for Cellular Service Devices using Discrete Knowledge Model,” Journal of Microwaves, Optoelectronics and Electromagnetic Applications, v. 19, no. 4, pp. 428-443, Dec. 2020, doi: 10.1590/2179-10742020v19i4941
https://doi.org/10.1590/2179-10742020v19... ]. c) and d) results for 2.1 GHz and 2.6 GHz obtained by multiobjective methodology. Transmitting towers located in the centers of the hottest regions of the map. Received power levels (see color bar in the right side of the figures) measured in dBm.
It is noted that the optimal solution found for this scenario was the same as that of two towers, despite the influence of the external tower. This is due to the fact that there is a concentration of priority sites attracting the positioning of the new towers to the lower left region of the map. In this scenario, however, the influence of the existing external tower contributes to the coverage in the upper right area of the map. In the scenario of two towers, which represents a hypothesis where the external tower did not exist, there was practically no coverage in this region.
In comparison with the results of [33 C. R. Gomes, I. R. Gomes, R. L. Fraiha Lopes, H. S. Gomes, and G. P. S. Cavalcante, “Optimum Positioning of Base Station for Cellular Service Devices using Discrete Knowledge Model,” Journal of Microwaves, Optoelectronics and Electromagnetic Applications, v. 19, no. 4, pp. 428-443, Dec. 2020, doi: 10.1590/2179-10742020v19i4941
https://doi.org/10.1590/2179-10742020v19...
], it is noted that in that work, the RBS positioning solutions for 2.1 GHz and 2.6 GHz were different. The solution shown in [33 C. R. Gomes, I. R. Gomes, R. L. Fraiha Lopes, H. S. Gomes, and G. P. S. Cavalcante, “Optimum Positioning of Base Station for Cellular Service Devices using Discrete Knowledge Model,” Journal of Microwaves, Optoelectronics and Electromagnetic Applications, v. 19, no. 4, pp. 428-443, Dec. 2020, doi: 10.1590/2179-10742020v19i4941
https://doi.org/10.1590/2179-10742020v19...
] for 2.6 GHz ends up excluding important points in the UFPA area, concentrated in the lower left corner of the map. In the present work, however, regardless of frequency and existence or not of the external RBS, the most important regions of UFPA were well attended.
The optimization we propose here, as any other technique of the kind, aims to find an optimal solution. That is not, necessarily, the ideal solution. In the present study we have a multiobjective problem whose goal is to attend the greatest area possible and the most users possible restricted to two RBS in the premises of UFPA. Due to a resource limitation, it is natural that some regions, even with some importance may not be well attended. This is the case of the region described by distance in x axis equal to 26 and distance in y axis equal to 16.
VII. Conclusions
This article presented a multiobjective methodology for optimizing RBS positioning. The proposed methodology aims to improve the work [33 C. R. Gomes, I. R. Gomes, R. L. Fraiha Lopes, H. S. Gomes, and G. P. S. Cavalcante, “Optimum Positioning of Base Station for Cellular Service Devices using Discrete Knowledge Model,” Journal of Microwaves, Optoelectronics and Electromagnetic Applications, v. 19, no. 4, pp. 428-443, Dec. 2020, doi: 10.1590/2179-10742020v19i4941
https://doi.org/10.1590/2179-10742020v19...
] with the following objectives: i) Meet the largest coverage; ii) Serve the largest number of users; the latter based on a selection of priority service locations. The partitioning of the studied scenario brought a mathematical gain in the amount of possible solutions to be considered: a reduction of about 46.6%. The methodology we used is of low cost, as it used free mobile applications for empirical knowledge of those attending the studied scenario. The results obtained show an improvement in the positioning of the antennas, both in the scenario of two and three towers (one already existing). The antennas would serve the areas where there is a greater number of users. In addition, the computational cost/execution time of the program was reduced by approximately 72.3%. This work presented improvements in the optimization of ERB so that it can be applied in other scenarios, using a small amount of data and a notion about the distribution of users. For future work, it is expected to apply this methodology in other scenarios, thus corroborating, with the proposed methodology.
ACKNOWLEDGMENT
We are grateful to the Brazilian Coordination for the Improvement of Higher Education Personnel (CAPES) for its financial support. The authors would also like to thank the Federal University of Para (UFPA) for the technical assistance given to the research undertaken in this paper.
REFERENCES
-
1International Telecommunications Union, Recommendation ITU-R P. 1546-5. Method to point-to-area predictions for terrestrial services in the frequency range of 30 MHz to 3000 MHz 2019.
-
2T. S. Rappaport, Wireless Communications: Principles and Practice Prentice Hall, 2nd edition. 2002.
-
3C. R. Gomes, I. R. Gomes, R. L. Fraiha Lopes, H. S. Gomes, and G. P. S. Cavalcante, “Optimum Positioning of Base Station for Cellular Service Devices using Discrete Knowledge Model,” Journal of Microwaves, Optoelectronics and Electromagnetic Applications, v. 19, no. 4, pp. 428-443, Dec. 2020, doi: 10.1590/2179-10742020v19i4941
» https://doi.org/10.1590/2179-10742020v19i4941 -
4Y. S. Meng, Y. H. Lee and B C. Ng, “Further study of rainfall effect on VHF forested radio-wave propagation with four layered model,” Progress in electromagnetics research-PIER99, pp.149-161, 2009.
-
5A. Taufique, M. Jaber, A. Imran, Z. Dawy and E. Yacoub, “Planning Wireless Cellular Networks of Future: Outlook, Challenges and Opportunities,” IEEE Access, vol. 5, pp. 4821-4845, 2017, doi: 10.1109/ACCESS.2017.2680318.
» https://doi.org/10.1109/ACCESS.2017.2680318 -
6I. R. Gomes, C. R. Gomes, H. S. Gomes, G. P. S. Cavalcante, “Empirical radio propagation model for DTV applied to non- homogeneous paths and different climates using machine learning techniques”. PLoS ONE, vol. 13, no. 3, Mar. 2018, doi: e0194511. https://doi.org/10.1371/journal.pone.0194511
» https://doi.org/10.1371/journal.pone.0194511 -
7N. S. Nkordeh, et al., “LTE Network Planning using the Hata-Okumura and the COST-231 Hata Pathloss Models,” World Congress on Engineering, London, 2014.
-
8X. Cai, C. Zhang, J. Rodríguez-Piñeiro, X. Yin, W. Fan and G. F. Pedersen, “Interference Modeling for Low-Height Air-to-Ground Channels in Live LTE Networks,” IEEE Antennas and Wireless Propagation Letters, vol. 18, no. 10, pp. 2011-2015, Oct. 2019, doi: 10.1109/LAWP.2019.2936264.
» https://doi.org/10.1109/LAWP.2019.2936264 -
9J. E. Arévalo Peña, “Correlation analysis of propagation models for the design of a LTE - A network”, 2016 IEEE International Engineering Summit, II Cumbre Internacional de las Ingenierias (IE-Summit), Boca del Rio, Mexico, 2016, pp. 1-5, doi: 10.1109/IESummit.2016.7459775.
» https://doi.org/10.1109/IESummit.2016.7459775 -
10S. Makridakis, E. Spiliotis, V. Assimakopoulos, “Statistical and Machine Learning forecasting methods: Concerns and ways forward,” PLoS ONE, vol. 13, no. 3, Mar. 2018, doi: e0194889. https://doi.org/10.1371/journal.pone.0194889
» https://doi.org/10.1371/journal.pone.0194889 -
11Z. He et al., “Multiobjective Reservoir Operation Optimization Using Improved Multiobjective Dynamic Programming Based on Reference Lines”, IEEE Access, vol. 7, pp. 103473-103484, 2019, doi: 10.1109/ACCESS.2019.2929196.
» https://doi.org/10.1109/ACCESS.2019.2929196 -
12X. Yu et al., “Set-Based Discrete Particle Swarm Optimization Based on Decomposition for Permutation-Based Multiobjective Combinatorial Optimization Problems,” IEEE Transactions on Cybernetics, vol. 48, no. 7, pp. 2139-2153, July 2018, doi: 10.1109/TCYB.2017.2728120.
» https://doi.org/10.1109/TCYB.2017.2728120 -
13C. R. Gomes, D. K. N. Silva, J. Araujo, H. S. Gomes, G. P. S. Cavalcante, “Radio-Wave Propagation Model for UHF Band in Different Climatic Conditions with Dyadic Green's Function”, J. Microw., Optoelectronics and Electromagn. Appl., vol. 14, pp. 60-72, 2015. doi: 10.1590/2179-10742015v14i1427.
» https://doi.org/10.1590/2179-10742015v14i1427 -
14J. Košmerl and A. Vilhar, “Base stations placement optimization in wireless networks for emergency communications”. 2014 IEEE International Conference on Communications Workshops (ICC), 2014, pp. 200-205, doi: 10.1109/ICCW.2014.6881196.
» https://doi.org/10.1109/ICCW.2014.6881196 -
15S. K. Goudos, P. D. Diamantoulakis and G. K. Karagiannidis, “Multi-Objective Optimization in 5G Wireless Networks With Massive MIMO”, in IEEE Communications Letters, vol. 22, no. 11, pp. 2346-2349, Nov. 2018, doi: 10.1109/LCOMM.2018.2868663.
» https://doi.org/10.1109/LCOMM.2018.2868663
Publication Dates
-
Publication in this collection
15 Nov 2021 -
Date of issue
Dec 2021
History
-
Received
19 Apr 2021 -
Reviewed
24 May 2021 -
Accepted
18 Sept 2021


