
Abstract
Studies of leaf surface are important for the ecophysiological context. We tested 12 allometric equations to estimate the leaf area of the endemic species Erythroxylum pauferrense Plowman, using different morphometric measurements (n = 600). The analysis of variance (p < 0.001), determination coefficient (R2adj), standard error of estimates (Sxy), and graphical interpretation of the dispersion of errors were used to select the models. The residual bias was estimated through the confidence interval using t-Student distribution (p = 0.01). Simple linear equations (Ŷ = 0.0244 + 0.7204 × CxL) and power functions (Ŷ = 0.7279 × CxL0.9971) were validated from an independent sample of leaves, confirming their accuracy. The results are important to guide actions of conservation of the endemic species.
Keywords:
Erythroxylaceae; allometry; leaf area
1. INTRODUCTION AND OBJECTIVES
Leaf area is a key characteristic of ecophysiological investigations, since the study of leaves is essential for understanding the functioning of ecosystems by the consistency of their chemical, structural and physiological properties (Díaz et al., 2016Díaz S, Kattge J, Cornelissen JHC, Wright IJ, Lavorel S, Dray S et al. The global spectrum of plant form and function. Nature 2016; 529: 167-171. 10.1038/nature16489
https://doi.org/10.1038/nature16489...
; Wright et al., 2004Wright IJ, Reich PB, Westoby M, Ackerly DD, Baruch Z, Bongers F et al. The worldwide leaf economics spectrum. Nature 2004; 428(6985): 821-827. 10.1038/nature02403
https://doi.org/10.1038/nature02403...
). Besides, leaves are a fundamental unit in processes such as light interception, temperature regulation, and water balance (Ehleringer, 2017Ehleringer J. Fotossíntese: considerações fisiológicas e ecológicas. In: Taiz L, Zeiguer E, Møller I, Murphy A, editors. Fisiologia e desenvolvimento vegetal. 6th ed. Porto Alegre: Artmed; 2017. p. 245-268.), and its measurement is important to evaluate plant development and their photosynthetic processes (Liu et al., 2017Liu Z, Zhu Y, Li F, Jin G. Non-destructively predicting leaf area, leaf mass and specific leaf area based on a linear mixed-effect model for broadleaf species. Ecological Indicators 2017; 78: 340-350. 10.1016/j.ecolind.2017.03.025). Temperature, climatic and microclimatic factors may limit the anatomy and architecture of leaves (Wright et al., 2004Wright IJ, Reich PB, Westoby M, Ackerly DD, Baruch Z, Bongers F et al. The worldwide leaf economics spectrum. Nature 2004; 428(6985): 821-827. 10.1038/nature02403
https://doi.org/10.1038/nature02403...
). In ecological studies, the leaf area is used to evaluate the effects of management, competition among species, and to conservation, providing information about the adaptation of morphological and functional groups of plants in the most diverse habitats (Cornelissen et al., 2003Cornelissen JHC, Lavorel S, Garnier E, Díaz S, Buchmann N, Gurvich DE et al. A handbook of protocols for standardised and easy measurement of plant functional traits worldwide. Australian Journal of Botany 2003; 51(4): 335-380. 10.1071/BT02124
https://doi.org/10.1071/BT02124...
; Dainese et al., 2015Dainese M, Leps J, De Belo F. Different effects of elevation, habitat fragmentation and grazing management on the functional, phylogenetic and taxonomic structure of mountain grasslands. Perspectives in Plant Ecology, Evolution and Systematics 2015; 17(1): 44-53. 10.1016/j.ppees.2014.09.002
https://doi.org/10.1016/j.ppees.2014.09....
; Pérez-Harguindeguy et al., 2013Pérez-Harguindeguy N, Díaz S, Garnier E, Lavorel S, Poorter H, Jaureguiberry P et al. New handbook for standardised measurement of plant functional traits worldwide. Australian Journal of Botany 2013; 61(3): 167-234. 10.1071/BT12225
https://doi.org/10.1071/BT12225...
; Sfair et al., 2016Sfair JC, Rosado BHP, Tabarelli M. The effects of environmental constraints on plant community organization depend on which traits are measured. Journal of Vegetation Science 2016; 27(6): 1264-1274. 10.1111/jvs.12453
https://doi.org/10.1111/jvs.12453...
).
The methods for estimation of leaf area are classified as destructive and non-destructive. Models based on leaf area estimation using linear leaf dimensions of several species are common (Bianco et al., 2004Bianco S, Pitelli RA, Carvalho LB. Estimativa da área foliar de Tridax procumbens usando dimensões lineares do limbo foliar. Revista Planta Daninha 2004; 22(2): 247-250. 10.1590/S0100-83582004000200011
https://doi.org/10.1590/S0100-8358200400...
; Coelho Filho et al., 2005Coelho Filho MA, Angelocci LR, Vasconcelos MRB, Coelho EF. Estimativa da área foliar de plantas de lima ácida ‘tahiti’ usando métodos não-destrutivos. Revista Brasileira de Fruticultura 2005; 27(1): 163-167. 10.1590/S0100-29452005000100043
https://doi.org/10.1590/S0100-2945200500...
; Maracajá et al., 2008Maracajá PB, Madalena JAS, Araújo E, Lima BG, Linhares PCF. Estimativa da área foliar de juazeiro por dimensões lineares do limbo foliar. Revista Verde de Agroecologia 2008; 3(4): 1-5.; Schmildt et al., 2016Schmildt ER, Oliari LS, Schmildt O, Alexandre RS, Pires FR. Determinação da área foliar de Passiflora mucronata a partir de dimensões lineares do limbo foliar. Revista Agroambiente Online 2016; 10(4): 351-357.; Silva et al., 2013Silva GH, Queiroz JE, Neto AGS. Avaliação da área foliar de três espécies florestais ocorrentes no semiárido paraibano (Amburana cearensis, Caesalpinia ferrea, Caesalpinia pyramidalis). Revista de Biologia e Farmácia 2013; 9(3): 1-11.) and promising in relation to more expensive methods of measurement; besides, it is a reliable alternative for the evaluation of the area of many leaf species. However, a good estimation by the models depends on sample range (all leaf size variation), morphological characteristics (e.g., the shape of the lamina, number of lobes, leaflets), and should represent the complete allometric expansion pattern of a species. Modeling to obtain leaf area estimation emerges as an excellent tool for forest science field.
Information on the ecophysiology of species such as Erythroxylum pauferrense Plowman are scarce. E. pauferrense is an endemic species of Paraíba, Northeast region of Brazil; it can reach 1.5 m to 4 m in height, inhabits the understory vegetation and develops under limited light conditions (Loiola et al., 2007Loiola MIB, Agra MF, Baracho GS, Queiroz RT. Flora da Paraíba, Brasil: Erythroxylaceae Kunth. Acta Botânica Brasílica 2007; 21(2): 473-487. 10.1590/S0102-33062007000200020
https://doi.org/10.1590/S0102-3306200700...
; Plowman, 1986Plowman T. Four new species of Erythroxylum (Erythroxylaceae) from Northeastern Brazil. Brittonia 1986; 38(3): 189-200. 10.2307/2807336
https://doi.org/10.2307/2807336...
). The species was recently discovered in botanical (Loiola et al., 2007Loiola MIB, Agra MF, Baracho GS, Queiroz RT. Flora da Paraíba, Brasil: Erythroxylaceae Kunth. Acta Botânica Brasílica 2007; 21(2): 473-487. 10.1590/S0102-33062007000200020
https://doi.org/10.1590/S0102-3306200700...
) and phytosociological terms (Andrade et al., 2006Andrade LA, Oliveira FX, Nascimento IS, Fabricante JR, Sampaio EVSB, Barbosa MRV. Análise florística e estrutural de matas ciliares ocorrentes em brejo de altitude no município de Areia, Paraíba. Revista Brasileira de Ciências Agrárias 2006; 1(1): 31-40.; Barbosa et al., 2004Barbosa MRV, Agra, MF, Sampaio EVSB, Cunha JP, Andrade LA. Diversidade florística da Mata do Pau-Ferro, Areia, Paraíba. In: Pôrto KC, Cabral JJP, Tabarelli M, editors. Brejos de altitude em Pernambuco e Paraíba: história natural, ecologia e conservação. Brasília: Ministério do Meio Ambiente; 2004. p. 111-122. (Série Biodiversidade 9).; Queiroz et al., 2006Queiroz JA, Trovão DMBM, Oliveira AB, Oliveira ÉCS. Análise da estrutura fitossociológica da Serra do Monte, Boqueirão, Paraíba. Revista de Biologia e Ciências da Terra 2006; 6(2): 251-259.), and the ecophysiological aspects are little known. The taxon has an endemic distribution restricted to one of the devastated sectors of the Atlantic Forest - of the Alto-Montana forest - and is listed as a critically endangered species partially due to its restricted phytogeographic distribution.
The subpopulations of E. pauferrense remain isolated and the number of individuals is declining due to habitat degradation (CNCFlora, 2012Centro Nacional de Conservação da Flora - CNCFlora. Erythroxylum pauferrense Plowman. CNCFlora [ Internet]. Lista Vermelha; 2012 Sept. 26 [cited 2017 Sept. 1]. Available from: Available from: https://bit.ly/2KxYpyI
https://bit.ly/2KxYpyI...
). Studies aiming at monitoring and conserving the genetic resources of the species should help its recovery and conservation. Therefore, ecophysiological studies, such as leaf area-related, indicate the species’ performance against its habitat and subsidizes conservation actions for endemic genetic resources.
We expect that information at the organism level will add value to the knowledge of the species ecology and contribute to the conservation of native forest heritage, as well as fostering new researches. This work aimed to select and validate the equation that best estimates and fits the data of leaf area for E. pauferrense. Therefore, we tested different allometric models using several leave morphometric measures and selected the best fit model according to the accuracy, precision, and reliability.
2. MATERIALS AND METHODS
2.1. Characterization of the area
The study was performed in Mata do Pau-Ferro State Park (coordinates: 6°58’12’S, 35°42’15’W), located in the city of Areia-PB, Brazil (Figure 1). The park has approximately 600 ha, is the largest remnant of Brejo de Altitude in the state of Paraíba, thus, it is an essential habitat for the preservation of E. pauferrense (Barbosa et al., 2004Barbosa MRV, Agra, MF, Sampaio EVSB, Cunha JP, Andrade LA. Diversidade florística da Mata do Pau-Ferro, Areia, Paraíba. In: Pôrto KC, Cabral JJP, Tabarelli M, editors. Brejos de altitude em Pernambuco e Paraíba: história natural, ecologia e conservação. Brasília: Ministério do Meio Ambiente; 2004. p. 111-122. (Série Biodiversidade 9).). The phytophysiognomy is a type of Ombrophilous Dense Forest, that is, Open Ombrophilous Forest (IBGE, 2012Instituto Brasileiro de Geografia e Estatística - IBGE. Manuais técnicos em geociências: manual técnico da vegetação brasileira. Rio de Janeiro: IBGE; 2012.).

The relief of the region is characterized as wavy (slopes f 8% to 20%) to strongly wavy (slopes of 20% to 45%). The climate is as according to Köppen-Geiger classification, described as hot and humid with autumn and winter rains (Kottek et al., 2006Kottek M, Grieser J, Beck C, Rudolf B, Rubel F. World map of the Köppen-Geiger climate classification updated. Meteorologische Zeitschrift 2006; 15(3): 259-263. 10.1127/0941-2948/2006/0130
https://doi.org/10.1127/0941-2948/2006/0...
).
2.2. Data sampling
Thirty individuals of E. pauferrense were selected throughout the study area and 600 leaves were collected (healthy and free from any damage caused by herbivory), covering all the intraspecific variation of leaves in the area (from regenerating individuals to adult). The different canopy levels of the understory were also used as a selection criterion for leaves. Sampling was made from August 2015 to September 2016.
The leaves were stored in dark, moistened plastic bags (Pérez-Harguindeguy et al., 2013Pérez-Harguindeguy N, Díaz S, Garnier E, Lavorel S, Poorter H, Jaureguiberry P et al. New handbook for standardised measurement of plant functional traits worldwide. Australian Journal of Botany 2013; 61(3): 167-234. 10.1071/BT12225
https://doi.org/10.1071/BT12225...
) and analyzed at the Laboratory of Plant Ecology (LEV) at the Federal University of Paraíba, Campus II (UFPB). All leaves were listed and then scanned through a digital scanner, and the images were processed through Image-Pro Plus® software version 4.0 (Media Cybernetics). Leaf area was measured in square millimeter (mm²) and converted to square centimeters (cm²). The maximum length (Lmax ) was measured as the greatest distance between the point of insertion of the petiole in the leaf limbus and the apex of the leaf. The maximum width (Wmax) was measured as the largest horizontal dimension to the main vein axis (Figure 2).

2.3. Theoretical models
Twelve models were tested, using combinations between the dimensional variables Lmax , Wmax and the leaf area values. All models were elaborated by the principle of simplicity and practicality. The leaf limbus was taken as the leaf area, the dependent variable in the models. The variables Lmax and Wmax and the product of the linear combination “Lmax × Wmax ” of each leaf were used as independent variables (Table 1).
2.4. Statistical analysis
The equations were fitted in the software R version 3.4.0 (“R Development Core Team”, 2019R Development Core Team: a language and environment for statistical computing. R Foundation for Statistical Computing. Vienna; 2019.). Model selection was performed based on the criteria: (i) significance of the analysis of variance (F test; p ≤ 0.01); (ii) the value of the coefficient of determination adjusted by the degrees of freedom (R²adj); (iii) the standard error of the estimate in absolute terms (Sxy); (iv) the mean square of residuals (MSresid.); and (v) the graphical pattern of errors dispersion in percentage terms (ei%). The dispersion pattern of the residues was verified for the total sample data following the statistical procedures for graphic interpretation (Graybill, 2000Graybill FA. Theory and application of the linear model. Pacific Grove: Duxbury Press; 2000.; Zuur et al., 2009Zuur AF, Ieno EN, Elphick CS. A protocol for data exploration to avoid common statistical problems. Methods in Ecology & Evolution 2009; 1(1): 3-14. 10.1111/j.2041-210X.2009.00001.x
https://doi.org/10.1111/j.2041-210X.2009...
).
For each model, the average deviation was tested (if equal to or different from zero, null and alternative hypotheses, respectively) (Equation 13) to infer the model accuracy. Errors close or equal to zero mean better model accuracy. Then, the confidence interval (CI) for the mean was calculated using the t-Student distribution (p > 0.01).
The combination of described criteria indicates the best-fitted equation for the estimation of leaf area.
2.5. Model validation
The selected models were submitted to a validation process. For the validation, a second independent sample of leaves was randomly collected (n = 200) during the same period of the main sample (n = 600). The leaf area, length and width of the new sample were measured according to the methodology previously used. Subsequently, the estimated and observed values of leaf area were compared using a Student’s t-test at 99% of confidence level (p = 0.01). The model validation with the independent sample of leaves aims to prove the stability and the significance of the parameters (Zar, 2010Zar JH. Bioestatistical analysis. 5th ed. New Jersey: Pearson; 2010.).
3. RESULTS
3.1. Leaf characteristics
The leaf area ranged from 0.13 cm2 to 19.24 cm², with an average of 7.75 cm² and standard deviation of 4.51 cm². A strong correlation between the linear measurements of the leaf and the observed leaf area was found (i.e., R2 adj from 0.9095 to 0.9977; p < 0.001) (Table 2). The equations 3, 6 and 12 best fitted the data showing the lower values of standard error of the estimation (Sxy) (Table 2).
Adjusted models for leaves of (E. pauferrense) with the respective regression coefficients (β0, β1), standard errors of estimates (Sxy), adjusted R-squared (R2 adj), the degree of freedom of residuals (DFresid), mean square of residuals (MSresid) and the dependent variable, leaf area (Ŷ) as a function of maximum length (Lmax ), maximum width (Wmax ) and the product Lmax × Wmax (L × W).
The modified models 10, 11 and 12 showed high coefficient of determination (0.96, 0.94 and 0.99, respectively) (Table 2), but the error differed from zero (Figure 3) by both the hypothesis test and the confidence interval, showing a bias in the distribution. The residuals of the modified power equations (Equations 7, 8 and 9) also differed from zero, therefore rejecting the null hypothesis of absence of bias (Figure 3). The linear models 1 and 2, power models 4 and 5, modified power models 7, 8 and 9, and the modified linear models 10 and 11 were discarded due to the bias of the residuals. A more detailed analysis of the results of the equations indicated a bias from 18.33% to 99.33%, considering errors ≥ 40%. The leaf area was underestimated by the equations 9 and 12 and overestimated by the equations 4, 5, 7, 8, 10 and 11, therefore these models were rejected. Besides, the residuals showed a non-homogeneous distribution (heteroscedasticity).
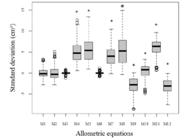
Asymmetry of the deviations for each allometric equation (1 to 12). The lower limit of the box indicates the 25th percentile; the lines inside the boxes denote the median; the upper limit of the box indicates the 75th percentile. The vertical lines above and below the box indicate the minimum and maximum values (outliers are shown as points). Asterisks (*) denote biased equations, according to confidence intervals calculated for the mean of the deviations (99% by Student’s t-distribution).
The equations 3 (linear model for relation with the product Lmax × Wmax ) and 6 (power model for relationship relation with the product Lmax × Wmax ) best fitted the data according to the analysis of deviation (Figure 3). The graphical interpretation of the residue dispersion analysis was important to verify the differences between the statistical parameters of equations (Zuur et al., 2009Zuur AF, Ieno EN, Elphick CS. A protocol for data exploration to avoid common statistical problems. Methods in Ecology & Evolution 2009; 1(1): 3-14. 10.1111/j.2041-210X.2009.00001.x
https://doi.org/10.1111/j.2041-210X.2009...
). A difference of estimation between the equations 3 and 6 was not found (Figure 4). Both equations showed significant determination coefficients (R2 adj) and low standard errors of estimates (Sxy) (Table 2), besides a low relative dispersion of residuals (Figure 5). The relative residues range from −26.29% to 11.22% (Figure 5a and b), are normal and constant, and reflect the unexplained variability for the measures of the leaves of E. pauferrense (= 7.5 ± 4.51 cm², mean and standard deviation, respectively). Equations using the length and width product (L × W) to describe leaf area are common for species with simple leaves (Cardozo et al., 2014Cardozo NP, Parreira MC, Panosso AR, Volpe CA. Modelagem da área foliar de duas cultivares de amendoim em função das dimensões lineares dos folíolos. Bioscience Journal 2014; 30(1): 101-107.; Maracajá et al., 2008Maracajá PB, Madalena JAS, Araújo E, Lima BG, Linhares PCF. Estimativa da área foliar de juazeiro por dimensões lineares do limbo foliar. Revista Verde de Agroecologia 2008; 3(4): 1-5.).

Dispersion diagram between leaf area and the product of maximum length and maximum width (L × W) of the leaves of E. pauferrense, using the linear model (A) and the power function (B).

Scatter plot of relative residues (Ei%) for E. pauferrense leaf area estimates by the linear model 3 (A) and power model 6 (B).
The low dispersion of the values of leaf area suggests a close correlation with the product L × W, justifying the good adjustment of the equations 3 and 6 (Figure 5a and b). The brackets highlight adjustment details and accuracy of the data around the mean for both large and small leaves.
Using the validation analysis, it was verified that the estimated values of leaf area were close to the observed for both linear (3) and power models (6), thus, a significant statistical difference between estimated and observed values was not found (Table 3). The models 3 and 6 are the most suitable for the estimation of leaf area of E. pauferrense for all size class, from initial to fully developed leaves.
4. DISCUSSION
The regression equations that estimate better the leaf area of Erythroxylum pauferrense were the simple linear (3) and power (6) models using the product of the maximum length and maximum width (L × W), which showed normality in the error distribution (homoscedasticity) and good adjustment for all statistical parameters. Our results agree with other studies using plants with simple leaves (Lima et al., 2012Lima RT, Souza PJOP, Rodrigues JC, Lima MJA. Modelos para estimativa da área foliar da mangueira utilizando medidas lineares. Revista Brasileira de Fruticultura 2012; 34(4): 974-980. 10.1590/S0100-29452012000400003
https://doi.org/10.1590/S0100-2945201200...
; Santos, 2016Santos JNB. Equações alométricas para estimativa de área foliar de espécies lenhosas de floresta ombrófila de terras baixas [thesis]. Recife: Departamento de Ciência Florestal, Universidade Federal Rural de Pernambuco; 2016.; Toebe et al., 2010Toebe M, Brum B, Lopes SJ, Cargnelutti Filho A, Silveira TR. Estimativa da área foliar de Crambe abyssinica por discos foliares e por fotos digitais. Revista Ciência Rural 2010; 40(2): 475-478. 10.1590/S0103-84782010000200036
https://doi.org/10.1590/S0103-8478201000...
). The product between maximum length and maximum width has proven to be a valid measure of leaf area also for the species Vernonia ferruginea (Less.) (Souza & Amaral, 2015Souza MC, Amaral CL. Non-destructive linear model for leaf area estimation in Vernonia ferruginea Less. Brazilian Journal of Biology 2015; 75(1): 152-156. 10.1590/1519-6984.09813
https://doi.org/10.1590/1519-6984.09813...
), Psidium cattleianum and Psychotria suterella (Moraes et al., 2013Moraes L, Santos RK, Wisser TZ, Krupek RA. Avaliação da área foliar a partir de medidas lineares simples de cinco espécies vegetais sob diferentes condições de luminosidade. Revista Brasileira de Biociências 2013; 11(4): 381-387.); but some studies found lower coefficient of determination for the relation between leaf and L × W for the species Crotalaria juncea L. (Cardozo et al., 2014Cardozo NP, Parreira MC, Panosso AR, Volpe CA. Modelagem da área foliar de duas cultivares de amendoim em função das dimensões lineares dos folíolos. Bioscience Journal 2014; 30(1): 101-107.). The results show the efficiency of the model with the product of the length and width as the predictor variable for the determination of leaf area, which may be related to a higher amount of information provided through the two dimensions (Boeger et al., 2009Boeger MRT, Biu C, Goldenberg R. Arquitetura foliar comparativa de Miconia sellowiana (DC.) Naudin (Melastomataceae) em diferentes fitofisionomias no estado do Paraná, Brasil. Acta Botanica Brasilica 2009; 23(3): 657-665. 10.1590/S0102-33062009000300005
https://doi.org/10.1590/S0102-3306200900...
; Monteiro et al., 2005Monteiro JEBA, Semelhas PC, Chiavegato EJ, Guiselini C, Santiago AV, Prela A. Estimação da área foliar do algodoeiro por meio de dimensões e massa das folhas. Bragantia 2005; 64(1): 15-24. 10.1590/S0006-87052005000100002
https://doi.org/10.1590/S0006-8705200500...
).
The equations determined by the simple linear models (1 and 2, using the variables maximum length and maximum width, respectively) were rejected despite their significance, also reported as inadequate by other studies since the relation with these variables does not expand in a completely linearly way (Williams & Martinson, 2003Williams L, Martinson TE. Nondestructive leaf area estimation of ‘Niagara’ and ‘DeChaunac’ grapevines. Scientia Horticulturae 2003; 98(4): 493-498. 10.1016/S0304-4238(03)00020-7
https://doi.org/10.1016/S0304-4238(03)00...
). All single dimension models, those that use only the length or width of leaves, have high values for the R²adj, but they were rejected due to the high residue deviation (Figure 3). Some researchers suggest that the use of the single-dimension models (Antunes et al., 2008Antunes WC, Pompelli MFD, Carretero FMD. Allometric models for non-destructive leaf area estimation in coffee (Coffea arabica and Coffea canephora). Annals of Applied Biology 2008; 153(1): 33-40. 10.1111/j.1744-7348.2008.00235.x
https://doi.org/10.1111/j.1744-7348.2008...
; Pompelli et al., 2012Pompelli MF, Antunes WC, Ferreira DTRG, Cavalcante PGS, Wanderley Filho HCL, Endres L. Allometric models for non-destructive leaf area estimation of Jatropha curcas. Biomass and Bioenergy 2012; 36(1): 77-85. 10.1016/j.biombioe.2011.10.010
https://doi.org/10.1016/j.biombioe.2011....
) which may reduce the amount of time and resources implemented in experiments despite the simplification. However, the use of single dimension models is not recommended to estimate leaf area of E. pauferrense.
Monteiro et al. (2005Monteiro JEBA, Semelhas PC, Chiavegato EJ, Guiselini C, Santiago AV, Prela A. Estimação da área foliar do algodoeiro por meio de dimensões e massa das folhas. Bragantia 2005; 64(1): 15-24. 10.1590/S0006-87052005000100002
https://doi.org/10.1590/S0006-8705200500...
) found good estimations using the length and width of the leaves carried out separately for cotton leaf (Gossypium hirsutum L.). However, similar to our results, Schmildt et al. (2017Schmildt ER, Belique ETM, Schmildt O. Modelos alométricos para determinação da área foliar de cacaueiro ‘PH-16’ em sombreamento e pleno sol. Revista Agroambiente Online 2017; 11(1): 47-55.) verified a better fit using the product between length and width for the leaf area of cacao tree (Theobroma cacao L.). Once again, the mathematical models using L × W are effective by presenting higher values of R². These results corroborate some studies with other species of different leaf morphological profiles (Cardozo et al., 2014Cardozo NP, Parreira MC, Panosso AR, Volpe CA. Modelagem da área foliar de duas cultivares de amendoim em função das dimensões lineares dos folíolos. Bioscience Journal 2014; 30(1): 101-107.; Maracajá et al., 2008Maracajá PB, Madalena JAS, Araújo E, Lima BG, Linhares PCF. Estimativa da área foliar de juazeiro por dimensões lineares do limbo foliar. Revista Verde de Agroecologia 2008; 3(4): 1-5.) and are more evident in simple leaves with elliptic and oblong limbs. Likewise, the power function in our study gives accurate and reliable estimates leaf area for the species E. pauferrense.
In this work, it was chosen to dispense with any mathematical transformation of the variables for the simple and practical use of the equations. This criterion and the acceptance of the normality of the residue offer credibility for the selected models. Leaves removal is only necessary to estimate the allometric models. Once the allometric equation is known, the leaf area is determined using a graduated ruler or a measuring tape with no need of leaves removal.
The processes of development and growth of forest species are important in the ecological context, since the structural condition of an individual is related to the environmental and genetic factors that contributed to its growth from the seedling stage (Silva et al., 2015Silva RAR, Vieira FA, Fajardo CG, Araújo FS. Padrões alométricos da palmeira carnaúba (Copernicia prunifera (Mill.) H. E. Moore). Nativa 2015; 3(1): 56-58. 10.14583/2318-7670.v03n01a09
https://doi.org/10.14583/2318-7670.v03n0...
).
Therefore, studies using allometric models for the estimation of leaf area provide a tool for data measure for evolutionary and adaptation processes (Brito-Rocha et al., 2016Brito-Rocha E, Schilling AC, Anjos L, Piottoc D, Dalmolina AC, Mielke MS. Regression models for estimating leaf area of seedlings and adult individuals of Neotropical rainforest tree species. Brazilian Journal of Biology 2016; 76(4): 983-989. 10.1590/1519-6984.05515
https://doi.org/10.1590/1519-6984.05515...
; Forrester et al., 2017Forrester DI, Tachauer IHH, Annighoefer P, Barbeito I, Pretzsch H, Ruiz-Peinado R et al. Generalized biomass and leaf area allometric equations for European tree species incorporating stand structure, tree age and climate. Forest Ecology and Management 2017; 396(15): 160-175. 10.1016/j.foreco.2017.04.011
https://doi.org/10.1016/j.foreco.2017.04...
; Zhang & Pan, 2011Zhang L, Pan L. Allometric models for leaf area estimation across different leaf-age groups of evergreen broadleaved trees in a subtropical forest. Photosynthetica 2011; 49(2): 219-226. 10.1007/s11099-011-0027-x
https://doi.org/10.1007/s11099-011-0027-...
). Our study, thus, produces data that may contribute to the preservation of the natural genetic resources of the species E. pauferrense in its habitat facing the biological risk scenario of the Atlantic Forest.
4. CONCLUSIONS
The equations indicated to estimate leaf area of Erythroxylum pauferrense are the linear model (Ŷ = 0.0244 + 0.7204 (L × W)) and the power function (Ŷ = 0.7279 (L × W)0.9971) using the product of maximum length and maximum width as the predictor variable. These equations show great precision, the absence of bias and high reliability. The indirect measure of leaf area through the product of maximum length and maximum width provides a simple non-destructive method of estimation and avoids the use of expensive equipment.
The estimation of leaf area using the product of maximum length and maximum width of leaves is also a consensus for commercial species. Therefore, we expect that this study provides a tool to the simplification of various biological research (e.g., experimental, ecological and ecophysiological data) and to understand aspects of biological responses of the species to natural ecosystems or conservation actions.
ACKNOWLEDGEMENTS
To the Coordenação de Aperfeiçoamento de Pessoal de Nível Superior (CAPES), for the scholarship.
REFERENCES
- Almeida SMZ, Soares AM, Castro EM, Vieira CV, Gajego EB. Alterações morfológicas e alocação de biomassa em plantas jovens de espécies florestais sob diferentes condições de sombreamento. Ciência Rural 2005; 35(1): 62-68. 10.1590/S0103-84782005000100010
» https://doi.org/10.1590/S0103-84782005000100010 - Andrade LA, Oliveira FX, Nascimento IS, Fabricante JR, Sampaio EVSB, Barbosa MRV. Análise florística e estrutural de matas ciliares ocorrentes em brejo de altitude no município de Areia, Paraíba. Revista Brasileira de Ciências Agrárias 2006; 1(1): 31-40.
- Antunes WC, Pompelli MFD, Carretero FMD. Allometric models for non-destructive leaf area estimation in coffee (Coffea arabica and Coffea canephora). Annals of Applied Biology 2008; 153(1): 33-40. 10.1111/j.1744-7348.2008.00235.x
» https://doi.org/10.1111/j.1744-7348.2008.00235.x - Barbosa MRV, Agra, MF, Sampaio EVSB, Cunha JP, Andrade LA. Diversidade florística da Mata do Pau-Ferro, Areia, Paraíba. In: Pôrto KC, Cabral JJP, Tabarelli M, editors. Brejos de altitude em Pernambuco e Paraíba: história natural, ecologia e conservação. Brasília: Ministério do Meio Ambiente; 2004. p. 111-122. (Série Biodiversidade 9).
- Bianco S, Pitelli RA, Carvalho LB. Estimativa da área foliar de Tridax procumbens usando dimensões lineares do limbo foliar. Revista Planta Daninha 2004; 22(2): 247-250. 10.1590/S0100-83582004000200011
» https://doi.org/10.1590/S0100-83582004000200011 - Boeger MRT, Biu C, Goldenberg R. Arquitetura foliar comparativa de Miconia sellowiana (DC.) Naudin (Melastomataceae) em diferentes fitofisionomias no estado do Paraná, Brasil. Acta Botanica Brasilica 2009; 23(3): 657-665. 10.1590/S0102-33062009000300005
» https://doi.org/10.1590/S0102-33062009000300005 - Brito-Rocha E, Schilling AC, Anjos L, Piottoc D, Dalmolina AC, Mielke MS. Regression models for estimating leaf area of seedlings and adult individuals of Neotropical rainforest tree species. Brazilian Journal of Biology 2016; 76(4): 983-989. 10.1590/1519-6984.05515
» https://doi.org/10.1590/1519-6984.05515 - Cardozo NP, Parreira MC, Panosso AR, Volpe CA. Modelagem da área foliar de duas cultivares de amendoim em função das dimensões lineares dos folíolos. Bioscience Journal 2014; 30(1): 101-107.
- Centro Nacional de Conservação da Flora - CNCFlora. Erythroxylum pauferrense Plowman. CNCFlora [ Internet]. Lista Vermelha; 2012 Sept. 26 [cited 2017 Sept. 1]. Available from: Available from: https://bit.ly/2KxYpyI
» https://bit.ly/2KxYpyI - Coelho Filho MA, Angelocci LR, Vasconcelos MRB, Coelho EF. Estimativa da área foliar de plantas de lima ácida ‘tahiti’ usando métodos não-destrutivos. Revista Brasileira de Fruticultura 2005; 27(1): 163-167. 10.1590/S0100-29452005000100043
» https://doi.org/10.1590/S0100-29452005000100043 - Cornelissen JHC, Lavorel S, Garnier E, Díaz S, Buchmann N, Gurvich DE et al. A handbook of protocols for standardised and easy measurement of plant functional traits worldwide. Australian Journal of Botany 2003; 51(4): 335-380. 10.1071/BT02124
» https://doi.org/10.1071/BT02124 - Dainese M, Leps J, De Belo F. Different effects of elevation, habitat fragmentation and grazing management on the functional, phylogenetic and taxonomic structure of mountain grasslands. Perspectives in Plant Ecology, Evolution and Systematics 2015; 17(1): 44-53. 10.1016/j.ppees.2014.09.002
» https://doi.org/10.1016/j.ppees.2014.09.002 - Díaz S, Kattge J, Cornelissen JHC, Wright IJ, Lavorel S, Dray S et al. The global spectrum of plant form and function. Nature 2016; 529: 167-171. 10.1038/nature16489
» https://doi.org/10.1038/nature16489 - Donovan LA, Maherali H, Caruso CM, Huber H, Kroon H. The evolution of the worldwide leaf economics spectrum. Trends in Ecology & Evolution 2011; 26(2): 88-95. 10.1016/j.tree.2010.11.011
» https://doi.org/10.1016/j.tree.2010.11.011 - Eslamdoust J, Sohrabi H, Hosseini SM, Naseri B. Leaf biomass and leaf area equations for three planted trees in Iran. European Journal of Biological Research 2017; 7(1): 50-58. 10.5281/zenodo.267914
» https://doi.org/10.5281/zenodo.267914 - Forrester DI, Tachauer IHH, Annighoefer P, Barbeito I, Pretzsch H, Ruiz-Peinado R et al. Generalized biomass and leaf area allometric equations for European tree species incorporating stand structure, tree age and climate. Forest Ecology and Management 2017; 396(15): 160-175. 10.1016/j.foreco.2017.04.011
» https://doi.org/10.1016/j.foreco.2017.04.011 - Graybill FA. Theory and application of the linear model. Pacific Grove: Duxbury Press; 2000.
- Instituto Brasileiro de Geografia e Estatística - IBGE. Manuais técnicos em geociências: manual técnico da vegetação brasileira. Rio de Janeiro: IBGE; 2012.
- Jardim Botânico do Rio de Janeiro. Erythroxylaceae pauferrense Plowman [Internet]. 1986 [cited 2017 Sept. 1]. Available from: Available from: https://bit.ly/2KlC34y
» https://bit.ly/2KlC34y - Kottek M, Grieser J, Beck C, Rudolf B, Rubel F. World map of the Köppen-Geiger climate classification updated. Meteorologische Zeitschrift 2006; 15(3): 259-263. 10.1127/0941-2948/2006/0130
» https://doi.org/10.1127/0941-2948/2006/0130 - Lima RT, Souza PJOP, Rodrigues JC, Lima MJA. Modelos para estimativa da área foliar da mangueira utilizando medidas lineares. Revista Brasileira de Fruticultura 2012; 34(4): 974-980. 10.1590/S0100-29452012000400003
» https://doi.org/10.1590/S0100-29452012000400003 - Liu Z, Zhu Y, Li F, Jin G. Non-destructively predicting leaf area, leaf mass and specific leaf area based on a linear mixed-effect model for broadleaf species. Ecological Indicators 2017; 78: 340-350. 10.1016/j.ecolind.2017.03.025
- Loiola MIB, Agra MF, Baracho GS, Queiroz RT. Flora da Paraíba, Brasil: Erythroxylaceae Kunth. Acta Botânica Brasílica 2007; 21(2): 473-487. 10.1590/S0102-33062007000200020
» https://doi.org/10.1590/S0102-33062007000200020 - Maracajá PB, Madalena JAS, Araújo E, Lima BG, Linhares PCF. Estimativa da área foliar de juazeiro por dimensões lineares do limbo foliar. Revista Verde de Agroecologia 2008; 3(4): 1-5.
- Monteiro JEBA, Semelhas PC, Chiavegato EJ, Guiselini C, Santiago AV, Prela A. Estimação da área foliar do algodoeiro por meio de dimensões e massa das folhas. Bragantia 2005; 64(1): 15-24. 10.1590/S0006-87052005000100002
» https://doi.org/10.1590/S0006-87052005000100002 - Moraes L, Santos RK, Wisser TZ, Krupek RA. Avaliação da área foliar a partir de medidas lineares simples de cinco espécies vegetais sob diferentes condições de luminosidade. Revista Brasileira de Biociências 2013; 11(4): 381-387.
- Pérez-Harguindeguy N, Díaz S, Garnier E, Lavorel S, Poorter H, Jaureguiberry P et al. New handbook for standardised measurement of plant functional traits worldwide. Australian Journal of Botany 2013; 61(3): 167-234. 10.1071/BT12225
» https://doi.org/10.1071/BT12225 - Plowman T. Four new species of Erythroxylum (Erythroxylaceae) from Northeastern Brazil. Brittonia 1986; 38(3): 189-200. 10.2307/2807336
» https://doi.org/10.2307/2807336 - Pompelli MF, Antunes WC, Ferreira DTRG, Cavalcante PGS, Wanderley Filho HCL, Endres L. Allometric models for non-destructive leaf area estimation of Jatropha curcas. Biomass and Bioenergy 2012; 36(1): 77-85. 10.1016/j.biombioe.2011.10.010
» https://doi.org/10.1016/j.biombioe.2011.10.010 - Queiroz JA, Trovão DMBM, Oliveira AB, Oliveira ÉCS. Análise da estrutura fitossociológica da Serra do Monte, Boqueirão, Paraíba. Revista de Biologia e Ciências da Terra 2006; 6(2): 251-259.
- R Development Core Team: a language and environment for statistical computing. R Foundation for Statistical Computing. Vienna; 2019.
- Santos JNB. Equações alométricas para estimativa de área foliar de espécies lenhosas de floresta ombrófila de terras baixas [thesis]. Recife: Departamento de Ciência Florestal, Universidade Federal Rural de Pernambuco; 2016.
- Schmildt ER, Belique ETM, Schmildt O. Modelos alométricos para determinação da área foliar de cacaueiro ‘PH-16’ em sombreamento e pleno sol. Revista Agroambiente Online 2017; 11(1): 47-55.
- Schmildt ER, Oliari LS, Schmildt O, Alexandre RS, Pires FR. Determinação da área foliar de Passiflora mucronata a partir de dimensões lineares do limbo foliar. Revista Agroambiente Online 2016; 10(4): 351-357.
- Sfair JC, Rosado BHP, Tabarelli M. The effects of environmental constraints on plant community organization depend on which traits are measured. Journal of Vegetation Science 2016; 27(6): 1264-1274. 10.1111/jvs.12453
» https://doi.org/10.1111/jvs.12453 - Silva GH, Queiroz JE, Neto AGS. Avaliação da área foliar de três espécies florestais ocorrentes no semiárido paraibano (Amburana cearensis, Caesalpinia ferrea, Caesalpinia pyramidalis). Revista de Biologia e Farmácia 2013; 9(3): 1-11.
- Silva RAR, Vieira FA, Fajardo CG, Araújo FS. Padrões alométricos da palmeira carnaúba (Copernicia prunifera (Mill.) H. E. Moore). Nativa 2015; 3(1): 56-58. 10.14583/2318-7670.v03n01a09
» https://doi.org/10.14583/2318-7670.v03n01a09 - Souza MC, Amaral CL. Non-destructive linear model for leaf area estimation in Vernonia ferruginea Less. Brazilian Journal of Biology 2015; 75(1): 152-156. 10.1590/1519-6984.09813
» https://doi.org/10.1590/1519-6984.09813 - Ehleringer J. Fotossíntese: considerações fisiológicas e ecológicas. In: Taiz L, Zeiguer E, Møller I, Murphy A, editors. Fisiologia e desenvolvimento vegetal. 6th ed. Porto Alegre: Artmed; 2017. p. 245-268.
- Toebe M, Brum B, Lopes SJ, Cargnelutti Filho A, Silveira TR. Estimativa da área foliar de Crambe abyssinica por discos foliares e por fotos digitais. Revista Ciência Rural 2010; 40(2): 475-478. 10.1590/S0103-84782010000200036
» https://doi.org/10.1590/S0103-84782010000200036 - Williams L, Martinson TE. Nondestructive leaf area estimation of ‘Niagara’ and ‘DeChaunac’ grapevines. Scientia Horticulturae 2003; 98(4): 493-498. 10.1016/S0304-4238(03)00020-7
» https://doi.org/10.1016/S0304-4238(03)00020-7 - Wright IJ, Reich PB, Westoby M, Ackerly DD, Baruch Z, Bongers F et al. The worldwide leaf economics spectrum. Nature 2004; 428(6985): 821-827. 10.1038/nature02403
» https://doi.org/10.1038/nature02403 - Zar JH. Bioestatistical analysis. 5th ed. New Jersey: Pearson; 2010.
- Zhang L, Pan L. Allometric models for leaf area estimation across different leaf-age groups of evergreen broadleaved trees in a subtropical forest. Photosynthetica 2011; 49(2): 219-226. 10.1007/s11099-011-0027-x
» https://doi.org/10.1007/s11099-011-0027-x - Zuur AF, Ieno EN, Elphick CS. A protocol for data exploration to avoid common statistical problems. Methods in Ecology & Evolution 2009; 1(1): 3-14. 10.1111/j.2041-210X.2009.00001.x
» https://doi.org/10.1111/j.2041-210X.2009.00001.x
-
FINANCIAL SUPPORT Coordenação de Aperfeiçoamento de Pessoal de Nível Superior.
Publication Dates
-
Publication in this collection
21 Feb 2020 -
Date of issue
2020
History
-
Received
08 Nov 2017 -
Accepted
10 June 2018


 Lmax: maximum length; Wmax: maximum width.


