Abstract
This study aimed to assess the potential of artificial neural networks (ANN) as a tool to estimate deforestation rates in the municipality of São Félix do Xingu, PA, Brazil. The following input variables were used: deforestation rate until 2014, slope, altitude, Euclidean distance to roads and rivers, permanent preservation area (PPA), and property area. A total of 2,800 properties were used, of which 2,000 were used for training and 800 for validation of the networks. The input layer included nine neurons: six as quantitative variables and three as categorical variables. The output layer included a single neuron - the deforestation rate. The training results indicated high correlation (r = 0.92) and root mean square error (RMSE) of 12.4%. Validation of the model estimated RMSE = 12.9% and r = 0.91. The study results evidenced the high potential of ANN as a tool to estimate farm deforestation rates.
Keywords:
deforestation; artificial intelligence; validation
1. INTRODUCTION AND OBJECTIVES
In the past four decades, occupation of Amazonia has been essentially characterized by conversion of native forests into agricultural areas or livestock farms. The speed and intensity of deforestation in this vast area, with many irreversible losses to environmental patrimony, are the highest ever recorded in the history of mankind (Schmink & Wood, 2012Schmink M, Wood CH. Conflitos sociais e a formação da Amazônia. Belém: Ed. UFPA; 2012.).
Although the Amazon rainforest concentrates most of Brazil’s biodiversity, over 766,000 km2 (15.2%) of forests had been destroyed by 2015, with the largest areas of annual deforestation being recorded in 1995 (29,059 km2) and 2004 (27,772 km²) (INPE, 2017Instituto Nacional de Pesquisas Espaciais - INPE. Prodes digital. São José dos Campos; 2017.). However, more recent data from PRODES-INPE (Amazon Deforestation Satellite Monitoring Project) show that the lowest mean annual deforestation rates of the historical series have occurred as of 2009 in the Legal Amazon, with an annual average of 6,272 km2. Nonetheless, these mean increases have fluctuated in recent years, presenting increasing trends, as in the case of 2016, when an area of 7,989 km2 was deforested (INPE, 2017Instituto Nacional de Pesquisas Espaciais - INPE. Prodes digital. São José dos Campos; 2017.).
In Southern Pará, where the municipality of São Félix do Xingu is located, transformations in landscape are more accentuated and evident. This region began to be occupied in the first half of the 20th century by migrants from different parts of the Country, who settled and started working in rubber extraction activities (Kawakubo et al., 2013Kawakubo FS, Morato RG, Luchiari A. Mapeamento do desmatamento em São Félix do Xingú utilizando composição colorida multitemporal de imagens frações sombra. Revista da ANPEGE 2013; 9(11): 119-133. 10.5418/RA2013.0911.0010
https://doi.org/10.5418/RA2013.0911.0010...
). In the early 1980s, the region of São Félix do Xingu underwent a new economic cycle marked by mineral exploration and timber extraction. Attracted by the large amount of mineral deposits (tin, iron, gold etc.) and wood of high market value (mahogany, Swietenia macrophylla King), mining and logging companies began to structure, creating a new occupation scenario (Schmink & Wood, 2012Schmink M, Wood CH. Conflitos sociais e a formação da Amazônia. Belém: Ed. UFPA; 2012.).
Results of these events led to the spontaneous and disorderly occupation of rural lands. Over the years, occupation has placed São Félix do Xingu at the top of the list of highest deforestation rates in the Country and, currently, the municipality presents a cleared area of more than 17,000 km2 (INPE, 2017Instituto Nacional de Pesquisas Espaciais - INPE. Prodes digital. São José dos Campos; 2017.). The cleared area is distributed in a disorganized mosaic of rural properties, presenting trends of increasing deforestation rates.
This scenario has motivated several scientific studies addressing the impacts of deforestation on the landscape, often differentiated by the spatial arrangement and occupation of rural properties. Among the several approaches associated with research on this theme, the main methods include investigation of the deforestation process evolution and development of ways to model this space and estimate this process.
As an option for the modeling and estimation of variables of interest, artificial neural networks (ANN) have been successfully used over the years in many situations, with different degrees of complexity, and in several fields of application (Almeida & Ludermir, 2010Almeida LM, Ludermir TB. A multi-objective memetic and hybrid methodology for optimizing the parameters and performance of artificial neural networks. Neurocomputing 2010; 73(7-9): 1438-1450. 10.1016/j.neucom.2009.11.007
https://doi.org/10.1016/j.neucom.2009.11...
; Leal et al., 2015Leal FA, Miguel EP, Matricardi EAT, Pereira RS. Redes neurais artificiais na estimativa de volume em um plantio de eucalipto em função de fotografias hemisféricas e número de árvores. Revista Brasileira de Biometria 2015; 33(2): 233-249.; Miguel et al., 2015Miguel EP, Rezende AV, Leal FA, Matricardi EAT, Vale AT, Pereira RS. Redes neurais artificiais para a modelagem do volume de madeira e biomassa do cerradão com dados de satélite. Pesquisa Agropecuária Brasileira 2015; 50(9): 829-839. 10.1590/S0100-204X2015000900012
https://doi.org/10.1590/S0100-204X201500...
). Thus, this study aimed to assess the potential of ANN as a tool to estimate deforestation rates in rural properties in the municipality of São Félix do Xingu, PA. The results of this survey can be applied to the understanding of spatial deforestation, offering subsidies for the planning of rural occupation in tropical regions.
2. MATERIALS AND METHODS
2.1. Study area
This study was conducted in São Félix do Xingu (SFX), PA, more specifically in the northern region of the municipality, called Consolidation Area II (CA-II), which comprises 16,288 km2. Designation of CA-II was initially foreseen in the Ecological-economic Zoning of the state of Pará - Eastern and Northern Zones (Menezes et al., 2010Menezes CRC, Monteiro MA, Galvão IMF, editors. Zoneamento ecológico-econômico das zonas Leste e Calha Norte do estado do Pará. 3 vol. Belém: NGPR; 2010.), where most of the deforestation and consolidated use of land are concentrated, with emphasis on extensive cattle raising.
CA-II was the object of colonization projects and processes of spontaneous occupation in public areas of the Country. This is the area where most of the deforestation has been concentrated in the past decades in SFX, presenting a high degree of landscape fragmentation. Figure 1 illustrates the location of the study area highlighting CA-II.
Location of the municipality of São Félix do Xingu, PA, Brazil, and the location of CA-II, where most of the rural properties in this municipality are concentrated.
The municipality of SFX covers an area of 84,213 km2 and is located 200 mamsl on the left bank of the Fresco River upstream of the Xingu River. These are the main rivers in the municipality. In addition to the municipal seat, SFX is composed of four districts, namely, Ladeira Vermelha, Taboca, Nereu, and Lindoeste. The municipality had a population of 116,186 inhabitants in 2015 according to official estimate from the Instituto Brasileiro de Geografia e Estatística (IBGEInstituto Brasileiro de Geografia e Estatística - IBGE. Estimativas da população residente no brasil e unidades da federação, com data de referência em 1º de julho de 2015. Rio de Janeiro; 2015.).
According to the Köppen classification, climate in Pará includes wet equatorial climate (Af), tropical monsoon and trade-wind littoral climate (Am), and tropical wet-dry climate (Aw), with 28.4, 66.6, and 4.9 of coverage, respectively (Alvares et al., 2013Alvares CA, Stape JL, Sentelhas PC, Moraes Gonçalves JL, Sparovek G. Köppen’s climate classification map for Brazil. Meteorologische Zeitschrift 2013; 22(6): 711-728. 10.1127/0941-2948/2013/0507
https://doi.org/10.1127/0941-2948/2013/0...
). The climate in the study region is Am, which presents characteristics of monsoon climate, with moderate dry season and < 60 mm monthly rainfall on average. This type of climate is intermediate to Af and Aw.
The study region presents a dry period of five consecutive months (June to October) with low rainfall and a rainy period (December to April) with heavy rainfall. Between the dry and rainy periods, the region presents two transitional periods: dry-rainy in November and rainy-dry in May. Annual precipitation varies from 2,200 to 2,500 mm and average annual temperature is approximately 26 °C (Alvares et al., 2013Alvares CA, Stape JL, Sentelhas PC, Moraes Gonçalves JL, Sparovek G. Köppen’s climate classification map for Brazil. Meteorologische Zeitschrift 2013; 22(6): 711-728. 10.1127/0941-2948/2013/0507
https://doi.org/10.1127/0941-2948/2013/0...
). The municipality lies between the parallels from 5° 30’ to 9° 30’ south (S) latitude and between the meridians from 50° 30’ to 54° 00’ west (W) longitude.
2.2. Predictor variables
Study variables were chosen based on their relationship with deforestation rates observed for the region and include (1) accumulated deforestation rate from 1988 to 2014 (from vector files of the PRODES-INPE project for each property), obtained by dividing the deforested area by the property area; (2) rural property area (2,800 properties registered in the Cadastro Ambiental Rural - CAR located in the study area) (Richards & VanWey, 2016Richards PD, VanWey L. Farm-scale distribution of deforestation and remaining forest cover in Mato Grosso. Nature Climate Change 2016; 6: 418-425. 10.1038/nclimate2854
https://doi.org/10.1038/nclimate2854...
); (3) Euclidean distance to roads and rivers (Barber et al., 2014Barber CP, Cochrane MA, Souza CM Jr, Laurance WF. Roads, deforestation, and the mitigating effect of protected areas in the Amazon. Biological Conservation 2014; 177: 203-209. 10.1016/j.biocon.2014.07.004
https://doi.org/10.1016/j.biocon.2014.07...
); (4) slope (degrees) and (5) altitude (mamsl), obtained using the digital elevation model provided by NASA (EarthData) using the ASTER/GDEM (Global Digital Elevation Map Announcement) project, with spatial resolution of 30 m; (6) permanent preservation area (PPA) in the property, obtained using the vector drainage network (hydrography) of the Agência Nacional de Águas (ANA). As for APP, the slope image in degrees was used according to the slope, which must be between > 45° or 100%. The Euclidean distance to roads and rivers was calculated according to the study by Silveira & Silva (2010Silveira CS, Silva VV. Dinâmicas de regeneração, degeneração e desmatamento da vegetação provocadas por fatores climáticos e geomorfológicos: uma análise geoecológica através de SIG. Revista Árvore 2010; 34(6): 1025-1034. 10.1590/S0100-67622010000600008
https://doi.org/10.1590/S0100-6762201000...
). Figure 2 shows the variables that composed the adjustments and validation using artificial neural networks (ANN) to estimate deforestation rates by rural property in the study area.
Variables that composed the analyses using artificial neural networks: (a) - deforestation accumulated between 1988 and 2014 (PRODES-INPE); (b) - 2.800 properties of the Cadastro Ambiental Rural (CAR); (c) - Euclidean distance to main roads; (d) - mean slope in degrees; (e) - altitude in mamsl; (f) - permanent preservation area in the property; (g) - Euclidean distance to rivers
To compose the design proposed for the study, the variables altitude (mamsl) and slope (degrees) were estimated using the Zonal Statistics as Table tool ArcGISTM 10.2 (ESRI®). To this end, an option for mean values was made with reference to the size of each property, that is, all the variables were obtained considering the association with the properties that compose the vector file of CAR. The other variables were obtained from vector files using the Intersect tool (ArcGIS).
Information on each variable was associated with a code created in the table of each vector (1 to 2,800, in reference to the properties of CAR), so that this information, in tables, was later unified in a single vector file/spreadsheet without losing the correspondence between each observation. The Join Data (joins and relates) method was used for this stage. From the estimation of the study variables, the Shapiro-Wilk test (Shapiro & Wilk, 1965Shapiro SS, Wilk M. An analysis of variance test for normality (complete samples). Biometrika 1965; 52(3-4): 591-611. 10.2307/2333709
https://doi.org/10.2307/2333709...
) was applied aiming to verify the normality of the data.
2.3. Training of the artificial neural networks (ANN)
For ANN training, approximately 70% of the properties (2,000) that composed the original CAR database of the study area were randomly selected. The numerical variables were normalized linearly in the 0 to 1 interval, whereas the categorical variables were normalized using the N-of-1 trial methodology. In this case, when one of the categories assumed the value 1, the others assumed the value 0 (Heaton, 2011Heaton J. Programming neural networks with Encog 3 in Java. 2nd ed. St. Louis: Heaton Research; 2011.). Three classes of deforestation rates were considered categorical variables: low , medium , and high .
The input layer consisted of nine (9) neurons: six (6) for the quantitative variables (altitude, PPA, property area, slope, drainage, and roads) and three (3) for the categorical variables (low, medium, and high deforestation rate). The output, or response, layer comprised a single (1) neuron - the deforestation rate.
In the 9-9-1 ANN architecture (Figure 3), the input layer is the one in which the patterns are presented to the network; the hidden layer (also called intermediate) is responsible the processing, and it can be considered as extractor of characteristics; the output layer is the one that presents the result of data processing.
Architecture of the artificial neural network used in training and validation in this study, illustrating the input, hidden and output layers as deforestation rate. Input layer: 1, 2, and 3 (categorical variables); 4 (average altitude); 5 (permanent preservation area); 6 (Euclidean distance to rivers); 7 (Euclidean distance to main roads); 8 (mean slope); 9 (property area).
ANN were also composed of a single hidden layer. Most times, ANN need this layer to solve non-linearly separable problems (Oliveira-Esquerre et al., 2002Oliveira-Esquerre KP, Mori M, Bruns RE. Simulation of an industrial wastewater treatment plant using artificial neural networks and principal components analysis. Brazilian Journal of Chemical Engineering 2002; 19(4): 365-370. 10.1590/S0104-66322002000400002
https://doi.org/10.1590/S0104-6632200200...
). The number of neurons in this layer was optimized by the Intelligent Problem Solver (IPS) tool, Statistica 7.0 software (StatSoft, 2007StatSoft. Statistica: data analysis software system, versão 7. Tulsa; 2007.).
Only multilayer perceptron networks (MLP) were selected for training. This category of ANN is the most commonly used for solving modeling, prediction and projection problems because of the existence of hidden or processing layers, which enable the network to more accurately adapt and process information from inputs (predictors) to output or response values (Heidari et al., 2016Heidari E, Sobati MA, Movahedirad S. Accurate prediction of nanofluid viscosity using a multilayer perceptron artificial neural network (MLP-ANN). Chemometrics and Intelligent Laboratory Systems 2016; 155: 73-85. 10.1016/j.chemolab.2016.03.031
https://doi.org/10.1016/j.chemolab.2016....
).
The sigmoidal function was chosen for the activation of ANN training. This function is the most commonly used in the creation of ANN, and it can accurately approximate any continuous function in well-designed architectures (Haykin, 2001Haykin S. Redes neurais: princípios e prática. 2nd ed. Porto Alegre: Bookman; 2001.).
ANN use artificial intelligence in the training process and are composed of processing elements - the artificial neurons, which undergo an activation function generating a response at the end. This neuron is the information processing unit of an ANN, consisting of “n” x 1 , x 2 , ..., xn inputs and one output (response). The inputs are associated with w 1 , w 2 , ..., w n weights, which represent the synapses.
Attention should also be given to the choice of the training algorithm, as it specifically interferes with local minimum leakage. In general, a good algorithm should have high local search capacity, as well as high overall search capability (exploitation). A training algorithm is a set of well-defined rules for the solution of a learning problem (Baldi & Sadowski, 2016Baldi P, Sadowski P. A theory of local learning, the learning channel, and the optimality of backpropagation. Neural Networks 2016; 83: 51-74. 10.1016/j.neunet.2016.07.006
https://doi.org/10.1016/j.neunet.2016.07...
).
In this study, resilient propagation (RPROP), proposed by Riedmiller & Braun (1993Riedmiller M, Braun H. A direct adaptive method for faster backpropagation learning: the RPROP algorithm. In: IEEE International Conference on Neural Networks; 1993; San Francisco. New York: IEEE; 1993. p. 586-591.), was used as the training algorithm with learning rates ranging from 0 to 1. This is one of the most accurate, efficient and recommended alternatives for multilayer perceptron ANN (Shiblee et al., 2010Shiblee M, Chandra B, Kalra PK. Learning of geometric mean neuron model using resilient propagation algorithm. Expert Systems with Applications 2010; 37(12): 7449-7455. 10.1016/j.eswa.2010.04.018
https://doi.org/10.1016/j.eswa.2010.04.0...
).
In this type of algorithm, the weights are based on the data, and for this, the individual update value is entered for each weight. Initially, the weights of all the ANN were randomly generated (Heaton, 2011Heaton J. Programming neural networks with Encog 3 in Java. 2nd ed. St. Louis: Heaton Research; 2011.). Sequentially, the individual update value evolves during the learning process, based on the error function. ANN training persists until the rate is reduced to an acceptable range between the predicted values and the actual values supplied to the network, known as the delta rule, or until the maximum number of times or cycles is achieved (Almeida & Ludermir, 2010Almeida LM, Ludermir TB. A multi-objective memetic and hybrid methodology for optimizing the parameters and performance of artificial neural networks. Neurocomputing 2010; 73(7-9): 1438-1450. 10.1016/j.neucom.2009.11.007
https://doi.org/10.1016/j.neucom.2009.11...
).
However, an excessive number of cycles can induce the network to a loss of generalization capacity (overfitting), and a low number of cycles can prevent the network from reaching its best performance (underfitting). In order to solve such problems, mean square error < 1% was used as a stop criterion of the training algorithm, or when the root mean square error (RMSE) increased again, according to Chen et al., (2014Chen WC, Tseng LY, Wu C-S. A unified evolutionary training scheme for single and ensemble of feedforward neural network. Neurocomputing 2014; 143: 347-361. 10.1016/j.neucom.2014.05.057
https://doi.org/10.1016/j.neucom.2014.05...
); therefore, the training was concluded when one of the criteria was achieved.
In this study, ANN learning was supervised, with two sets of values assigned to the network: input and output values. Thus, the training consisted in an optimization problem of the ANN parameters (synaptic weights), so they could respond to the inputs as expected and extrapolate the same behavior to other inputs not predicted in the training. This is the “feedforward” method, which uses the unidirectional data flow algorithm without cycles (Wang et al., 2015Wang S, Jiang Y, Chung F-L, Qian P. Feedforward kernel neural networks, generalized least learning machine, and its deep learning with application to image classification. Applied Soft Computing 2015; 37: 125-141. 10.1016/j.asoc.2015.07.040
https://doi.org/10.1016/j.asoc.2015.07.0...
).
The best RNA was selected based on the correlation between the deforestation rate observed and the estimation performed by the networks (r); stability of the training indices provided by the software in the training phases; selection and evaluation, which must be constant (that is, with small variation between them); the root mean square error (RMSE), which evaluates the mean square difference between the values observed and the estimations (Equation 1); and graphical analysis (residue, correlation, and histogram in classes of errors).
Where: is the mean deforestation rate of the properties; is the individual ANN estimation rate for each property; t i is the individual deforestation rate observed for each property; “n” the total number of properties used in the training of ANN.
2.4. Validation of the estimates
After the best ANN was defined, the properties of CAR not used during the training phase (800) were used for validation. The Wilcoxon signed-rank test (1945Wilcoxon F. Individual comparisons by ranking methods. Biometrics Bulletin 1945; 1(6): 80-83.) was applied in the validation process to verify whether there was a difference between the data observed and the estimations. This test substitutes Student’s t-test for paired samples when data do not meet the requirements of the latter, such as normality of data - a situation found in this study.
The Action 2.7 and Past 2.17c software programs were used to process the normality test and Wilcoxon signed-rank test, respectively. The graphs were constructed in Microsoft Office Excel® 2016 and the ANN were trained in Statistica 7 (StatSoft, 2007StatSoft. Statistica: data analysis software system, versão 7. Tulsa; 2007.).
3. RESULTS AND DISCUSSION
Results of the Shapiro-Wilk test (1965Shapiro SS, Wilk M. An analysis of variance test for normality (complete samples). Biometrika 1965; 52(3-4): 591-611. 10.2307/2333709
https://doi.org/10.2307/2333709...
) to detect normality between the data analyzed show that the variables used did not present normal distribution (p = 0.000); therefore, implementation of artificial neural network (ANN) training was attempted.
Information about the 2,000 properties (± 70%) used to train the networks assisted with the selection of the best ANN, which was composed of an input layer, a hidden (intermediate) layer, and an output layer. The use of a single intermediate layer is supported by the “universal approximation theorem,” which mentions that only one hidden layer is sufficient for a multilayer perceptron network (MLP) to approach any continuous function (Cybenko, 1989Cybenko G. Approximation by superpositions of a sigmoidal function. Mathematics of Control, Signals and Systems 1989; 2: 303-314. 10.1007/BF02551274
https://doi.org/10.1007/BF02551274...
). The total of nine neurons was determined by the Intelligent Problem Solver (IPS) tool (StatSoft, 2007StatSoft. Statistica: data analysis software system, versão 7. Tulsa; 2007.).
The number of neurons in the hidden layer is directly associated with the ability of the network to simultaneously detect non-linear inclusions between the information presented in each input and output and obtain satisfactory statistics (Martins et al., 2016Martins ER, Binoti MLMS, Leite HG, Binoti DHB, Dutra GC. Configuração de redes neurais artificiais para estimação do afilamento do fuste de árvores de eucalipto. Revista Brasileira de Ciências Agrárias 2016; 11(1): 33-38. 10.5039/agraria.v11i1a5354
https://doi.org/10.5039/agraria.v11i1a53...
). The large number of neurons in this layer may lead the ANN to memorize spurious relations during the training phase, resulting in loss of its generalization capacity. Consequently, simpler configurations need to be chosen to obtain adequate results. Figure 3 shows the architecture of the input, hidden and output layers.
Adjustment and accuracy statistics of the ANN selected to predict the deforestation rate of the properties were satisfactory (Table 1). The chosen ANN presented low variation between the training, selection and evaluation indices, whose values were desirable and showed training balance (Binoti et al., 2013Binoti MLMS, Binoti DHB, Leite HG. Aplicação de redes neurais artificiais para estimação da altura de povoamentos equiâneos de eucalipto. Revista Árvore 2013; 37(4): 639-645. 10.1590/S0100-67622013000400007
https://doi.org/10.1590/S0100-6762201300...
). The correlation (r) between the deforestation rates observed and the estimations was 0.92, with root mean square error in percentage (RMSE %) of 12.4.
Validation of the network trained statistically confirms the feasibility of the use of artificial intelligence tools in the prediction of deforestation rates in rural properties in the Brazilian Amazonia (Table 1). RMSE = 12.9% and r = 0.91 were estimated. These results evidence the potential of ANN in estimating the deforestation rate by properties, ratified by the similarities found between the data observed and those estimated by the Wilcoxon signed-rank test (p = 0.82). Table 1 presents the results of the adjustment and accuracy statistics for the training and validation stages. It is noteworthy that information about 800 properties (± 30%), which were not utilized in the training process, were used in the validation process.
Although the statistical, goodness-of-fit criteria are good indicators for selecting a model, graphic analysis of residues is critical in ratifying them (Draper & Smith, 1998Draper NR, Smith H. Applied regression analysis. 3rd ed. New York: John Wiley e Sons; 1998.). Tendency errors can occur within a certain variable class range and, therefore, may not be detected by statistics that assess accuracy.
Adherence capacity, compact and homogeneous residues, and distribution of errors within class ranges close to zero are desirable in independent validation of the modeling technique. These results demonstrate the capacity of the models to accurately estimate the variables of interest.
Figure 4 shows the graphs of the network behavior in the training and validation processes in the prediction of deforestation rates of rural properties in the state of Pará. The graphs of residues in percentage (Figure 4a and 4d), correlation (Figure 4b and 4e), and histogram of error frequency (Figure 4c and 4f), both in training and validation, presented similarities in behavior, demonstrating adherence and compaction of residues. Likewise, the histogram of residues in percentage error classes showed the highest frequency between ± 10%. It is also possible to verify that ANN maintained the errors of overestimation and underestimation smaller than 50%.
Dispersion of residues in relation to the deforestation rates observed (a), correlation between observed and estimated rates (b), histogram of residues in percentage error classes (c). Training data (a, b, and c); residual scatter plot with respect to validation (d); correlation between observed and estimation rates in validation (e); residue histogram rates in error classes for validation (f)
Artificial intelligence presents great potential for several applications; however, there is a need for direct relationships between the input parameters and a target response to enable any application (Cartwright, 2008Cartwright H. Using artificial intelligence in chemistry and biology: a practical guide. Boca Raton: CRC Press; 2008.). Typically, networks are created to perform non-linear mappings from a set of interconnected inputs and outputs (Gürüler et al., 2015Gürüler H, Balli S, Yeniocak M, Göktaş O. Estimation the properties of particleboards manufactured from vine prunings stalks using artificial neural networks. Mugla Journal of Science and Technology 2015; 1(1): 24-33. 10.22531/muglajsci.209996
https://doi.org/10.22531/muglajsci.20999...
). In addition to these characteristics, ANN presented some advantages compared with conventional techniques, such as generalization capacity, parallelism, and possibility of learning (Egrioglu et al., 2014Egrioglu EA, Yolcu U, Aladag CH, Bas E. Recurrent multiplicative neuron model artificial neural network for non-linear time series forecasting. Procedia: Social and Behavioral Sciences 2014; 109: 1094-1100. 10.1016/j.sbspro.2013.12.593
https://doi.org/10.1016/j.sbspro.2013.12...
), thus returning accurate values, as verified in this study.
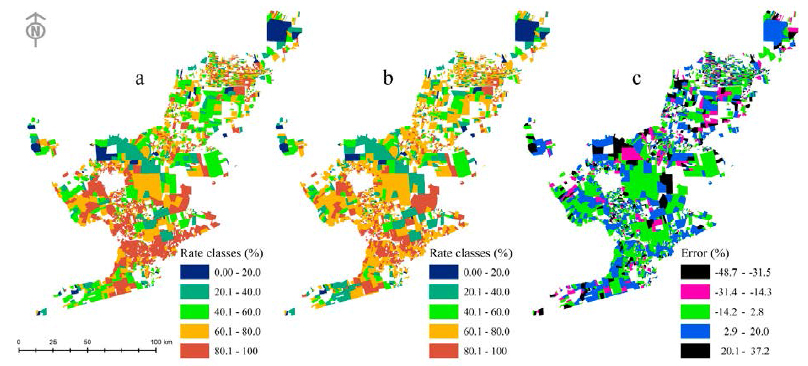
Especially, it is evident that ANN was able to effectively reproduce the deforestation rates in the study area, as depicted in Figure 5, which shows spatialization in percentage of the deforestation rates observed in the 2,800 rural properties (Figure 5a), the deforestation rates obtained by the adjustment and validation estimations (Figure 5b), and spatialization of the errors in percentage for the properties (Figure 5c).
Spatialization in percentage of deforestation rates observed in the 2,800 rural properties (a), deforestation rates obtained by the adjustment and validation estimations (b), and spatialization of the errors in percentage for the properties (c).
In Figure 5, it is possible to observe that the ANN was able to perform estimations of deforestation rates (Figure 5b), by properties, quite close to the observed rates (Figure 5a). It can be verified that the spatial distribution of the observed rates and estimations accurately reflected the good results of training and validation.
Finally, the potentiality of estimation of rates using ANN is highlighted, since given the spatial distribution of the errors (Figure 5c), few properties with deviations in the most extreme classes of distribution and, in general, high concentration of properties in the intermediate classes of errors were observed.
4. CONCLUSIONS
1) The artificial neural network (ANN) selected was successful in estimating the deforestation rates by rural property because it achieved good performance when applied to an unknown database (validation).
2) The validation performed confirmed the efficacy of the ANN applied to the data, which made the method quite effective in estimating the rates per property.
3) Results of this study show that the application of the ANN tool to estimate deforestation rates by properties is a viable alternative among the several approaches and methods used to understand the evolution of the deforestation process and other ways of conducting its estimation.
ACKNOWLEDGEMENTS
The main author thanks Coordenação de Aperfeiçoamento de Pessoal de Nível Superior for the doctoral scholarship.
REFERENCES
- Almeida LM, Ludermir TB. A multi-objective memetic and hybrid methodology for optimizing the parameters and performance of artificial neural networks. Neurocomputing 2010; 73(7-9): 1438-1450. 10.1016/j.neucom.2009.11.007
» https://doi.org/10.1016/j.neucom.2009.11.007 - Alvares CA, Stape JL, Sentelhas PC, Moraes Gonçalves JL, Sparovek G. Köppen’s climate classification map for Brazil. Meteorologische Zeitschrift 2013; 22(6): 711-728. 10.1127/0941-2948/2013/0507
» https://doi.org/10.1127/0941-2948/2013/0507 - Baldi P, Sadowski P. A theory of local learning, the learning channel, and the optimality of backpropagation. Neural Networks 2016; 83: 51-74. 10.1016/j.neunet.2016.07.006
» https://doi.org/10.1016/j.neunet.2016.07.006 - Barber CP, Cochrane MA, Souza CM Jr, Laurance WF. Roads, deforestation, and the mitigating effect of protected areas in the Amazon. Biological Conservation 2014; 177: 203-209. 10.1016/j.biocon.2014.07.004
» https://doi.org/10.1016/j.biocon.2014.07.004 - Binoti MLMS, Binoti DHB, Leite HG. Aplicação de redes neurais artificiais para estimação da altura de povoamentos equiâneos de eucalipto. Revista Árvore 2013; 37(4): 639-645. 10.1590/S0100-67622013000400007
» https://doi.org/10.1590/S0100-67622013000400007 - Cartwright H. Using artificial intelligence in chemistry and biology: a practical guide. Boca Raton: CRC Press; 2008.
- Chen WC, Tseng LY, Wu C-S. A unified evolutionary training scheme for single and ensemble of feedforward neural network. Neurocomputing 2014; 143: 347-361. 10.1016/j.neucom.2014.05.057
» https://doi.org/10.1016/j.neucom.2014.05.057 - Cybenko G. Approximation by superpositions of a sigmoidal function. Mathematics of Control, Signals and Systems 1989; 2: 303-314. 10.1007/BF02551274
» https://doi.org/10.1007/BF02551274 - Draper NR, Smith H. Applied regression analysis. 3rd ed. New York: John Wiley e Sons; 1998.
- Egrioglu EA, Yolcu U, Aladag CH, Bas E. Recurrent multiplicative neuron model artificial neural network for non-linear time series forecasting. Procedia: Social and Behavioral Sciences 2014; 109: 1094-1100. 10.1016/j.sbspro.2013.12.593
» https://doi.org/10.1016/j.sbspro.2013.12.593 - Gürüler H, Balli S, Yeniocak M, Göktaş O. Estimation the properties of particleboards manufactured from vine prunings stalks using artificial neural networks. Mugla Journal of Science and Technology 2015; 1(1): 24-33. 10.22531/muglajsci.209996
» https://doi.org/10.22531/muglajsci.209996 - Haykin S. Redes neurais: princípios e prática. 2nd ed. Porto Alegre: Bookman; 2001.
- Heaton J. Programming neural networks with Encog 3 in Java. 2nd ed. St. Louis: Heaton Research; 2011.
- Heidari E, Sobati MA, Movahedirad S. Accurate prediction of nanofluid viscosity using a multilayer perceptron artificial neural network (MLP-ANN). Chemometrics and Intelligent Laboratory Systems 2016; 155: 73-85. 10.1016/j.chemolab.2016.03.031
» https://doi.org/10.1016/j.chemolab.2016.03.031 - Instituto Brasileiro de Geografia e Estatística - IBGE. Estimativas da população residente no brasil e unidades da federação, com data de referência em 1º de julho de 2015. Rio de Janeiro; 2015.
- Instituto Nacional de Pesquisas Espaciais - INPE. Prodes digital. São José dos Campos; 2017.
- Kawakubo FS, Morato RG, Luchiari A. Mapeamento do desmatamento em São Félix do Xingú utilizando composição colorida multitemporal de imagens frações sombra. Revista da ANPEGE 2013; 9(11): 119-133. 10.5418/RA2013.0911.0010
» https://doi.org/10.5418/RA2013.0911.0010 - Köppen W. Das geographische system der Klimate. In: Köppen W, Geiger R, editors. Handbuch der Klimatologie. Berlin: Gebrüder Bornträger; 1936. Band 1. p. 1-44, part C.
- Leal FA, Miguel EP, Matricardi EAT, Pereira RS. Redes neurais artificiais na estimativa de volume em um plantio de eucalipto em função de fotografias hemisféricas e número de árvores. Revista Brasileira de Biometria 2015; 33(2): 233-249.
- Martins ER, Binoti MLMS, Leite HG, Binoti DHB, Dutra GC. Configuração de redes neurais artificiais para estimação do afilamento do fuste de árvores de eucalipto. Revista Brasileira de Ciências Agrárias 2016; 11(1): 33-38. 10.5039/agraria.v11i1a5354
» https://doi.org/10.5039/agraria.v11i1a5354 - Menezes CRC, Monteiro MA, Galvão IMF, editors. Zoneamento ecológico-econômico das zonas Leste e Calha Norte do estado do Pará. 3 vol. Belém: NGPR; 2010.
- Miguel EP, Rezende AV, Leal FA, Matricardi EAT, Vale AT, Pereira RS. Redes neurais artificiais para a modelagem do volume de madeira e biomassa do cerradão com dados de satélite. Pesquisa Agropecuária Brasileira 2015; 50(9): 829-839. 10.1590/S0100-204X2015000900012
» https://doi.org/10.1590/S0100-204X2015000900012 - Oliveira-Esquerre KP, Mori M, Bruns RE. Simulation of an industrial wastewater treatment plant using artificial neural networks and principal components analysis. Brazilian Journal of Chemical Engineering 2002; 19(4): 365-370. 10.1590/S0104-66322002000400002
» https://doi.org/10.1590/S0104-66322002000400002 - Richards PD, VanWey L. Farm-scale distribution of deforestation and remaining forest cover in Mato Grosso. Nature Climate Change 2016; 6: 418-425. 10.1038/nclimate2854
» https://doi.org/10.1038/nclimate2854 - Riedmiller M, Braun H. A direct adaptive method for faster backpropagation learning: the RPROP algorithm. In: IEEE International Conference on Neural Networks; 1993; San Francisco. New York: IEEE; 1993. p. 586-591.
- Schmink M, Wood CH. Conflitos sociais e a formação da Amazônia. Belém: Ed. UFPA; 2012.
- Shapiro SS, Wilk M. An analysis of variance test for normality (complete samples). Biometrika 1965; 52(3-4): 591-611. 10.2307/2333709
» https://doi.org/10.2307/2333709 - Shiblee M, Chandra B, Kalra PK. Learning of geometric mean neuron model using resilient propagation algorithm. Expert Systems with Applications 2010; 37(12): 7449-7455. 10.1016/j.eswa.2010.04.018
» https://doi.org/10.1016/j.eswa.2010.04.018 - Silveira CS, Silva VV. Dinâmicas de regeneração, degeneração e desmatamento da vegetação provocadas por fatores climáticos e geomorfológicos: uma análise geoecológica através de SIG. Revista Árvore 2010; 34(6): 1025-1034. 10.1590/S0100-67622010000600008
» https://doi.org/10.1590/S0100-67622010000600008 - StatSoft. Statistica: data analysis software system, versão 7. Tulsa; 2007.
- Wang S, Jiang Y, Chung F-L, Qian P. Feedforward kernel neural networks, generalized least learning machine, and its deep learning with application to image classification. Applied Soft Computing 2015; 37: 125-141. 10.1016/j.asoc.2015.07.040
» https://doi.org/10.1016/j.asoc.2015.07.040 - Wilcoxon F. Individual comparisons by ranking methods. Biometrics Bulletin 1945; 1(6): 80-83.
-
1
Associate editor: Bruno Araujo Furtado de Mendonça https://orcid.org/0000-0003-0288-0024
Publication Dates
-
Publication in this collection
11 May 2020 -
Date of issue
2020
History
-
Received
09 Mar 2017 -
Accepted
28 Sept 2018