Abstract
Fire behavior prediction models can assist environmental agencies with fire prevention and control. This study aimed to adjust a fire prediction model for the state of Minas Gerais, Brazil. Using the R program and hotspots provided by the National Institute for Space Research (INPE) for 2010, prediction of the probability of fires through the Random Forest algorithm was conducted using the Bootstrapping method. The model generated a prediction map with global kappa value of 0.65. External validation was performed with hotspots in 2015. Results showed that 58% of the hotspots are in areas with ignition probability > 50%, being 24% of them in areas with 25-50% probability, and 17% in areas with < 25% probability. These results were considered satisfactory, demonstrating that the model is suitable for predicting fires.
Keywords:
fires; modeling; environmental monitoring
1. INTRODUCTION AND OBJECTIVES
The controlled and natural forest fires are among the main environmental problems, because in addition to the biodiversity loss (of both fauna and flora), they are responsible for greenhouse gas emission. Moreover, depending on their intensity and frequency, they cause soil degradation through a series of modifications in its physical, chemical and biological nature (Redin et al., 2011Redin M, Santos GF, Miguel P, Denega GL, Lupatini M, Doneda A et al. Impactos da queima sobre atributos químicos, físicos e biológicos do solo. Ciência Florestal 2011; 21(2): 381-392. 10.5902/198050983243
https://doi.org/10.5902/198050983243...
).
In this context, agility and efficiency in the detection and monitoring of forest fires is essential for the control, management, and operational costs reduction in combating fires and reducing the damages caused (Alves & Nóbrega, 2011Alves KMAS, Nóbrega RS. Uso de dados climáticos para análise espacial de risco de incêndio florestal: climatic data use for spatial analysis of forest fire risk. Mercator 2011; 10(22): 209-219. 10.4215/RM2011.1022.0013
https://doi.org/10.4215/RM2011.1022.0013...
).
The development of models that enable the prediction of areas susceptible to fires is fundamental in environmental management and monitoring. These tools enable identification of numerous variables (meteorological, geographic, land cover, seasonal, human etc.) that, generally in a Geographic Information System (GIS) environment, are classified as with greater susceptibility to fire (He et al., 2004He HS, Shang BZ, Crow TR, Gustafson EJ, Shifley SR. Simulating forest fuel and fire risk dynamics across landscapes-LANDIS fuel module design. Ecological Modelling 2004; 180: 135-151.).
The categorical maps produced via simulation or statistical modeling from samples and mapped environmental variables are widely used in the definition of models (Prasad et al., 2006Prasad AM, Iverson LR, Liaw A. Newer classification and regression tree techniques: bagging and random forests for ecological prediction. Ecosystems 2006; 9(2): 181-199. 10.1007/s10021-005-0054-1
https://doi.org/10.1007/s10021-005-0054-...
). The results of these analyses can be used to compare current with previous fire data and assess their temporal dynamics in a given historical series or season (months) more prone to fire occurrence, generating useful information for managers and decision-makers.
Currently, there are many fire behavior prediction models, with peculiarities and different data collection and processing forms, and the most commonly used ones are conceptually divided into two categories: deterministic and stochastic. The deterministic model incorporates physical mechanisms for fire spread and growth, enabling only qualitative comparisons with real systems (Boychuk et al., 2009Boychuk D, Braun WJ, Kulperger RJ, Krougly ZL, Stanford DA. A stochastic forest fire growth model. Environmental and Ecological Statistics 2009; 16(2): 133-151. 10.1007/s10651-007-0079-z
https://doi.org/10.1007/s10651-007-0079-...
), whereas the stochastic model incorporates random phenomena that are not detected by the deterministic models, and it is necessary to specify a probability distribution for the data identified variations (Bolker, 2008Bolker BM. Ecological models and Data in R. Princeton: Princeton University Press; 2008.).
Also, according to Bolker (2008Bolker BM. Ecological models and Data in R. Princeton: Princeton University Press; 2008.), the stochastic models are more useful in data manipulation compared with the deterministic approach, assisting with the identification of the existing variability and providing an appropriate model to determine the probability of future uncertainties. This can be observed in the studies addressing prediction and modeling of fires conducted by Boadi et al. (2015Boadi C, Harvey SK, Gyeke-Dako A. Modelling of fire count data: fire disaster risk in Ghana. SpringerPlus 2015; 4: 794. 10.1186/s40064-015-1585-3
https://doi.org/10.1186/s40064-015-1585-...
), in which models to predict fires were formulated and greater robustness or data inclusion in the model were suggested in order to include activities with fire potential in the processing, respectively.
This study aimed to predict burned areas in the state of Minas Gerais for 2010, as well as areas with higher fire probability, assessing the accuracy of the maps through external validation with hotspots in 2015.
2. MATERIALS AND METHODS
The study area comprises the state of Minas Gerais, located in the southeastern region of Brazil, as shown in Figure 1, with an area of 586,522,122 km2. According to Valadão et al. (2008Valadão RC, Oliveira CV, Ker JC. Compartimentação regional do relevo e cobertura pedológica do centro-norte de Minas Gerais. Revista Geografias 2008; 1(4): 93-100.), the relief is composed of plateaus, highlands, and depressions. Located in a region with the predominance of the Atlantic Plateau, where a rather rugged relief is observed with altitudes ranging from 700 m to over 2,000 m, called “seas of hills”. From the central region to the north of the state, the Espinhaço Massif stands out, and in it, the Cipó Ridge. In the south of the state, there is the Campo das Vertentes, where the Mantiqueira Ridge is located. In the eastern region, there is the Caparaó Ridge, where the Bandeira Peak is located. As for vegetation, the state comprises Cerrado, Caatinga, and Atlantic Forest biomes.
According to the Koppen classification, the climate in the state is predominantly Aw, but Cwa and Cwb also occur in the southern region and in the Espinhaço and Mantiqueira Ridges; wet conditions are also observed between spring and autumn, except in the northern region. During winter, the aridity index corresponds to semi-arid in the southern region of the state, arid in the central region, and hyperarid in the extreme north (Reboita et al., 2015Reboita MS, Rodrigues M, Silva LF, Alves MA. Aspectos climáticos do estado de Minas Gerais (climate aspects in Minas Gerais State). Revista Brasileira de Climatologia 2015; 17: 206-226. 10.5380/abclima.v17i0.41493
https://doi.org/10.5380/abclima.v17i0.41...
).
Mean annual rainfall varies from 900 to 1,800 mm. Most rainfall occurs in the entire state between October and March, with even higher mean volumes in January, mainly in the southern region. July is the driest month. Considering the spatial distribution, the center-southern region presents the highest annual rainfall, whereas the northern region has the lowest (Silva, 2014Silva ED. Estudo da precipitação no estado de Minas Gerais-MG. Revista Brasileira de Climatologia 2014; 13: 120-136. 10.5380/abclima.v13i0.33345
https://doi.org/10.5380/abclima.v13i0.33...
; Souza et al., 2011Souza LR, Amanajás JC, Silva APN, Braga CC, Correia MF. Determinação de padrões espaço-temporal e regiões homogêneas de precipitação pluvial no estado de Minas Gerais. Engenharia Ambiental: Pesquisa e Tecnologia 2011; 8(2): 265-280.).
The burned areas were determined using the hotspots database available for download at the INPE website. The driest period of 2010 (May to October) was chosen for the data processing. During this period, 22,698 hotspots were identified throughout the state of Minas Gerais.
The prediction was made using the 65 following covariates extracted from different databases:
-
Altitude: originated from the Shuttle Radar Topography Mission (SRTM) with 90 m resolution;
-
Aspect, solar radiation, and slope: derived from the SRTM via ArcGIS 10.1 platform;
-
Bioclimatic variables: obtained from WorldClim with 1 km resolution and present in Chart 1;
-
Biomass: obtained at the IBGE website;
-
Euclidean distance of federal and/or state highways: derived from the IBGE highway archive and processed via ArcGIS 10.1 platform;
-
The vegetation Indices (Normalized Difference Vegetation Index - NDVI and Enhanced Vegetation Index - EVI) for the state of Minas Gerais of all months in analyses derived from the Modis sensor: available for download at the INPE website;
-
Simplified geomorphology: available for download at the Mineral Resources Research Company - CPRM website (2010).
Aiming to standardize the spatial resolution of the different databases and considering the large extension of the studied area, all variables were interpolated in the ArcGIS 10.1 software for a 1 km cell size as a variable function with the lowest spatial resolution, in this case, the climatic variables.
The burned areas, represented by the locations of the hotspots, and the unburned areas were sampled for the Classifier training set. In this case, an 8 km exclusion buffer was created around each hotspot to ensure that the unburned areas were not influenced by the burned ones. The exclusion radius was defined considering the study by Kobler et al. (2006Kobler A, Ogrinc P, Skok I, Fajfar D, Džeroski S. The final report on the results of the research project: a predictive GIS model of fire risk in the natural environment [technical report]. Ljubljana: Slovenian Forestry Institute, Jožef Stefan Institute; 2006.). According to the authors, it should be noted that, in order to obtain predictive models of fire outbreaks, positive and negative history of their manifestation is needed. Positive examples may be represented by fire occurrence sites in the past, whereas negative examples may be represented by an equal number of random points with no past fire outbreaks occurrence. In this sense, for the sampling of the unburned areas, all previously generated buffer areas (22,698 hotspots in the state of Minas Gerais) were discarded so that only the unburned areas remain.
Subsequently, still using the ArcGIS 10.1 software, 22,698 points were randomly generated in the unburned areas for sampling. After combining the two sample types (cloud of burned and unburned areas), the value of each point of the 65 covariates (rasters) was extracted and a table was generated with 45,378 points containing two classes: class 1 (the burned areas), class 2 (the unburned areas), and the values of all covariates for all samples.
The prediction of the burned areas was performed through the Random Forest algorithm, based on the decision tree, using the R software and the Bootstrapping method. This is a resampling method proposed by Bradley Efron in 1979. It consists of resampling the original data with repetition. At each resampling, a data set is obtained by averaging each procedure. After n bootstrap interactions, the mean average is calculated. In this way, the bootstrap distribution is obtained, from which all the statistical analyses are conducted (Silva et al., 2018Silva CM, Vieira JW, Neto NA, Gonçalves GL. Controle estatístico de qualidade usando o método bootstrap. Scientia Plena 2018; 14(3): 1-9. 10.14808/sci.plena.2018.037001
https://doi.org/10.14808/sci.plena.2018....
). Kappa statistics were used to evaluate the accuracy of the prediction of burned areas.
The first step of the analysis consisted in reducing the number of covariates, with elimination of those that presented high correlation degree with each other, considering that they are redundant, to obtain a simple and parsimonious model. This elimination was performed using the kappa values as markers, which means, correlated variables were removed without significant decrease in the kappa values compared with those of the initial model with the presence of all covariates.
After obtaining the prediction map with the variables selected by the model, the probability map of fires was attained. The probability values vary from zero to one, and they were divided into four classes according to occurrence probability of the fire: (1) 0-25% - low; (2) 25-50% - moderate; (3) 50-75% - high; (4) 75-100% - very high.
In order to validate the fire probability map, data on hotspots between May and October 2015 (82,083 hotspots) were used, and the class of the probability map in which there was the highest hotspots occurrence was verified, evaluating the efficiency of this prediction. In the randomized nonlinear correlation analysis, correlation intervals between the variables were adjusted so that redundant variables were excluded. The kappa values did not change significantly.
3. RESULTS
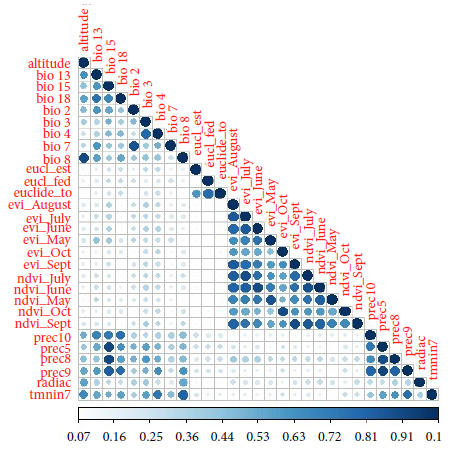
Global kappa for all variables was 0.65, with overall accuracy of 0.82 considering 24 replications. The ideal correlation index for the variables in the correlation analysis was 0.92. Thirty-one continuous variables were excluded, and 29 variables remained as shown in Figure 2. In the prediction assessment for these variables plus the five categorical variables the kappa index was 0.63, with the accuracy of 0.81.
The dissimilarity analysis for the six categorical variables presented a cut-off point of 0.7, with an exclusion of only the “biome” variable and permanence of the variables: “aspect”, “slope”, “altitude”, “simplified geomorphology” and “soils”. The prediction of the burned areas through the non-redundant variables showed a kappa index of 0.65, with an accuracy of 0.82.
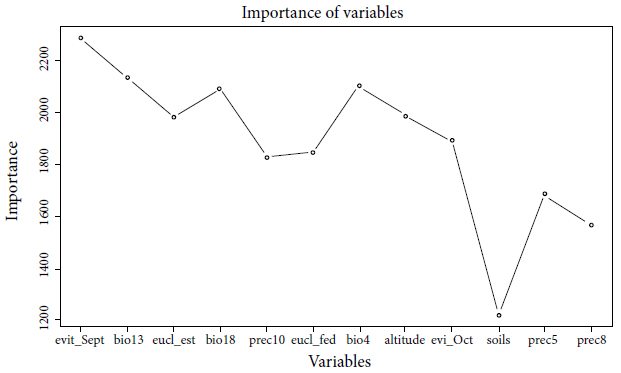
After the exclusion of the redundant variables, both numerical and categorical, values of 0.63 and 0.81 were obtained for kappa and overall accuracy, respectively, for the prediction map of the burned areas resulting from the selection of 25 of the 33 variables. After this step and the exclusion of the redundant variables, the data were processed through the Random Forest classification tree using the Bootstrapping method with 25 replications, in which the variables were listed according to their importance, with the return of 15 variables whose kappa value was 0.66. However, the analysis of these indices showed that, with 12 variables, the kappa value was 0.657, and thus these 12 variables were selected. The Figure 3 shows the importance order of the variables.
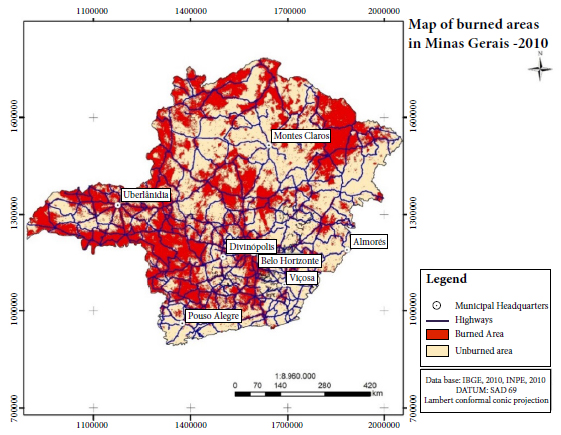
With the most important variables definition, the map of burned areas for the state of Minas Gerais, as shown in Figure 4, was produced. This classification presented a final kappa index of 0.65, which is considered good according to Landis & Koch (1977Landis JR, Koch GG. The measurement of observer agreement for categorical data. Biometrics 1977; 33(1): 159-174. 10.2307/2529310
https://doi.org/10.2307/2529310...
).
After the generation of the fire probability map, the values of the pixels with hotspots of 2015 were extracted in order to validate the map. This step was fundamental for the interpretation and the verification of the accuracy of the performed process, thus presenting 17% (14,002) of hotspots classified as of low probability of fire prediction (0-0.25 intervals), 24.1% (19,701) of hotspots of average probability (0.25-0.5 intervals), 24.4% (19,926) of hotspots of high probability (0.50-0.75 intervals), and 34.1% (27,905) of the hotspots of very high probability, obtained through the inserted points in the 0.75-1 interval, representing the highest percentage of fire outbreaks.
From the map of burned areas, a fire probability map was generated, showing the most prone locations to the fire occurrences throughout the state, represented in Figure 5.
4. DISCUSSION
The used methodology to select the most important variables (randomized nonlinear correlation and dissimilarity) was fundamental for the efficient detection of redundant variables and the selection of the most important variables for prediction. All selected variables have an intrinsic relation with the programing or with fire occurrences in the landscape.
As a result of the selection of variables presented in the graph of Figure 2, it is possible to observe that the EVI spectral index was the most important among the variables. The reflectance values of the spectral channels before (pre-fire) and after (post-fire) fires can identify which channels present the highest sensitivity in the spectral response of burned surfaces (Pereira et al., 2016Pereira AA, Teixeira FR, Libonati R, Melchiori EA, Carvalho LMT. Avaliação de índices espectrais para identificação de áreas queimadas no cerrado utilizando dados LandSat TM. Revista Brasileira de Cartografia 2016; 8(68): 1665-1680.). By showing a very different spectral response, from the EVI index, this variable contributed to more precisely identify the burned areas with lower values than those of the unburned areas.
The rainfall variables were the second most important. Rainfall distribution throughout the year also influences the number of affected areas by fires, because fire outbreaks occurred during reduced rainfall periods (Silva et al., 2016Silva CHL Jr, Freire ATG, Rodrigues TCS, Viegas J, Bezerra DS. Dinâmica das queimadas na baixada maranhense. Revista de Geografia e Interdisciplinaridade 2016; 2(5): 356-375. 10.18766/2446-6549/interespaco.v2n5p355-375
https://doi.org/10.18766/2446-6549/inter...
).
The “Euclidean distance of the highways” variable was also quite important among the variables used, because these areas are more susceptible to fire occurrences. Lima (2000Lima GS. A prevenção de incêndios florestais no estado de Minas Gerais. Revista Floresta 2000; 30(1-2): 37-43. 10.5380/rf.v30i12.2364
https://doi.org/10.5380/rf.v30i12.2364...
) confirms that most fires that have occurred in the state of Minas Gerais started at roadside. From the metropolitan area of Belo Horizonte to the vicinity of the municipality of Ouro Preto, there is a high fire occurrence probability, because this route has important highways, whose traffic flow and disposal of flammable materials are intense, contributing to fire occurrences. Another fact associated with this area is the occurrence of High-altitude Rupestrian Fields mainly near the region of Ouro Preto, which promotes ignition of the vegetation caused both by the shallow depth of the soils and the rupestrian grasslands characteristics.
The “altitude” variable was an important factor in the spread of fires, because the vegetation becomes spaced and shrubby in highlands, with shallower and consequently drier soils. The atmosphere also indirectly influences this parameter, considering that high altitude areas are more prone to lightening occurrence, causing natural fires that are difficult to combat due to the limited access (Ganteaume & Jappiot, 2013Ganteaume A, Jappiot M. What causes large fires in Southern France. Forest Ecology and Management 2013; 294: 76-85. 10.1016/j.foreco.2012.06.055
https://doi.org/10.1016/j.foreco.2012.06...
).
Despite being important in the incidence of fires, the “soils” variable presented the least importance among the 12 variables used, a fact that can be influenced by the vegetation cover and/or the low resolution of the soil map (1:250.000) available for this study.
The prediction map of burned and unburned areas, represented in Figure 4, is consistent with the hotspots distribution for 2010, and the probability map reinforces the fire incidence trend in specific areas. The probability map analysis from Figure 4, revealed similar results to those observed by Pereira et al. (2016Pereira AA, Teixeira FR, Libonati R, Melchiori EA, Carvalho LMT. Avaliação de índices espectrais para identificação de áreas queimadas no cerrado utilizando dados LandSat TM. Revista Brasileira de Cartografia 2016; 8(68): 1665-1680.), who indicated that most fires occurred in the northern region of Minas Gerais state based on a 10-year time-series study. This fact is mainly due to the significant presence of areas of agricultural expansion and to the low humidity of this region.
Another similar result, also described in previous studies, was presented by Magalhães et al. (2012Magalhães SR, Lima GS, Ribeiro GA. Avaliação dos incêndios florestais ocorridos no Parque Nacional da Serra da Canastra - Minas Gerais. Cerne 2012; 18(1): 135-141. 10.1590/S0104-77602012000100016
https://doi.org/10.1590/S0104-7760201200...
), who reported high-frequency fire occurrences in the Serra da Canastra National Park.
In addition, many fires are associated with the controlled fire practice in agriculture, such as in the management of planted pastures with the purpose of regrowth. The Environmental Legislation of the State of Minas Gerais, joint resolution SEMAD/IEF no. 2075 of May 23, 2014, allows the controlled fire use in agropastoral and phytosanitary practices, provided that with justification, monitoring, and control, which usually do not occur. This practice can be observed mainly along the borderline of the states of Minas Gerais and São Paulo, where the intensive agriculture development occurs with the sugar cane cultivation, and with other crops that still use controlled fire in harvest or to clean the land after harvest.
Finally, the analysis of the incidence of hotspots of years with the probability map showed that the classification model obtained a satisfactory reliability level, where 58.5% of the hotspots are in areas with high or very high fire probability and only 17% of them are in areas with low fire probability.
5. CONCLUSION
In conclusion, the results of this study show that the fire prediction methodology for the state of Minas Gerais was efficient. The need for assessment and correlation between the variables made the model simpler and more reliable, emphasizing the importance of verifying the data consistency prior to any processing. Therefore, the results generated can serve as a good tool for fire management and control by the competent bodies.
ACKNOWLEDGEMENTS
We thank the coordinators of the Geoprocessing Laboratory of the Universidade Federal de Viçosa for providing the space for writing this manuscript.
REFERENCES
- Alves KMAS, Nóbrega RS. Uso de dados climáticos para análise espacial de risco de incêndio florestal: climatic data use for spatial analysis of forest fire risk. Mercator 2011; 10(22): 209-219. 10.4215/RM2011.1022.0013
» https://doi.org/10.4215/RM2011.1022.0013 - Boadi C, Harvey SK, Gyeke-Dako A. Modelling of fire count data: fire disaster risk in Ghana. SpringerPlus 2015; 4: 794. 10.1186/s40064-015-1585-3
» https://doi.org/10.1186/s40064-015-1585-3 - Bolker BM. Ecological models and Data in R. Princeton: Princeton University Press; 2008.
- Boychuk D, Braun WJ, Kulperger RJ, Krougly ZL, Stanford DA. A stochastic forest fire growth model. Environmental and Ecological Statistics 2009; 16(2): 133-151. 10.1007/s10651-007-0079-z
» https://doi.org/10.1007/s10651-007-0079-z - Magalhães SR, Lima GS, Ribeiro GA. Avaliação dos incêndios florestais ocorridos no Parque Nacional da Serra da Canastra - Minas Gerais. Cerne 2012; 18(1): 135-141. 10.1590/S0104-77602012000100016
» https://doi.org/10.1590/S0104-77602012000100016 - Ganteaume A, Jappiot M. What causes large fires in Southern France. Forest Ecology and Management 2013; 294: 76-85. 10.1016/j.foreco.2012.06.055
» https://doi.org/10.1016/j.foreco.2012.06.055 - He HS, Shang BZ, Crow TR, Gustafson EJ, Shifley SR. Simulating forest fuel and fire risk dynamics across landscapes-LANDIS fuel module design. Ecological Modelling 2004; 180: 135-151.
- Kobler A, Ogrinc P, Skok I, Fajfar D, Džeroski S. The final report on the results of the research project: a predictive GIS model of fire risk in the natural environment [technical report]. Ljubljana: Slovenian Forestry Institute, Jožef Stefan Institute; 2006.
- Landis JR, Koch GG. The measurement of observer agreement for categorical data. Biometrics 1977; 33(1): 159-174. 10.2307/2529310
» https://doi.org/10.2307/2529310 - Lima GS. A prevenção de incêndios florestais no estado de Minas Gerais. Revista Floresta 2000; 30(1-2): 37-43. 10.5380/rf.v30i12.2364
» https://doi.org/10.5380/rf.v30i12.2364 - Pereira AA, Teixeira FR, Libonati R, Melchiori EA, Carvalho LMT. Avaliação de índices espectrais para identificação de áreas queimadas no cerrado utilizando dados LandSat TM. Revista Brasileira de Cartografia 2016; 8(68): 1665-1680.
- Prasad AM, Iverson LR, Liaw A. Newer classification and regression tree techniques: bagging and random forests for ecological prediction. Ecosystems 2006; 9(2): 181-199. 10.1007/s10021-005-0054-1
» https://doi.org/10.1007/s10021-005-0054-1 - Reboita MS, Rodrigues M, Silva LF, Alves MA. Aspectos climáticos do estado de Minas Gerais (climate aspects in Minas Gerais State). Revista Brasileira de Climatologia 2015; 17: 206-226. 10.5380/abclima.v17i0.41493
» https://doi.org/10.5380/abclima.v17i0.41493 - Redin M, Santos GF, Miguel P, Denega GL, Lupatini M, Doneda A et al. Impactos da queima sobre atributos químicos, físicos e biológicos do solo. Ciência Florestal 2011; 21(2): 381-392. 10.5902/198050983243
» https://doi.org/10.5902/198050983243 - Silva CHL Jr, Freire ATG, Rodrigues TCS, Viegas J, Bezerra DS. Dinâmica das queimadas na baixada maranhense. Revista de Geografia e Interdisciplinaridade 2016; 2(5): 356-375. 10.18766/2446-6549/interespaco.v2n5p355-375
» https://doi.org/10.18766/2446-6549/interespaco.v2n5p355-375 - Silva ED. Estudo da precipitação no estado de Minas Gerais-MG. Revista Brasileira de Climatologia 2014; 13: 120-136. 10.5380/abclima.v13i0.33345
» https://doi.org/10.5380/abclima.v13i0.33345 - Silva CM, Vieira JW, Neto NA, Gonçalves GL. Controle estatístico de qualidade usando o método bootstrap. Scientia Plena 2018; 14(3): 1-9. 10.14808/sci.plena.2018.037001
» https://doi.org/10.14808/sci.plena.2018.037001 - Souza LR, Amanajás JC, Silva APN, Braga CC, Correia MF. Determinação de padrões espaço-temporal e regiões homogêneas de precipitação pluvial no estado de Minas Gerais. Engenharia Ambiental: Pesquisa e Tecnologia 2011; 8(2): 265-280.
- Valadão RC, Oliveira CV, Ker JC. Compartimentação regional do relevo e cobertura pedológica do centro-norte de Minas Gerais. Revista Geografias 2008; 1(4): 93-100.
Edited by
Publication Dates
-
Publication in this collection
26 June 2020 -
Date of issue
2020
History
-
Received
13 Mar 2018 -
Accepted
22 Aug 2018


