Abstracts
Objective
To investigate the validity and reliability of a multi-informant approach to measuring child maltreatment (CM) comprising seven questions assessing CM administered to children and their parents in a large community sample.
Methods
Our sample comprised 2,512 children aged 6 to 12 years and their parents. Child maltreatment (CM) was assessed with three questions answered by the children and four answered by their parents, covering physical abuse, physical neglect, emotional abuse and sexual abuse. Confirmatory factor analysis was used to compare the fit indices of different models. Convergent and divergent validity were tested using parent-report and teacher-report scores on the Strengths and Difficulties Questionnaire. Discriminant validity was investigated using the Development and Well-Being Assessment to divide subjects into five diagnostic groups: typically developing controls (n = 1,880), fear disorders (n = 108), distress disorders (n = 76), attention deficit hyperactivity disorder (n = 143) and oppositional defiant disorder/conduct disorder (n = 56).
Results
A higher-order model with one higher-order factor (child maltreatment) encompassing two lower-order factors (child report and parent report) exhibited the best fit to the data and this model's reliability results were acceptable. As expected, child maltreatment was positively associated with measures of psychopathology and negatively associated with prosocial measures. All diagnostic category groups had higher levels of overall child maltreatment than typically developing children.
Conclusions
We found evidence for the validity and reliability of this brief measure of child maltreatment using data from a large survey combining information from parents and their children.
Maltreatment; adversity; child; cohort; early life stress
Objetivo
Investigar a validade e confiabilidade de uma abordagem de múltiplos informantes para a mensuração de maus-tratos na infância, composta por sete questões avaliando maus-tratos na infância respondidas pelas crianças e seus pais em uma ampla amostra comunitária.
Métodos
A amostra foi composta por 2.512 crianças com idades entre 6 e 12 anos e seus pais. Maus-tratos na infância foram avaliados com três questões respondidas pelas crianças e quatro respondidas pelos seus pais, investigando violência física, negligência física, violência emocional e violência sexual. Análises fatoriais confirmatórias foram utilizadas para comparar os índices de ajuste de diferentes modelos. Validade convergente e divergente foi testada utilizando escores de relato parental e de relato dos professores no Strengths and Difficulties Questionnaire. Validade discriminante foi investigada utilizando a entrevista Development and Well-Being Assessment para dividir os participantes em cinco grupos diagnósticos: controles com desenvolvimento típico (n = 1.880), transtornos do medo (n = 108), transtornos do estresse (n = 76), transtorno de déficit de atenção-hiperatividade (n = 143) e transtorno opositivo-desafiador/conduta (n = 56).
Resultados
Um modelo de segunda ordem com um fator de segunda ordem (maus-tratos na infância) englobando dois fatores de primeira ordem (relato da criança e relato parental) demonstrou o melhor ajuste aos dados, e os resultados de confiabilidade desse modelo foram aceitáveis. Como esperado, maus-tratos na infância estiveram positivamente associados a medidas de psicopatologia e negativamente associados a medidas pró-sociais. Todos os grupos de categorias diagnósticas tiveram níveis mais altos de maus-tratos na infância do que as crianças com desenvolvimento típico.
Conclusões
Foram encontradas evidências de validade e confiabilidade dessa medida breve de maus-tratos na infância utilizando dados de um grande levantamento combinando o relato de pais e seus filhos.
Maus-tratos; adversidade; crianças; coorte; estresse precoce
Introduction
Child maltreatment (CM) is a strong risk factor for many of the leading causes of death, disease, and disability.11. Felitti VJ, Anda RF, Nordenberg D, Williamson DF, Spitz AM, Edwards V, et al. Relationship of childhood abuse and household dysfunction to many of the leading causes of death in adults. The Adverse Childhood Experiences (ACE) Study. Am J Prev Med. 1998;14:245-58.
2. Anda RF, Dong M, Brown DW, Felitti VJ, Giles WH, Perry GS, et al. The relationship of adverse childhood experiences to a history of premature death of family members. BMC Public Health. 2009;9:106.-33. Daruy-Filho L, Brietzke E, Lafer B, Grassi-Oliveira R. Childhood maltreatment and clinical outcomes of bipolar disorder. Acta Psychiatr Scand. 2011;124:427-34. Child maltreatment involves a range of harmful behaviors that adults present towards children, including emotional, physical and sexual abuse, as well as emotional and physical neglect. Previous research has consistently associated CM with increased risk of poor physical health in adulthood44. Wegman HL, Stetler C. A meta-analytic review of the effects of childhood abuse on medical outcomes in adulthood. Psychosom Med. 2009;71:805-12. and lifetime psychopathology.55. MacMillan HL, Fleming JE, Streiner DL, Lin E, Boyle MH, Jamieson E, et al. Childhood abuse and lifetime psychopathology in a community sample. Am J Psychiatry. 2001;158:1878-83.,66. Springer KW, Sheridan J, Kuo D, Carnes M. Long-term physical and mental health consequences of childhood physical abuse: results from a large population-based sample of men and women. Child Abuse Negl. 2007;31:517-30.
The conceptual and operational adequacy of risk assessment tools is debatable, with no definitive "gold" standard. Specifically, two important questions emerge from assessment of child maltreatment using survey data. First, the validity and reliability of short measures to assess a child maltreatment latent construct have rarely been examined. Second, integrating data from multiple informants into a single measure has been a challenge to researchers interested in a single estimate of the latent construct.
Here we report on data from the High Risk Cohort Study for Psychiatric Disorders (HRC Study),77. Salum GA, Gadelha A, Pan PM, Moriyama TS, Graeff-Martins AS, Tamanaha AC, et al. High risk cohort study for psychiatric disorders in childhood: rationale, design, methods and preliminary results. Int J Methods Psychiatr Res. 2015;24:58-73. a Brazilian large community survey. We investigated the validity and reliability of a measure of child maltreatment comprising seven questions, three answered by the children and four answered by their parents. We also used confirmatory factor analysis to integrate information from multiple informants. Convergent and divergent validity were evaluated using measures of psychopathology symptoms and pro-sociality respectively. Groups with different psychiatric diagnoses were used to demonstrate discriminant validity.
Methods
Participants
The sample is part of a large, school-based, community study of children aged 6 to 12 years (at screening) from 57 schools in two Brazilian cities - Porto Alegre (n = 22) and São Paulo (n = 35). The research protocol was submitted to and approved by the Ethics Committees at the Universidade de São Paulo and the Universidade Federal do Rio Grande do Sul, Brazil, and written consent was obtained from parents of all participants, as well as verbal assent from all children before enrollment. Children who reported child maltreatment were invited to a clinical interview with a psychiatrist to investigate the level of exposure to CM and when appropriate, to be referred to child protection services. Child protection services are the institutions responsible for evaluating each case and, when a suspicion of CM is confirmed, for taking the appropriate legal measures. Additionally, all children with a positive diagnosis of a mental disorder were contacted for psychoeducation about the diagnosis and for referral to family health units for appropriate treatment.
During the screening phase, conducted on their school's registration day, 9,937 informants were interviewed using the Family History Survey (FHS).88. Weissman MM, Wickramaratne P, Adams P, Wolk S, Verdeli H, Olfson M. Brief screening for family psychiatric history: the family history screen. Arch Gen Psychiatry. 2000;57:675-82. From this pool, we recruited two subgroups using a random (n = 958) and a high-risk (n = 1,514) group selection procedure, resulting in a total sample of 2,512 children.77. Salum GA, Gadelha A, Pan PM, Moriyama TS, Graeff-Martins AS, Tamanaha AC, et al. High risk cohort study for psychiatric disorders in childhood: rationale, design, methods and preliminary results. Int J Methods Psychiatr Res. 2015;24:58-73. Subjects in the random stratum were selected using a simple randomization procedure based on school rolls, without replacement of non-available subjects. Selection for the high-risk stratum involved a risk-prioritization procedure, focused on individuals with a family history of a disorder and/or ongoing symptoms in one of five targeted domains (attention deficit hyperactivity disorder [ADHD], anxiety, obsessive-compulsive disorder [OCD], psychosis and learning disorders), as detected during screening. Subjects in this second, high-risk stratum were oversampled and, if not available, replaced by the next subject listed in the high-risk sampling frame. The details of the sample selection procedures can be found elsewhere.77. Salum GA, Gadelha A, Pan PM, Moriyama TS, Graeff-Martins AS, Tamanaha AC, et al. High risk cohort study for psychiatric disorders in childhood: rationale, design, methods and preliminary results. Int J Methods Psychiatr Res. 2015;24:58-73. Of these 2,512 subjects, all parent reports on child maltreatment were available (94.9% answered by biological mothers and 5.1% answered by biological fathers). A total of 2,213 (88.1%) child reports on CM were also available.
Child maltreatment assessment
The questions about child maltreatment were selected to represent four categories of CM that have been distinguished in the literature: a) physical abuse (infliction of bodily injury by non-accidental means); b) neglect (failure to provide minimum care and/or lack of supervision); c) emotional maltreatment (pervasive and extreme thwarting of a child's basic emotional needs); and d) sexual abuse (sexual contact or attempted contact for purposes of sexual gratification or financial gain).99. Barnett D, Manly JT, Cicchetti D. Defining child maltreatment: the interface between policy and research. In: Cicchetti D, Toth SL, editors. Child abuse, child development, and social policy. Norwood: Ablex; 1993. p. 7-73. Similar questions are frequently used in survey research1010. Kieling C, Hutz MH, Genro JP, Polanczyk GV, Anselmi L, Camey S, et al. Gene-environment interaction in externalizing problems among adolescents: evidence from the Pelotas 1993 Birth Cohort Study. J Child Psychol Psychiatry. 2013;54:298-304.
11. Caspi A, Sugden K, Moffitt TE, Taylor A, Craig IW, Harrington H, et al. Influence of life stress on depression: moderation by a polymorphism in the 5-HTT gene. Science. 2003;301:386-9.-1212. Caspi A, McClay J, Moffitt TE, Mill J, Martin J, Craig IW, et al. Role of genotype in the cycle of violence in maltreated children. Science. 2002;297:851-4. and they are close to the constructs evaluated by other instruments that assess child maltreatment more comprehensively, such as the Childhood Trauma Questionnaire.1313. Bernstein DP, Stein JA, Newcomb MD, Walker E, Pogge D, Ahluvalia T, et al. Development and validation of a brief screening version of the Childhood Trauma Questionnaire. Child Abuse Negl. 2003;27:169-90.
14. Bernstein DP, Ahluvalia T, Pogge D, Handelsman L. Validity of the Childhood Trauma Questionnaire in an adolescent psychiatric population. J Am Acad Child Adolesc Psychiatry. 1997;36:340-8.
15. Grassi-Oliveira R, Cogo-Moreira H, Salum GA, Brietzke E, Viola TW, Manfro GG, et al. Childhood Trauma Questionnaire (CTQ) in Brazilian samples of different age groups: findings from confirmatory factor analysis. PLoS One. 2014;9:e87118.-1616. Grassi-Oliveira R, Stein LM, Pezzi JC. [Translation and content validation of the Childhood Trauma Questionnaire into Portuguese language]. Rev Saude Publica. 2006;40:249-55e.
Trained lay interviewers administered the research protocol to parents, using the following questions:
-
- Has [name of the child] ever been seriously beaten by an adult (including yourself) at home, hurting him/her or leaving bruises or marks?
-
- Has [name of the child] ever not had enough to eat or been forced to use dirty or torn clothes?
-
- Has [name of the child] ever been cursed with words like stupid, idiot, dumb or useless or been exposed to someone shouting or screaming?
-
- Has anyone ever done anything sexual with [name of the child] or threatened to hurt him/her if [name of the child] refused to do it?
The first three questions were also rephrased to make them apply to the children and administered by trained clinical psychologists, as follows:
-
- Have you ever been seriously beaten by an adult at home, hurting you or leaving bruises or marks?
-
- Have you ever not had enough to eat or been forced to use dirty or torn clothes?
-
- Have you ever been cursed with words like stupid, idiot, dumb or useless or been exposed to someone shouting or screaming?
Responses to these seven questions were rated on a 4-point scale: 0, never; 1, one or two times; 2, sometimes; 3, frequently. The forms used in the study are available on request.
Strengths and Difficulties Questionnaire (SDQ)
The SDQ is a measure of mental health problems in children that can be administered to their parents or teachers or to the children themselves.1717. Goodman R. The Strengths and Difficulties Questionnaire: a research note. J Child Psychol Psychiatry. 1997;38:581-6.
18. Goodman R. Psychometric properties of the strengths and difficulties questionnaire. J Am Acad Child Adolesc Psychiatry. 2001;40:1337-45.-1919. Goodman A, Goodman R. Strengths and difficulties questionnaire as a dimensional measure of child mental health. J Am Acad Child Adolesc Psychiatry. 2009;48:400-3. It comprises 20 items related to emotional symptoms, conduct problems, hyperactivity, and peer problems, rated on a 3-point scale, as follows: 0, not true; 1, somewhat true; 2, certainly true. Item scores were summed to create a total difficulty score ranging from 0 to 40. The SDQ also contains five items investigating prosocial behaviors. These questions are then followed by a single item assessing whether the respondent thinks that the child has a problem with "emotions, concentration, behavior, or being able to get along with other people" (response options: no problems, minor problems, definite problems, and severe problems). This last item is used to classify the impact caused by the psychiatric symptoms assessed. The Brazilian version of the SDQ was used in this study. This measure has been translated into Brazilian-Portuguese and has previously been used in large community investigations.2020. Goodman A, Fleitlich-Bilyk B, Patel V, Goodman R. Child, family, school and community risk factors for poor mental health in Brazilian schoolchildren. J Am Acad Child Adolesc Psychiatry. 2007;46:448-56. Parent SDQ reports were available for all of the children in the sample (n = 2,512). Teacher SDQ reports were also available for a subset of 1,189 of the children. Some children had more than one teacher, in which case the teacher who was spending more time with the child was chosen to answer the SDQ.
Psychiatric diagnosis
Psychiatric diagnoses were established using the Development and Well-Being Assessment (DAWBA).2121. Goodman R, Ford T, Richards H, Gatward R, Meltzer H. The Development and Well-Being Assessment: description and initial validation of an integrated assessment of child and adolescent psychopathology. J Child Psychol Psychiatry. 2000;41:645-55. The DAWBA is a structured interview administered by lay interviewers who also record verbatim responses of any reported problems. Verbatim responses and structured questions are then carefully evaluated by psychiatrists, who confirm or refute diagnoses. All questions are closely related to diagnostic criteria from the Diagnostic and Statistical Manual of Mental Disorders, 4th edition (DSM-IV), and focus on current problems causing significant distress or social impairment. The DAWBA has been translated into several languages, and for the present study we used the Brazilian-Portuguese version,2222. Fleitlich-Bilyk B, Goodman R. Prevalence of child and adolescent psychiatric disorders in southeast Brazil. J Am Acad Child Adolesc Psychiatry. 2004;43:727-34. administered to a biological parent who was legally responsible for the child. Administration was performed in accordance with previously reported procedures.2121. Goodman R, Ford T, Richards H, Gatward R, Meltzer H. The Development and Well-Being Assessment: description and initial validation of an integrated assessment of child and adolescent psychopathology. J Child Psychol Psychiatry. 2000;41:645-55. Nine psychiatrists performed the rating procedures, all trained and supervised by a senior child psychiatrist.
For the purposes of this study we allocated each child to one of five non-overlapping groups: 1) typically developing controls (TDC; n = 1,880): subjects without any psychiatric disorder; 2) ADHD: subjects with any ADHD subtype (n = 143); 3) fear disorders: subjects with separation anxiety disorder, social anxiety disorder, specific phobia, or agoraphobia (n = 108); 4) distress disorders: subjects with generalized anxiety disorder, depression (major or not otherwise specified), or posttraumatic stress disorder (n = 76); or 5) oppositional defiant disorder or conduct disorder (ODD or CD; n = 56). All subjects with co-morbid conditions were excluded from these analyses. These diagnostic groups were chosen on the basis of evidence from twin studies2323. Lahey BB, Van Hulle CA, Singh AL, Waldman ID, Rathouz PJ. Higher-order genetic and environmental structure of prevalent forms of child and adolescent psychopathology. Arch Gen Psychiatry. 2011;68:181-9.,2424. Kendler KS, Prescott CA, Myers J, Neale MC. The structure of genetic and environmental risk factors for common psychiatric and substance use disorders in men and women. Arch Gen Psychiatry. 2003;60:929-37. and research on symptom structure.2525. Watson D. Rethinking the mood and anxiety disorders: a quantitative hierarchical model for DSM-V. J Abnorm Psychol. 2005;114:522-36.
26. Watson D, O'Hara MW, Stuart S. Hierarchical structures of affect and psychopathology and their implications for the classification of emotional disorders. Depress Anxiety. 2008;25:282-8.
27. Krueger RF. The structure of common mental disorders. Arch Gen Psychiatry. 1999;56:921-6.
28. Trosper SE, Whitton SW, Brown TA, Pincus DB. Understanding the latent structure of the emotional disorders in children and adolescents. J Abnorm Child Psychol. 2012;40:621-32.-2929. Vollebergh WA, Iedema J, Bijl RV, de Graaf R, Smit F, Ormel J. The structure and stability of common mental disorders: the NEMESIS study. Arch Gen Psychiatry. 2001;58:597-603.
Data analysis
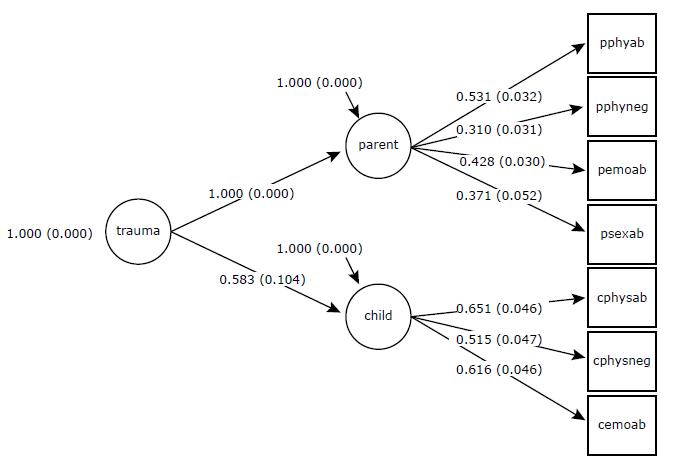
Since we aimed to combine information from child and parent reports and at the same time to fit a unidimensional measure of child maltreatment, we used confirmatory factor analysis (CFA) to test three theoretical models: a unidimensional model (all items loading into a single child maltreatment estimate); a bifactor model (all items loading into a general maltreatment estimate and residuals loading into a parent group factor and a child group factor); and a higher-order model (a higher-order factor of child maltreatment fully encompassing two lower-order factors - child and parent report). The small number of indicators precluded use of CFA to analyze multitrait-multimethod matrices.
The CFA models were fitted to polychoric correlations among items using the weighted least squares means and variance adjusted (WLSMV) estimator implemented in Mplus 7.0 software.3030. Muthén LK, Muthén BO. Mplus User's Guide. 7th ed. Los Angeles: Muthén & Muthén; 2012. Model fit was deemed adequate if the comparative fit index (CFI) and the Tucker-Lewis index (TLI) were ≥ 0.95 and the root square mean error of approximation (RSMEA) was < 0.06. Model fit was deemed acceptable if CFI and TLI were ≥ 0.90 and RMSEA was < 0.08.3131. Cook KF, Kallen MA, Amtmann D. Having a fit: impact of number of items and distribution of data on traditional criteria for assessing IRT's unidimensionality assumption. Qual Life Res. 2009;18:447-60.,3232. Hu L, Bentler PM. Fit indices in covariance structure modeling: sensitivity to underparameterized model misspecification. Psychol Methods. 1998;3:424-53.
In Mplus, CFA can be used to investigate both factor loadings and thresholds. Factor loadings indicate how well the question reflects the underlying dimension, i.e., the relative contribution that each item makes to the latent trait. Threshold parameters reflect the standardized level of severity of the latent trait at which subsequent response options become more probable than the previous option (i.e. for choosing a response option of frequently or higher vs. sometimes or lower). Confirmatory factor analysis with categorical indicators is equivalent to item response theory (IRT) analyses of these parameters, with factor loadings being analogous to item discrimination parameters, and item thresholds being analogous to item difficulty parameters or item location parameters. Scale reliability was estimated from CFA results.3333. Joreskog JG. Simultaneous factor analysis in several populations. Psychometrika. 1971;36:409-26.,3434. Dillon WR, Goldstein M. Multivariate analysis: methods and applications. Canada: John Wiley & Sons; 1984. Missing data on child reports were assumed to be distributed at random. The Mplus pairwise present method was used to estimate scores for subjects with missing information.
Pearson coefficients were calculated for correlations between the factor scores that emerged from CFA of the model that presented the best fit and the total and subscale scores of parent and teacher SDQ reports. The SDQ scores were used to investigate convergent and divergent validity. We hypothesized that the higher the level of child maltreatment report, the higher the number of psychiatric symptoms, and so such a finding would provide evidence of convergent validity. We also hypothesized that the lower the levels of maltreatment, the higher the number of prosocial behaviors, and so observation of this relationship would provide evidence of divergent validity. Discriminant validity was investigated using one-way analysis of variance (ANOVA) to compare the five groups divided according to their diagnostic categories in the DAWBA, using false discovery rate to control for multiple comparisons.
Results
The sample was 46.9% female (n = 1,177) and had a mean age of 10.6±1.46 years. Socioeconomic status was classified as: middle (n = 1,624; 64.6%), high (n = 738; 29.4%) and low/very low (n = 150; 6%). The children's mean parent-reported total SDQ difficulties score was 15.0±7.9 and their mean teacher-reported SDQ was 10.0±7.25.
Confirmatory factor analysis and reliability
A unidimensional model encompassing all seven items did not provide an acceptable fit to the data (χ22. Anda RF, Dong M, Brown DW, Felitti VJ, Giles WH, Perry GS, et al. The relationship of adverse childhood experiences to a history of premature death of family members. BMC Public Health. 2009;9:106. = 254.971, degrees of freedom [df] = 14, p < 0.001; RMSEA = 0.083 (90% confidence interval [90%CI] 0.074-0.092); CFI = 0.758; TLI = 0.637). A bifactor model with one general factor encompassing all items and two group factors (parent and child reports) did exhibit an adequate fit (χ22. Anda RF, Dong M, Brown DW, Felitti VJ, Giles WH, Perry GS, et al. The relationship of adverse childhood experiences to a history of premature death of family members. BMC Public Health. 2009;9:106. = 26.147, df = 7, p = 0.0005; RMSEA = 0.033 (90%CI 0.020-0.047); CFI = 0.981; TLI = 0.942). However, inspection of the factor loadings revealed that the general factor only captured the variance of the parent report items. Therefore, all child items only loaded onto the child group factor, limiting the utility of the general factor and integration of information from both informants. The higher-order model with two lower-order factors (parent report and child report) and a higher-order factor (child maltreatment) presented the best fit to the data out of the three models tested (χ22. Anda RF, Dong M, Brown DW, Felitti VJ, Giles WH, Perry GS, et al. The relationship of adverse childhood experiences to a history of premature death of family members. BMC Public Health. 2009;9:106. = 29.9, df = 13, p = 0.0047; RMSEA = 0.023 (90%CI 0.012-0.034); CFI = 0.983; TLI = 0.972), and the two-factor correlated models also exhibited appropriateness (same fit indices). Therefore, subsequent analyses were only performed for the higher-order model.
Working with this model, inspection of the factor loadings revealed that all factor loadings were above 0.40 (highest: child physical abuse report λ = 0.754; lowest: parent physical neglect report λ = 0.596). Inspection of item thresholds revealed that, as expected, the levels of child maltreatment required for endorsement of the questions followed the following ascending order: emotional abuse questions in both parent and child reports, physical abuse in both reports, physical neglect in both reports and, finally, sexual abuse in parent report (Table 1 and Figure 1).The model-based reliability computed from the model was 0.80 for the higher-order factor, 0.83 for the parent factor and 0.87 for the child factor (Table 2).
Convergent and divergent validity
As expected, both parent and teacher SDQ total scores and their scores for the subscales assessing emotional, hyperactivity, behavioral and prosocial problems exhibited small to moderate positive correlations with total CM, parent CM and child CM scores (except for the correlation between emotional symptoms reported by teachers and child-report CM). We also observed small negative correlations between the prosocial SDQ score in both parent and teacher reports and the total CM, parent CM and child CM scores. It should be noted that the magnitude of the correlations is attenuated from parent to teacher reports, which may reflect informant effects (i.e., parents informed on both child maltreatment and psychiatric symptoms; whereas teachers informed only on psychiatric symptoms) (Table 3).
Discriminant validity
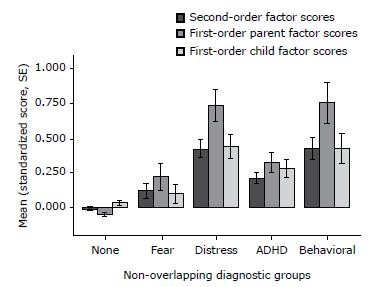
There were significant differences in CM scores between groups selected according to DAWBA results, for the combined score (F4,2258 = 33.63, p < 0.001, ω2 = 0.055), parent score (F4,2258 = 33.57, p < 0.001, ω2 = 0.054) and child score (F4,2258 = 14.57, p < 0.001, ω2 = 0.023). Overall CM levels were higher in all diagnostic category groups than for the typically developing children (except for child scores in the comparison of fear vs. TDC), with moderate to strong effect sizes (Cohen's d ranging from 0.30 to 1.0). Comparisons between different diagnostic groups revealed that CM levels were higher in the distress and ODD/CD groups than in the ADHD and fear groups for combined and parent scores (but not for child scores). Post-hoc comparisons are shown in Table 4 and Figure 2.
- Lower-order and higher-order factor scores for non-overlapping diagnostic groups. ADHD = attention deficit hyperactivity disorder; SE = standard error.
Supplemental analysis
Table 5 lists the levels of exposure for each type of maltreatment in our sample, in order to provide a clearer report of the level of exposure to CM in the sample. According to both child and parent reports, the most frequent type of CM was emotional abuse. As expected, frequencies of CM were higher in the high-risk subset than in the randomly selected subset (Table 5).
We also used the CFA results to generate a categorical classification of the children's level of exposure. The category thresholds from the CFA results represent the standardized level of exposure to CM at which subsequent response options become more probable than the previous one and these were used to define "high exposure" in each type of maltreatment event, with a value of 1.5 deemed as indicative of high exposure. High exposure in parents' reports was then defined as: physical abuse and physical neglect rated sometimes or frequently, sexual abuse rated rarely, sometimes or frequently, and emotional abuse rated frequently. High exposure in children's reports was defined as: physical abuse rated sometimes or frequently, physical neglect rated rarely, sometimes or frequently, and emotional abuse rated frequently. Based on these criteria, the prevalence of high exposure to CM for any type of trauma in our sample was 12.1% according to parent-report scores and 12.5% according to child-report scores (Table 5).
Discussion
The purpose of this study was to investigate the validity and reliability of a child maltreatment measure comprising seven questions, three answered by children and four answered by the parents, in a large community sample. We found that a higher-order model including CM as a higher-order factor and the informants (child or parent) as lower-order factors exhibited the best fit to the data. We also found, as expected, that higher child maltreatment scores were positively associated with higher psychopathology scores and negatively associated with scores for prosocial behavior.3535. Teicher MH, Samson JA. Childhood maltreatment and psychopathology: a case for ecophenotypic variants as clinically and neurobiologically distinct subtypes. Am J Psychiatry. 2013;170:1114-33. Furthermore, all levels of overall maltreatment were higher among children from diagnostic category groups than among typically developing children. The prevalence rates of high levels of exposure to CM estimated in this study were 12.1% according to parent-report scores and 12.5% according to child-report scores, which is above global estimates that suggest that 1 in 15 (around 7%) children are victims of maltreatment annually.3636. Svevo-Cianci KA, Hart SN, Rubinson C. Protecting children from violence and maltreatment: a qualitative comparative analysis assessing the implementation of U.N. CRC Article 19. Child Abuse Negl. 2010;34:45-56. Since there is a lack of standardized Brazilian statistics on the prevalence of CM in community-based samples it is hard to compare this finding to national data.3737. Scomparini LB, Santos Bd, Rosenheck RA, Scivoletto S. Association of child maltreatment and psychiatric diagnosis in Brazilian children and adolescents. Clinics (Sao Paulo). 2013;68:1096-102. Our results provide initial evidence of the validity of this brief measure for assessment of child maltreatment. Large-scale studies often have to balance the comprehensiveness of the assessment measures with the time needed for assessment, in order to both capture the phenomena at hand and maintain study feasibility. We have demonstrated that a very brief instrument with a unidimensional structure was able to measure CM reliably and to differentiate psychopathology groups. Therefore, this might offer an effective alternative for large surveys that aim to assess CM but do not have enough time to use longer assessment protocols for this specific construct. Consistent with these aims, the measure presented in this study is among the least time consuming measures available in the current literature3838. Strand VC, Sarmiento TL, Pasquale LE. Assessment and screening tools for trauma in children and adolescents: a review. Trauma Violence Abuse. 2005;6:55-78. and among the few that have been shown to be valid for subjects in low and middle-income countries.1515. Grassi-Oliveira R, Cogo-Moreira H, Salum GA, Brietzke E, Viola TW, Manfro GG, et al. Childhood Trauma Questionnaire (CTQ) in Brazilian samples of different age groups: findings from confirmatory factor analysis. PLoS One. 2014;9:e87118.,3939. Osorio FL, Salum GA, Donadon MF, Forni-Dos-Santos L, Loureiro SR, Crippa JA. Psychometrics properties of early trauma inventory self report - short form (ETISR-SR) for the Brazilian context. PLoS One. 2013;8:e76337.
Another important characteristic of this measure is that we used higher-order confirmatory factor analysis to integrate multiple sources of information about a phenomenon as complex as child maltreatment. Agreement between parents and children on rates of child maltreatment has been shown to be low to moderate4040. Chan KL. Comparison of parent and child reports on child maltreatment in a representative household sample in Hong Kong. J Fam Violence. 2012;27:11-21.,4141. Tajima EA, Herrenkohl TI, Huang B, Whitney SD. Measuring child maltreatment: a comparison of prospective parent reports and retrospective adolescent reports. Am J Orthopsychiatry. 2004;74:424-35. but both have been shown to predict health-related outcomes.4141. Tajima EA, Herrenkohl TI, Huang B, Whitney SD. Measuring child maltreatment: a comparison of prospective parent reports and retrospective adolescent reports. Am J Orthopsychiatry. 2004;74:424-35. Therefore, reliance on a single source could overlook valuable information,4242. Shaffer A, Huston L, Egeland B. Identification of child maltreatment using prospective and self-report methodologies: a comparison of maltreatment incidence and relation to later psychopathology. Child Abuse Negl. 2008;32:682-92. since parents and children often have different perspectives4343. Achenbach TM, McConaughy SH, Howell CT. Child/adolescent behavioral and emotional problems: implications of cross-informant correlations for situational specificity. Psychol Bull. 1987;101:213-32. and both are likely to be valid.4141. Tajima EA, Herrenkohl TI, Huang B, Whitney SD. Measuring child maltreatment: a comparison of prospective parent reports and retrospective adolescent reports. Am J Orthopsychiatry. 2004;74:424-35.,4242. Shaffer A, Huston L, Egeland B. Identification of child maltreatment using prospective and self-report methodologies: a comparison of maltreatment incidence and relation to later psychopathology. Child Abuse Negl. 2008;32:682-92. More importantly, when reports from multiple informants are available, they are often analyzed separately. Higher-order CFA provides an interesting framework for conceptualizing the contributions of both parents and children to the same CM latent trait.
Lastly, although our CM assessment items may have face validity, we did not conduct a more thorough investigation of content validity. Nonetheless, the convergent, divergent, and discriminant validity results support the measure's criterion validity. As part of this approach, the questionnaire was administered to different groups that were expected to have different levels of the latent trait being measured, in order to confirm whether the difference hypothesized was reflected in the measure's scores.4444. Davidson M. Known-groups validity. In: Michalos A, editor. Encyclopedia of quality of life and well-being research. Netherlands: Springer; 2014. p. 3481-2. In this study we found higher levels of overall child maltreatment within groups with mental disorders, particularly among distress and ODD/CD groups.
This study has certain limitations. First, convergent validity with a measure of psychopathology symptoms was tested, but no other measure of child maltreatment was used. However, this limitation is linked to the absence of a gold-standard for evaluation of CM. Second, this assessment does not enable investigation of the nature or duration of CM events. Nonetheless, it is still an interesting option to measure CM unidimensionally considering the short time needed and the lower complexity of the assessment. Lastly, given the small number of indicators, multitrait-multimethod approaches could not be applied. In spite of this, we used a higher-order CFA approach to integrate information from both parents and children into a single measure and into specific measures of child maltreatment.
The study also has some important strengths. This is one of the few studies attempting to integrate multi-informant information into a single measure and one of the few investigating the validity of instruments specifically developed for survey data using a large community sample of children and early adolescents from a middle-income country.
In summary, this brief measure of child maltreatment has proven to be a valid and reliable instrument for large-scale community studies that aim to assess levels of child maltreatment in the population.
References
-
1Felitti VJ, Anda RF, Nordenberg D, Williamson DF, Spitz AM, Edwards V, et al. Relationship of childhood abuse and household dysfunction to many of the leading causes of death in adults. The Adverse Childhood Experiences (ACE) Study. Am J Prev Med. 1998;14:245-58.
-
2Anda RF, Dong M, Brown DW, Felitti VJ, Giles WH, Perry GS, et al. The relationship of adverse childhood experiences to a history of premature death of family members. BMC Public Health. 2009;9:106.
-
3Daruy-Filho L, Brietzke E, Lafer B, Grassi-Oliveira R. Childhood maltreatment and clinical outcomes of bipolar disorder. Acta Psychiatr Scand. 2011;124:427-34.
-
4Wegman HL, Stetler C. A meta-analytic review of the effects of childhood abuse on medical outcomes in adulthood. Psychosom Med. 2009;71:805-12.
-
5MacMillan HL, Fleming JE, Streiner DL, Lin E, Boyle MH, Jamieson E, et al. Childhood abuse and lifetime psychopathology in a community sample. Am J Psychiatry. 2001;158:1878-83.
-
6Springer KW, Sheridan J, Kuo D, Carnes M. Long-term physical and mental health consequences of childhood physical abuse: results from a large population-based sample of men and women. Child Abuse Negl. 2007;31:517-30.
-
7Salum GA, Gadelha A, Pan PM, Moriyama TS, Graeff-Martins AS, Tamanaha AC, et al. High risk cohort study for psychiatric disorders in childhood: rationale, design, methods and preliminary results. Int J Methods Psychiatr Res. 2015;24:58-73.
-
8Weissman MM, Wickramaratne P, Adams P, Wolk S, Verdeli H, Olfson M. Brief screening for family psychiatric history: the family history screen. Arch Gen Psychiatry. 2000;57:675-82.
-
9Barnett D, Manly JT, Cicchetti D. Defining child maltreatment: the interface between policy and research. In: Cicchetti D, Toth SL, editors. Child abuse, child development, and social policy. Norwood: Ablex; 1993. p. 7-73.
-
10Kieling C, Hutz MH, Genro JP, Polanczyk GV, Anselmi L, Camey S, et al. Gene-environment interaction in externalizing problems among adolescents: evidence from the Pelotas 1993 Birth Cohort Study. J Child Psychol Psychiatry. 2013;54:298-304.
-
11Caspi A, Sugden K, Moffitt TE, Taylor A, Craig IW, Harrington H, et al. Influence of life stress on depression: moderation by a polymorphism in the 5-HTT gene. Science. 2003;301:386-9.
-
12Caspi A, McClay J, Moffitt TE, Mill J, Martin J, Craig IW, et al. Role of genotype in the cycle of violence in maltreated children. Science. 2002;297:851-4.
-
13Bernstein DP, Stein JA, Newcomb MD, Walker E, Pogge D, Ahluvalia T, et al. Development and validation of a brief screening version of the Childhood Trauma Questionnaire. Child Abuse Negl. 2003;27:169-90.
-
14Bernstein DP, Ahluvalia T, Pogge D, Handelsman L. Validity of the Childhood Trauma Questionnaire in an adolescent psychiatric population. J Am Acad Child Adolesc Psychiatry. 1997;36:340-8.
-
15Grassi-Oliveira R, Cogo-Moreira H, Salum GA, Brietzke E, Viola TW, Manfro GG, et al. Childhood Trauma Questionnaire (CTQ) in Brazilian samples of different age groups: findings from confirmatory factor analysis. PLoS One. 2014;9:e87118.
-
16Grassi-Oliveira R, Stein LM, Pezzi JC. [Translation and content validation of the Childhood Trauma Questionnaire into Portuguese language]. Rev Saude Publica. 2006;40:249-55e.
-
17Goodman R. The Strengths and Difficulties Questionnaire: a research note. J Child Psychol Psychiatry. 1997;38:581-6.
-
18Goodman R. Psychometric properties of the strengths and difficulties questionnaire. J Am Acad Child Adolesc Psychiatry. 2001;40:1337-45.
-
19Goodman A, Goodman R. Strengths and difficulties questionnaire as a dimensional measure of child mental health. J Am Acad Child Adolesc Psychiatry. 2009;48:400-3.
-
20Goodman A, Fleitlich-Bilyk B, Patel V, Goodman R. Child, family, school and community risk factors for poor mental health in Brazilian schoolchildren. J Am Acad Child Adolesc Psychiatry. 2007;46:448-56.
-
21Goodman R, Ford T, Richards H, Gatward R, Meltzer H. The Development and Well-Being Assessment: description and initial validation of an integrated assessment of child and adolescent psychopathology. J Child Psychol Psychiatry. 2000;41:645-55.
-
22Fleitlich-Bilyk B, Goodman R. Prevalence of child and adolescent psychiatric disorders in southeast Brazil. J Am Acad Child Adolesc Psychiatry. 2004;43:727-34.
-
23Lahey BB, Van Hulle CA, Singh AL, Waldman ID, Rathouz PJ. Higher-order genetic and environmental structure of prevalent forms of child and adolescent psychopathology. Arch Gen Psychiatry. 2011;68:181-9.
-
24Kendler KS, Prescott CA, Myers J, Neale MC. The structure of genetic and environmental risk factors for common psychiatric and substance use disorders in men and women. Arch Gen Psychiatry. 2003;60:929-37.
-
25Watson D. Rethinking the mood and anxiety disorders: a quantitative hierarchical model for DSM-V. J Abnorm Psychol. 2005;114:522-36.
-
26Watson D, O'Hara MW, Stuart S. Hierarchical structures of affect and psychopathology and their implications for the classification of emotional disorders. Depress Anxiety. 2008;25:282-8.
-
27Krueger RF. The structure of common mental disorders. Arch Gen Psychiatry. 1999;56:921-6.
-
28Trosper SE, Whitton SW, Brown TA, Pincus DB. Understanding the latent structure of the emotional disorders in children and adolescents. J Abnorm Child Psychol. 2012;40:621-32.
-
29Vollebergh WA, Iedema J, Bijl RV, de Graaf R, Smit F, Ormel J. The structure and stability of common mental disorders: the NEMESIS study. Arch Gen Psychiatry. 2001;58:597-603.
-
30Muthén LK, Muthén BO. Mplus User's Guide. 7th ed. Los Angeles: Muthén & Muthén; 2012.
-
31Cook KF, Kallen MA, Amtmann D. Having a fit: impact of number of items and distribution of data on traditional criteria for assessing IRT's unidimensionality assumption. Qual Life Res. 2009;18:447-60.
-
32Hu L, Bentler PM. Fit indices in covariance structure modeling: sensitivity to underparameterized model misspecification. Psychol Methods. 1998;3:424-53.
-
33Joreskog JG. Simultaneous factor analysis in several populations. Psychometrika. 1971;36:409-26.
-
34Dillon WR, Goldstein M. Multivariate analysis: methods and applications. Canada: John Wiley & Sons; 1984.
-
35Teicher MH, Samson JA. Childhood maltreatment and psychopathology: a case for ecophenotypic variants as clinically and neurobiologically distinct subtypes. Am J Psychiatry. 2013;170:1114-33.
-
36Svevo-Cianci KA, Hart SN, Rubinson C. Protecting children from violence and maltreatment: a qualitative comparative analysis assessing the implementation of U.N. CRC Article 19. Child Abuse Negl. 2010;34:45-56.
-
37Scomparini LB, Santos Bd, Rosenheck RA, Scivoletto S. Association of child maltreatment and psychiatric diagnosis in Brazilian children and adolescents. Clinics (Sao Paulo). 2013;68:1096-102.
-
38Strand VC, Sarmiento TL, Pasquale LE. Assessment and screening tools for trauma in children and adolescents: a review. Trauma Violence Abuse. 2005;6:55-78.
-
39Osorio FL, Salum GA, Donadon MF, Forni-Dos-Santos L, Loureiro SR, Crippa JA. Psychometrics properties of early trauma inventory self report - short form (ETISR-SR) for the Brazilian context. PLoS One. 2013;8:e76337.
-
40Chan KL. Comparison of parent and child reports on child maltreatment in a representative household sample in Hong Kong. J Fam Violence. 2012;27:11-21.
-
41Tajima EA, Herrenkohl TI, Huang B, Whitney SD. Measuring child maltreatment: a comparison of prospective parent reports and retrospective adolescent reports. Am J Orthopsychiatry. 2004;74:424-35.
-
42Shaffer A, Huston L, Egeland B. Identification of child maltreatment using prospective and self-report methodologies: a comparison of maltreatment incidence and relation to later psychopathology. Child Abuse Negl. 2008;32:682-92.
-
43Achenbach TM, McConaughy SH, Howell CT. Child/adolescent behavioral and emotional problems: implications of cross-informant correlations for situational specificity. Psychol Bull. 1987;101:213-32.
-
44Davidson M. Known-groups validity. In: Michalos A, editor. Encyclopedia of quality of life and well-being research. Netherlands: Springer; 2014. p. 3481-2.
-
Financial support: Conselho Nacional de Desenvolvimento Científico e Tecnológico (CNPq), Coordenação de Aperfeiçoamento de Pessoal de Nível Superior (CAPES), Instituto Nacional de Psiquiatria do Desenvolvimento para Crianças e Adolescentes (INPD; grant no. 573974/2008-0), Fundação de Amparo à Pesquisa do Estado de São Paulo (FAPESP; grant no. 2008/57896-8), and Fundação de Amparo à Pesquisa do Estado do Rio Grande do Sul (FAPERGS).
-
Erratum
We hereby inform a mistake in the first name of author Elisa Brietzke, in the article entitled "Measuring child maltreatment using multi-informant survey data: a higher-order confirmatory factor analysis" (doi: http://dx.doi.org/10.1590/2237-6089-2015-0036), published in ahead of print mode and included in the present issue (volume 38, issue 1, pages 23-32). In the author byline, "Eliza" should read "Elisa."
Publication Dates
-
Publication in this collection
18 Mar 2016 -
Date of issue
Jan-Mar 2016
History
-
Received
17 Jan 2015 -
Accepted
17 Sept 2015