Abstracts
The induced colorectal carcinogenesis in rodents has a long history and currently uses the substances 1,2-dimethylhydrazine and azoxymethane.
Objective:
The aim of this study was to compare the inductive effect of the substances azoxymethane and 1,2-dimethylhydrazine in colorectal carcinogenesis.
Method:
30 randomly chosen male Wistar rats were divided into four groups. G1 group was treated with 1,2-dimethylhydrazine and C1 was its control group; G2 group was treated azoxymethane and C2 was its control group. The animals were weekly weighed until euthanasia, when their intestines were removed, processed and analyzed by an experienced pathologist.
Results:
Among the control groups (C1 and C2) no histologic changes were observed; moderate dysplasia was detected in G2 group; hyperplasia, mild dysplasia, severe dysplasia and carcinoma were observed in G1 group. When this study compared the cost of the substances, 1,2-dimethylhydrazine was more than 50 times less expensive than azoxymethane.
Conclusion:
Azoxymethane is able to promote histological changes consistent with colorectal carcinogenesis. 1,2-Dimethylhydrazine produced neoplasia and dysplasia, and, compared to the azoxymethane, was more efficient in the induction of colorectal cancer.
Colorectal cancer; Experimental model; Carcinogenesis; Azoxymethane; 1,2-Dimethylhydrazine
A carcinogênese colorretal induzida em roedores tem longa história e utiliza, atualmente, as substâncias 1,2 dimetil-hidrazina (DMH) e azoximetano (AOM).
Objetivo:
Comparar o efeito indutivo das substâncias AOM e DMH para o câncer colorretal (CCR).
Método:
30 ratos Wistar machos foram randomizados em quatro grupos. O grupo G1 foi inoculado com DMH, o grupo C1 foi seu controle; G2 recebeu o AOM e C2 foi seu controle. Os animais foram pesados semanalmente até a eutanásia, quando tiveram seus intestinos retirados, processados e analisados por um patologista experiente.
Resultados:
Os animais dos grupos de controle apresentaram tecido colorretal normal e os animais do grupo G2 apresentaram um padrão de displasia moderada. Nas lâminas do grupo G1, foram encontradas regiões de hiperplasia, displasia leve, displasia grave, e carcinoma. Comparado o custo das substâncias AOM e DMH, este último teve um preço mais de 50 vezes menor ao do AOM.
Conclusão:
AOM é capaz de promover alterações histológicas compatíveis com a carcinogênese colorretal. DMH produziu neoplasia e displasia grave e, comparada ao AOM, foi mais eficiente na indução do câncer colorretal.
Câncer colorretal; Modelo experimental; Carcinogênese; Azoximetano; 1,2-Dimetil-hidrazina
Introduction
The number of new cases of colon and rectal cancer estimated for Brazil in 2012 is 30,140, with 14,180 in men and 15,960 in women.11. Ministério da Saúde; Instituto Nacional do Câncer José Alencar Gomes da Silva, Rio de Janeiro Incidência de câncer no Brasil - Estimativas 2012; 2011.
The etiology of colorectal cancer (CRC) is known to be multi-factorial, including family, environmental and dietary agents. Despite many advances in our understanding of the processes of carcinogenesis, to date, therapies including surgery, radiation and chemotherapy drugs are still limited to treat advanced stages of CRC.22. Barone M, Lofano K, De Tullio N, Licino R, Albano F, Di Leo A. Dietary, endocrine, and metabolic factors in the development of colorectal cancer. J Gastrointest Cancer. 2012;43:13-9.
3. Amaral EGAV. Expressão de superóxido dismutase em focos de criptas aberrantes induzidas pelo azoximentano em ratos wistar e inibição pelo inositol hexafosfato. São Paulo: Dissertação [Mestrado em Ciência] - Universidade Federal de São Paulo - Escola Paulista de Medicina; 2006.-44. Pinho MSL. Biologia molecular do câncer colorretal: Uma revolução silenciosa em andamento. Rev Bras Coloproct. 2008;28:353-68. The only satisfactory answer to the problem of malignancy is its prevention. This involves an extensive search for acquiring knowledge of the basic aspects of carcinogenesis.55. Aguilar JFN, Antich IA, Martínez AP, et al. Cyclooxygenase-2 inhibition in colon experimental carcinogenesis. Rev Esp Enferm Dig. 2005;97:637-47.,66. Plate AYA, Gallaher DD. Effects of indole-3-carbinol and phenethyl isothiocyanate on colon carcinogenesis induced by azoxymethane in rats. Carcinogenesis. 2006;27:287-92.
The carcinogenesis and development of CRC are multi-step processes, characterized by progressive changes in the amount or activity of proteins that regulate the proliferation, differentiation, and cell survival, and that are mediated by genetic mechanisms. An ordered sequence of non-random events leads to the development of colorectal cancer, with the epithelium undergoing an invasive transformation, with progression from normal intestinal epithelium to the development of invasive carcinoma.55. Aguilar JFN, Antich IA, Martínez AP, et al. Cyclooxygenase-2 inhibition in colon experimental carcinogenesis. Rev Esp Enferm Dig. 2005;97:637-47.,77. Bird RP, Good CK. The significance of aberrant crypt foci in understanding the pathogenesis of colon cancer. Toxicol Lett. 2000;112:395-402.
8. Jucá MJ, Nunes BLBBP, Menezes HL, Gomes EGA, Matos D. Metaloproteinases 1 e 7 e câncer colorretal. Rev Bras Coloproct. 2008;28:353-62.
9. Rocha FTR, Lourenço LG, Jucá MJ, Costa V, Leal AT. Quimioprevenção pelo celecoxibe no adenocarcinoma gástrico induzido por refluxo em ratos Wistar submetidos à gastrojejunostomia. Acta Cirúrg Bras. 2009;24:189-94.
10. Gomes EGA, Jucá MJ, Menezes HL, Nunes BLBBP, Costa H, Lima FO, et al. Correlação entre as expressões imunohistoquímicas da MMP-1, MMP-7 e do VEGF no adenocarcinoma colorretal com fatores prognósticos. Acta Cirúrg Bras. 2009;24:303-10.
11. Menezes HL, Jucá MJ, Gomes EGA, Nunes BLBBP, Costa HO, Matos D. Analysis of the immunohistochemical expressions of p53, bcl-2 and Ki-67 in colorectal adenocarcinoma and their correlations with the prognostic factors. Arq Gastroenterol. 2010;47:141-7.-1212. Hisamuddin IM, Yang VW. Molecular genetics of colorectalcancer: an overview. Colorectal Cancer Rep. 2006;2:53-9.
Animal models are good chances to study the biology of disease development. In addition, these models allow for testing hypotheses relating environmental factors to the etiology and prevention of cancer.77. Bird RP, Good CK. The significance of aberrant crypt foci in understanding the pathogenesis of colon cancer. Toxicol Lett. 2000;112:395-402.
The study of colorectal carcinogenesis in rodents has a long history, dating back approximately 80 years. Currently, experimental models use colorectal carcinogens 1,2-dimethylhydrazine (DMH) and azoxymethane (AOM).1313. Perse M, Cerar A. Dimethylhydrazine model is not appropriate for evaluating effect of ethanol on colorectal cancer. Rev Esp Enferm Dig. 2007;99:463-6.
14. Corpet DE, Pierre F. How good are rodent models of carcinogenesis in predicting efficacy in humans? A systematic review and meta-analysis of colon chemoprevention in rats, mice and men. Eur J Cancer. 2005;41:1911-22.
15. Rosemberg DW, Giardina C, Tanaka T. Mouse models for the study of colon carcinogenesis. Carcinogenesis. 2009;30:183-96.-1616. Madara JL, Harte P, Deasy J, Ross D, Lahey S, Glenn S. Evidence for an adenoma-carcinoma sequence in dimethyihydrazine-induced neoplasms of rat intestinal epithelium. Am J Pathol. 1983;110:207-30.
DMH falls in the category of an indirect inducer drug. This drug has the ability to promote DNA hypermethylation of colorectal epithelial cells in the segment. AOM is a derivative of dimethylhydrazine. However, unlike DMH, AOM falls under the category of a direct inducer, without relying on conversion in vivo.1717. Pérez-Holanda S, Rodrigo L, Pinyol-Felis C, Vinyas-Salas J. Colonic perianastomotic carcinogenesis in an experimental model. Bio Med Central Cancer. 2008;8:217.
This study aims to compare the inductive effect of the substances AOM and DMH for colorectal carcinoma in an attempt to identify a more efficient animal model for the induction of CRC in rats.
Method
Animals
30 Wistar rats from the Central Animal Laboratory, Universidade Federal de Alagoas (UFAL), submitted to a light-dark cycle of 12 h, and fed with standard diet and water ad libitum, were used. The study was approved by the Ethics in Research Committee (ERC), Universidade Federal de Alagoas, and all experimental steps were performed in accordance with the principles established by the Colégio Brasileiro de Experimentação Animal (COBEA).
Experimental groups and technique
The animals were randomized into four groups: two groups of ten animals (G1 and G2) and two of five (C1 and C2). G1 was submitted to induction by DMH, and C1 was its control group. G2 received AOM and C2 was its control group.
DMH was administered dissolved in 0.9% NaCl containing 1.5% EDTA as a vehicle, adjusted to a final pH of 6.5 with 1N NaOH solution and applied subcutaneously once a week for five weeks at a dose of 65 mg/kg/week.1818. Laranjeira LLS, Taha MO, Ferme A, Lemos R, Plapler H. Localização de lesões tumorais induzidas pela 1,2-dimetilhidrazina e seu grau de atipia no cólon de ratos. Acta Cirúrg Bras. 1998;13.
AOM was administered dissolved in 0.9% NaCl, resulting in AOM 20 mg/mL and applied subcutaneously for two weeks at a dose of 20mg/kg/wk.33. Amaral EGAV. Expressão de superóxido dismutase em focos de criptas aberrantes induzidas pelo azoximentano em ratos wistar e inibição pelo inositol hexafosfato. São Paulo: Dissertação [Mestrado em Ciência] - Universidade Federal de São Paulo - Escola Paulista de Medicina; 2006.
In C1 and C2, only saline (sodium chloride 0.9%) was applied in a proportional volume and in the same time scheme of G1 and G2, respectively.
After the second inoculation of AOM, we waited two weeks for the action of this substance, and ten weeks for the action of DMH, after its fifth inoculation. The animals were properly identified and submitted to the administration of sodium thiopental 150 mg/kg, intraperitoneally, whose lethal dose caused a quick and painless death by central nervous action with cardiopulmonary arrest.33. Amaral EGAV. Expressão de superóxido dismutase em focos de criptas aberrantes induzidas pelo azoximentano em ratos wistar e inibição pelo inositol hexafosfato. São Paulo: Dissertação [Mestrado em Ciência] - Universidade Federal de São Paulo - Escola Paulista de Medicina; 2006.,1818. Laranjeira LLS, Taha MO, Ferme A, Lemos R, Plapler H. Localização de lesões tumorais induzidas pela 1,2-dimetilhidrazina e seu grau de atipia no cólon de ratos. Acta Cirúrg Bras. 1998;13.
Immediately after euthanasia, the intestine was removed en bloc from the cecum to the anus and opened with scissors in the antimesenteric border. The gut was stretched in Styrofoam plates for cleaning with 0.9% NaCl.
Histopathology
Tissues were fixed in 10% buffered formaldehyde for 24 h and thereafter dehydrated in increasing concentrations of ethanol. After dehydration, the samples were embedded in paraffin, and from these materials tissue sections were obtained and subsequently mounted on glass slides, which were stained with hematoxylin-eosin (HE). The slides were analyzed by an experienced pathologist.
Histopathological changes were classified as mild, moderate and severe dysplasias. Mild dysplasia was characterized as having elongated, crowded and pseudo-stratified nuclei with preserved polarity and a normal or slightly reduced number of goblet cells. Moderate dysplasia was characterized as having hyperchromatic proprieties and deformity of the cell nuclei, increased number of mitoses, thickening of the glandular epithelium and an increased number of immune (defense) cells in the connective tissue. Severe dysplasia was characterized as having broad, round or ovoid nuclei with prominent nucleoli, and atypical mitotic figures. In severe dysplasia, the nuclear polarity was partially lost and the number of goblet cells was significantly reduced or completely disappeared. Colorectal carcinoma is characterized by a complete loss of the morphological characteristics of the tissue of origin and by the presence of signet ring cells.1919. Lu Q, Jiang B, Ling C, Shan T. Dark aberrant crypt foci with activated Wnt pathway are related to tumorigenesis in the colon of AOM-treated rat. J Exp Clin Cancer Res. 2008;27:26.,2020. Cerato MM. Variabilidade interobservador no diagnóstico histológico dos pólipos colorretais. Porto Alegre: Dissertação [Mestrado em Ciências em Gastroenterologia] - Universidade Federal do Rio Grande do Sul; 2006.
Results
Weight gain
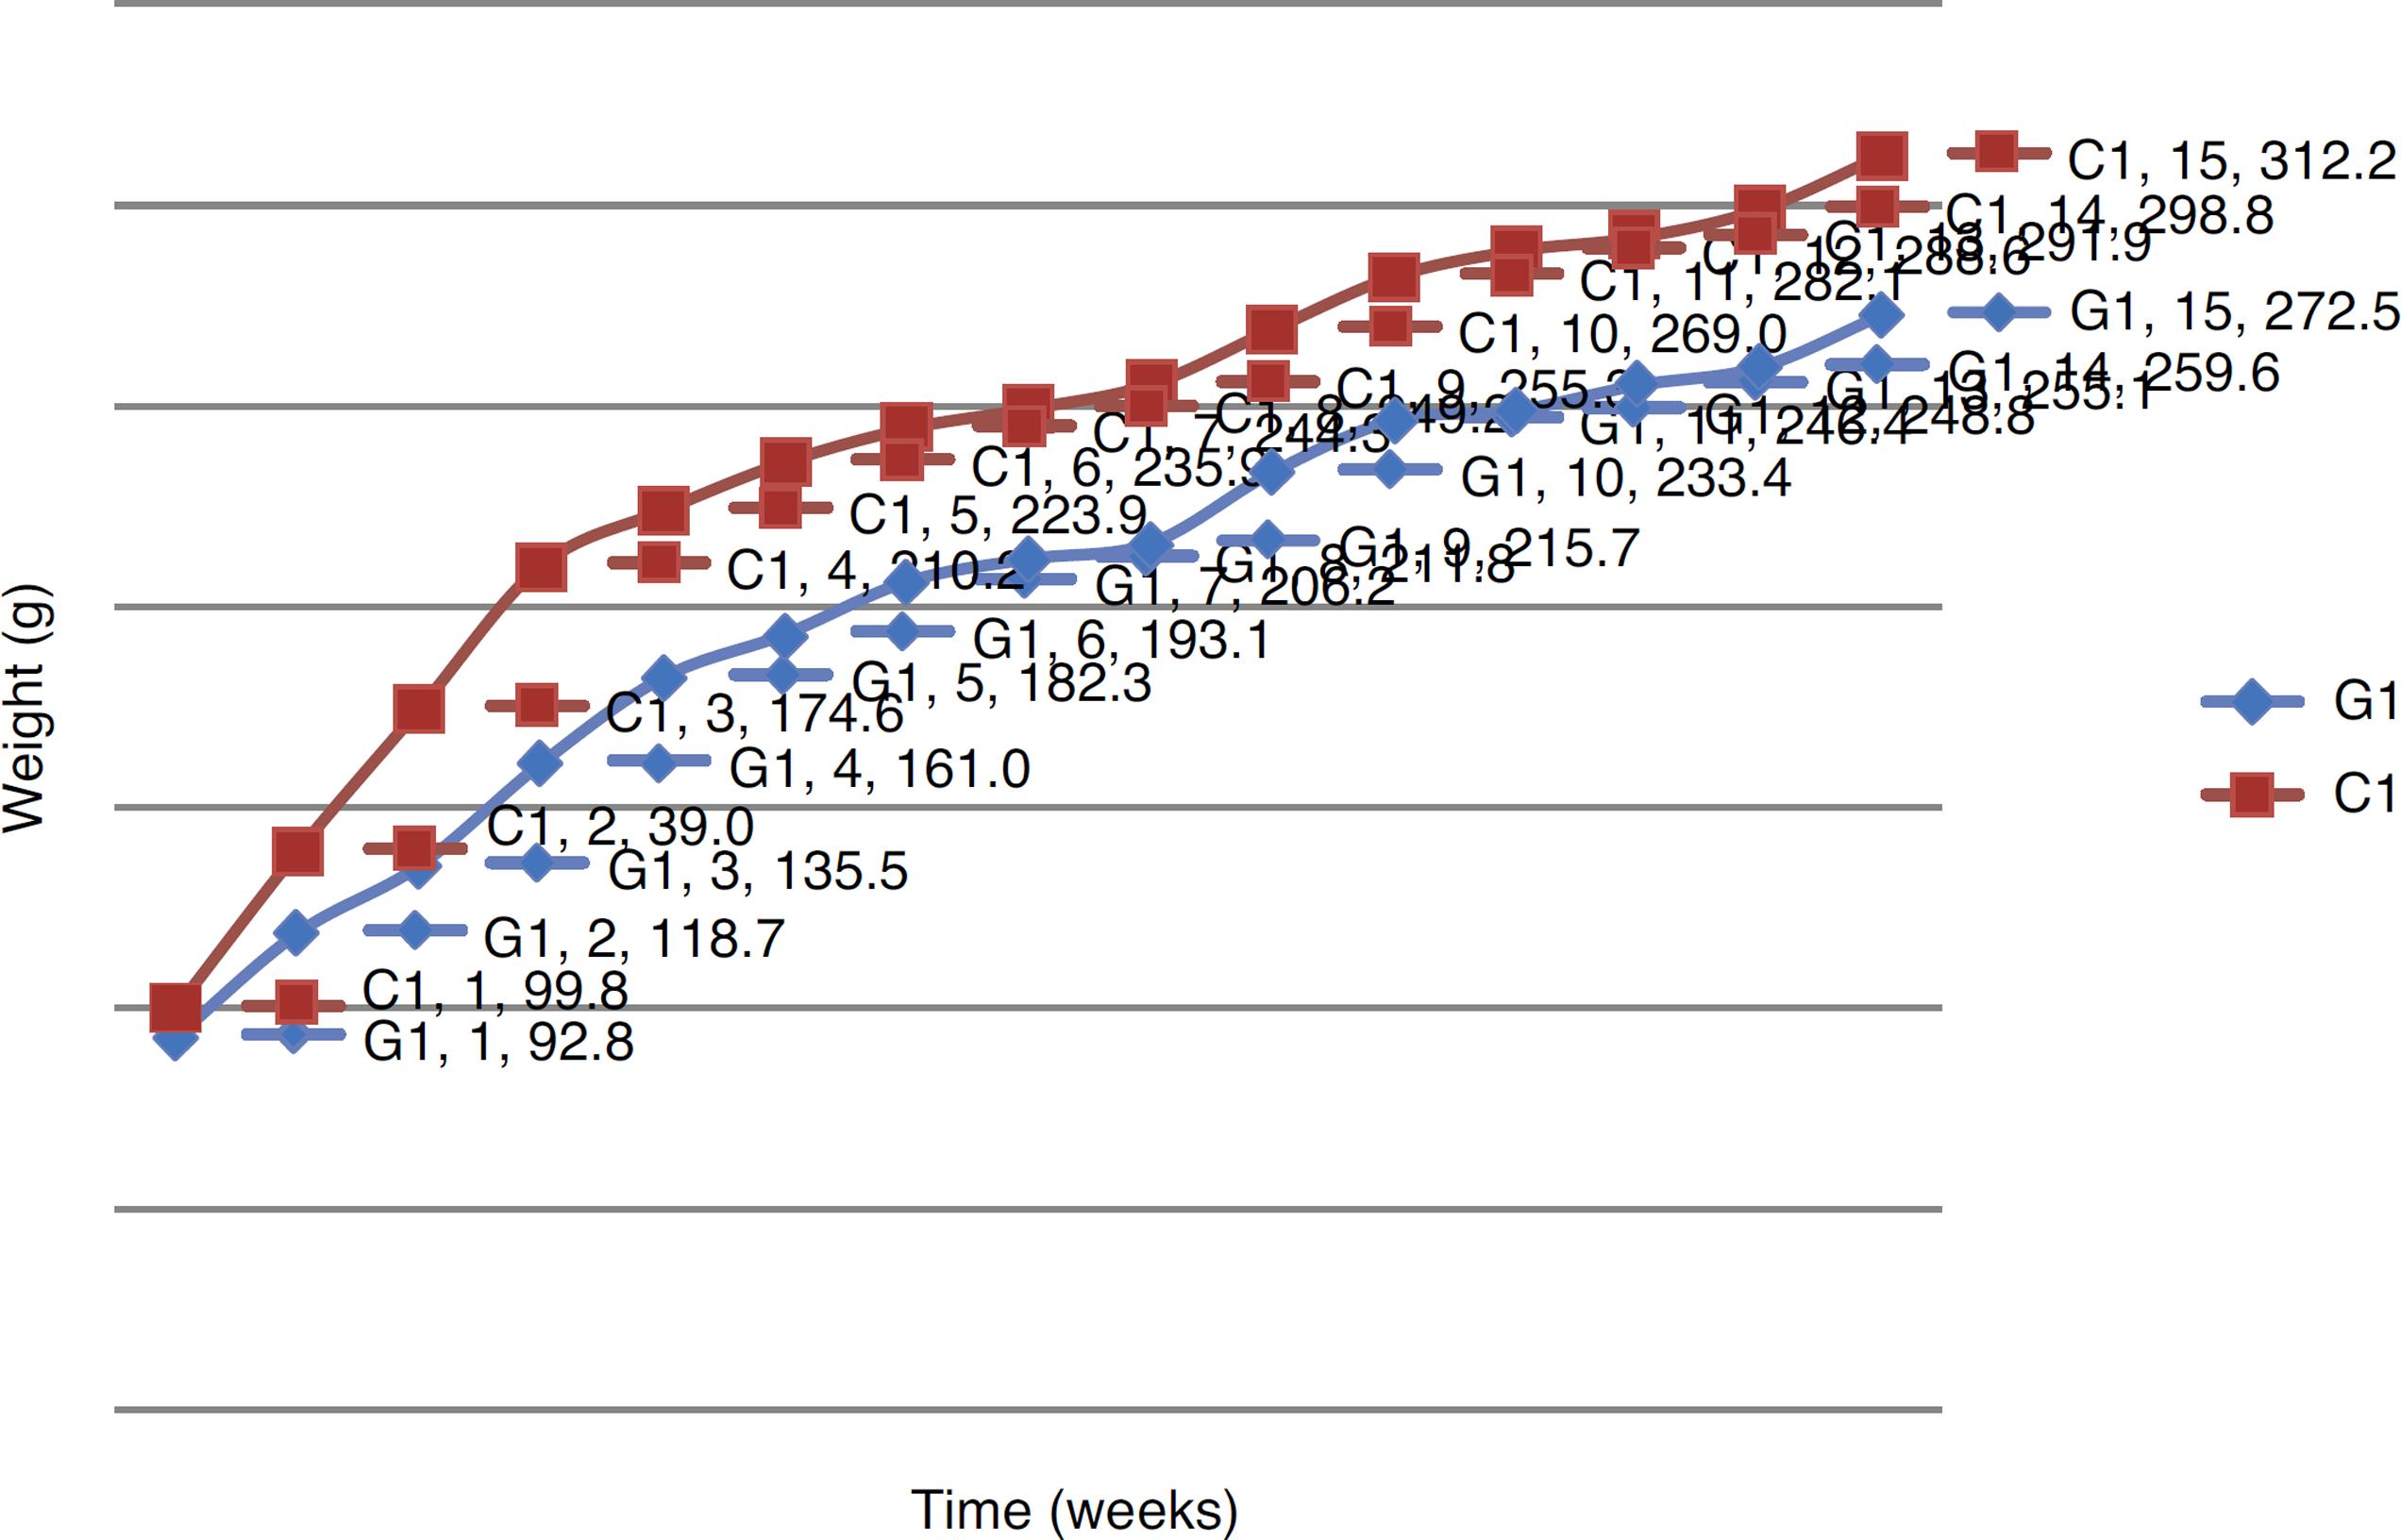
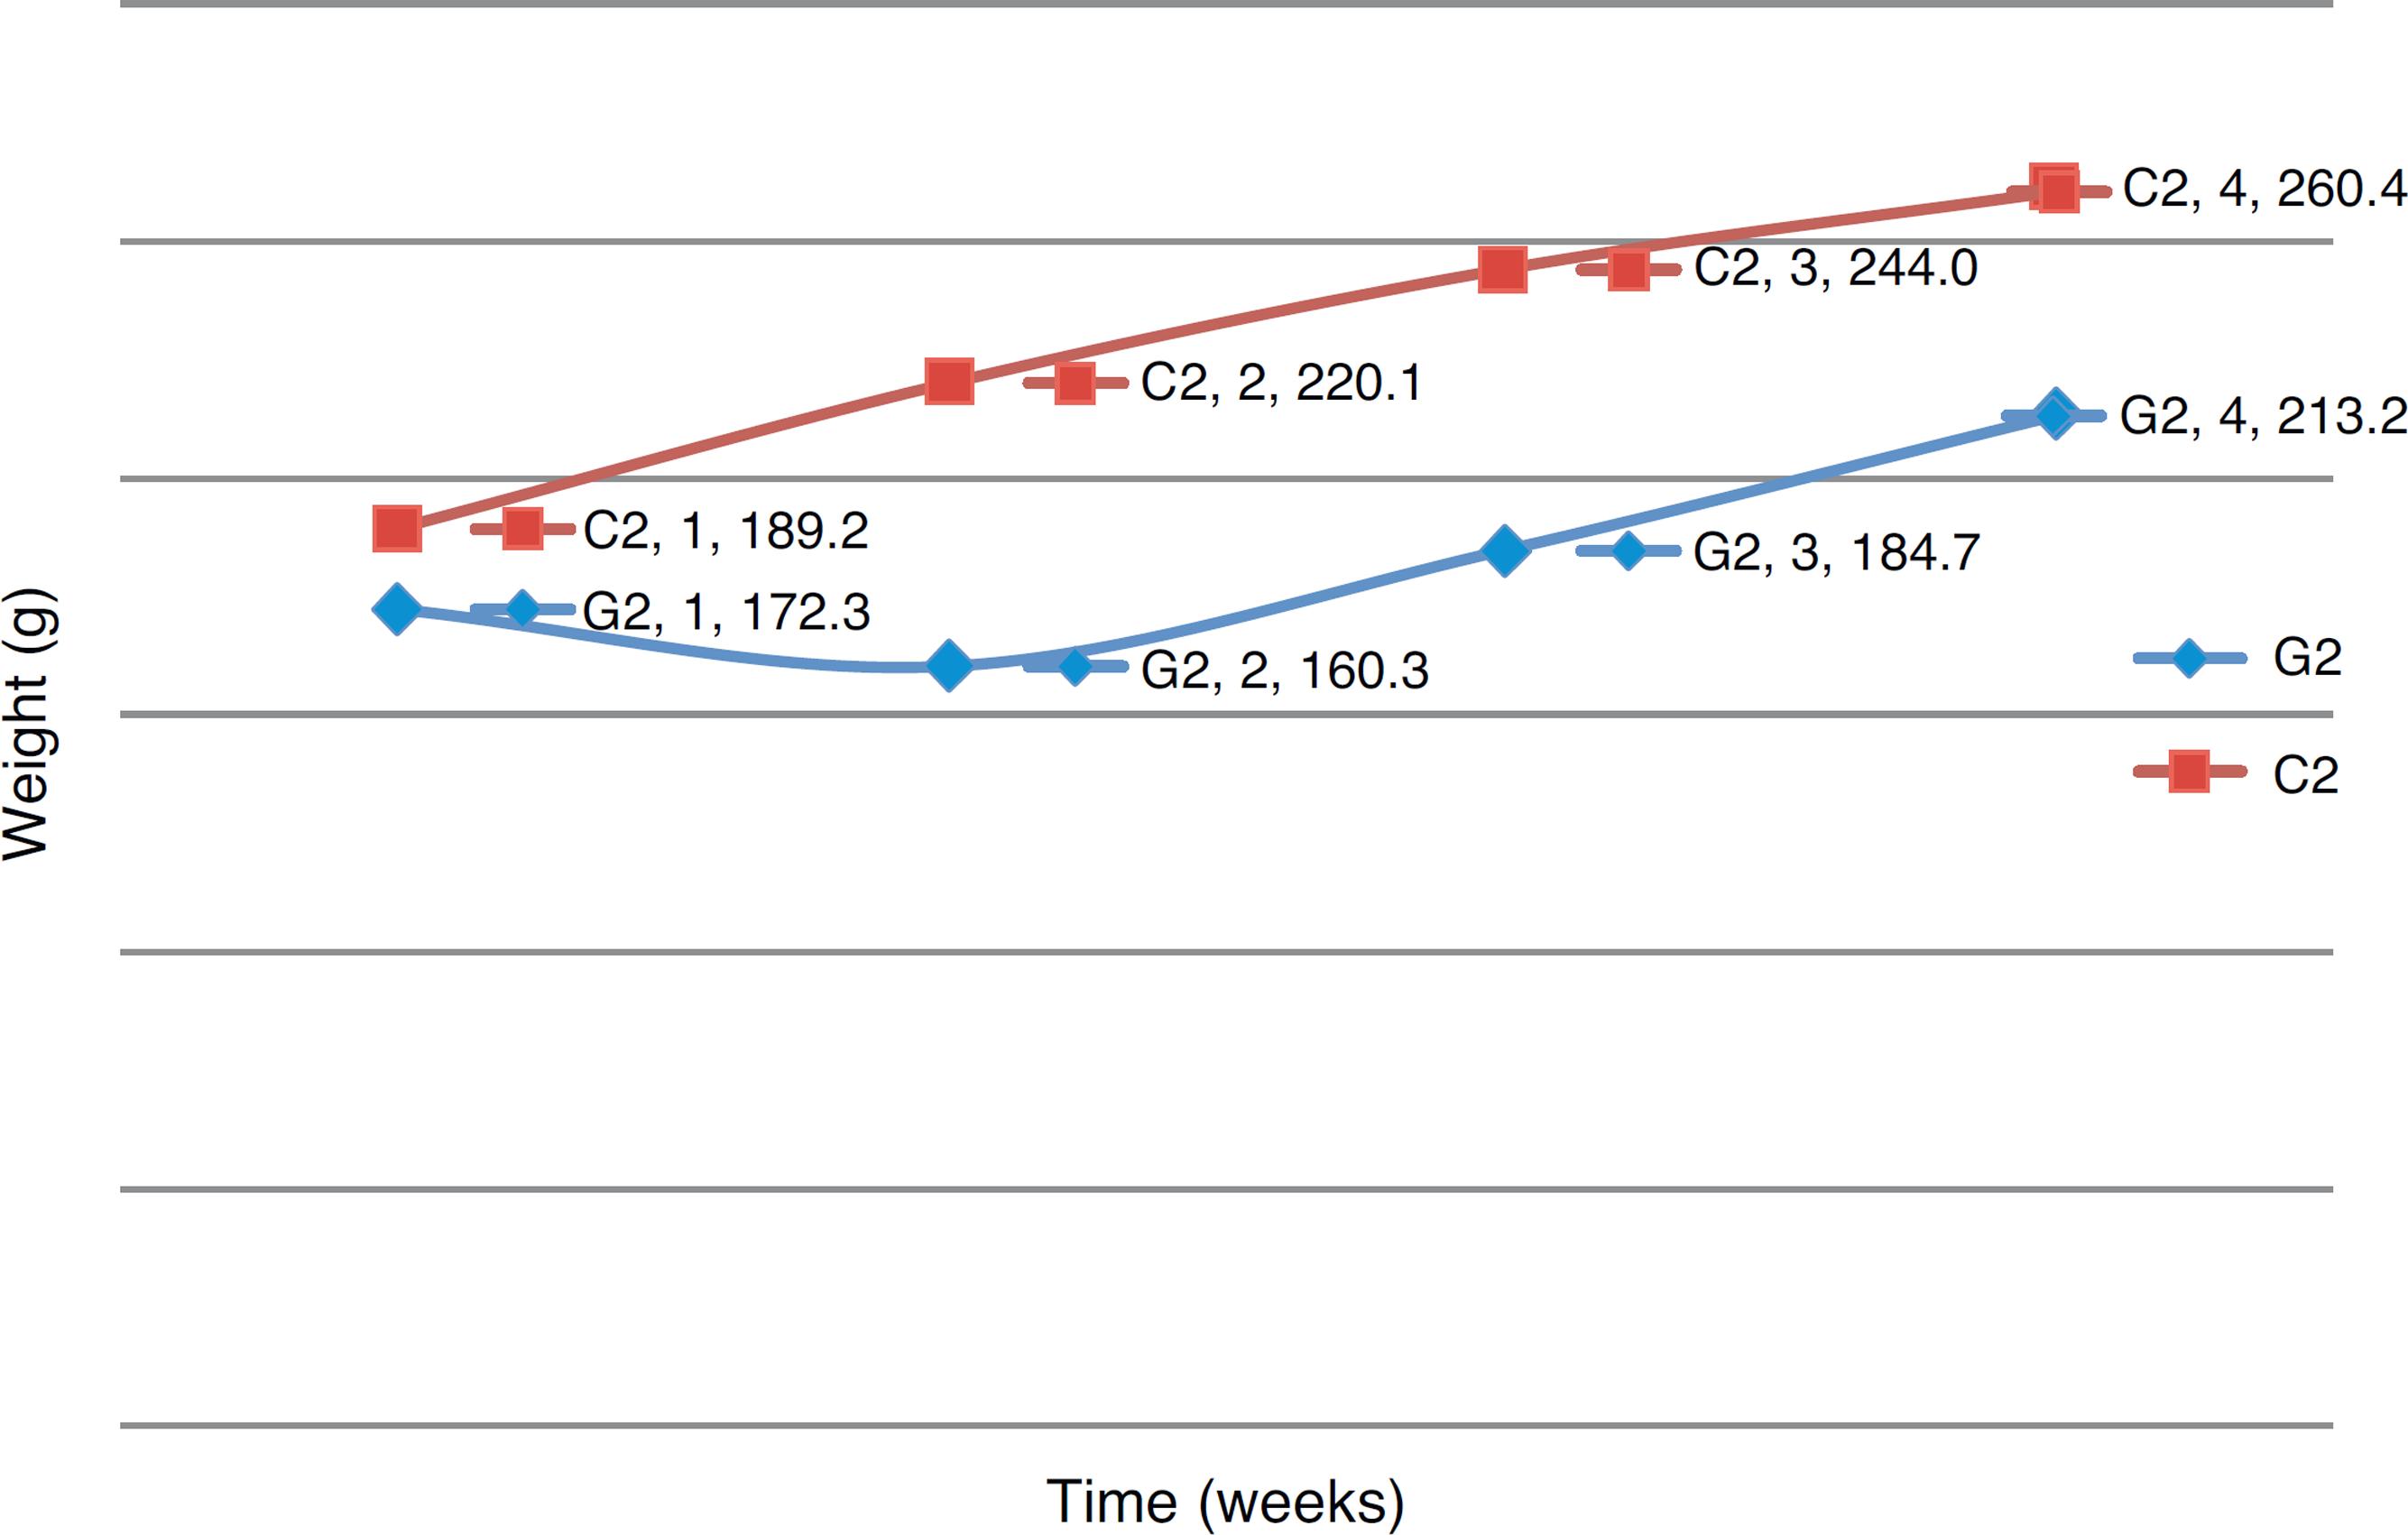
The animals were weighed weekly, from the first inoculation until euthanasia. Table 1 shows the weight of each G1 animal over the 15 weeks of the experiment, and Table 2 shows the weight of each C1 animal in the same period of time. Fig. 1 compares the weight evolution of G1 versus C1 animals in the weeks of evaluation. Table 3 shows the weight of each G2 animal over the four weeks of the experiment, and Table 4 shows the weight of C2 animals in the same period of time. Fig. 2 compares the weight evolution of G2 versus C2 animals in the weeks of evaluation.
Comparative weight evolution, in grams, between G1 and C1 groups in the fifteen weeks of evaluation.
Comparative weight evolution, in grams, between G2 and C2 groups in the four weeks of evaluation.
Histological analysis
No macroscopic lesion in colorectal tissue of any animal was found.
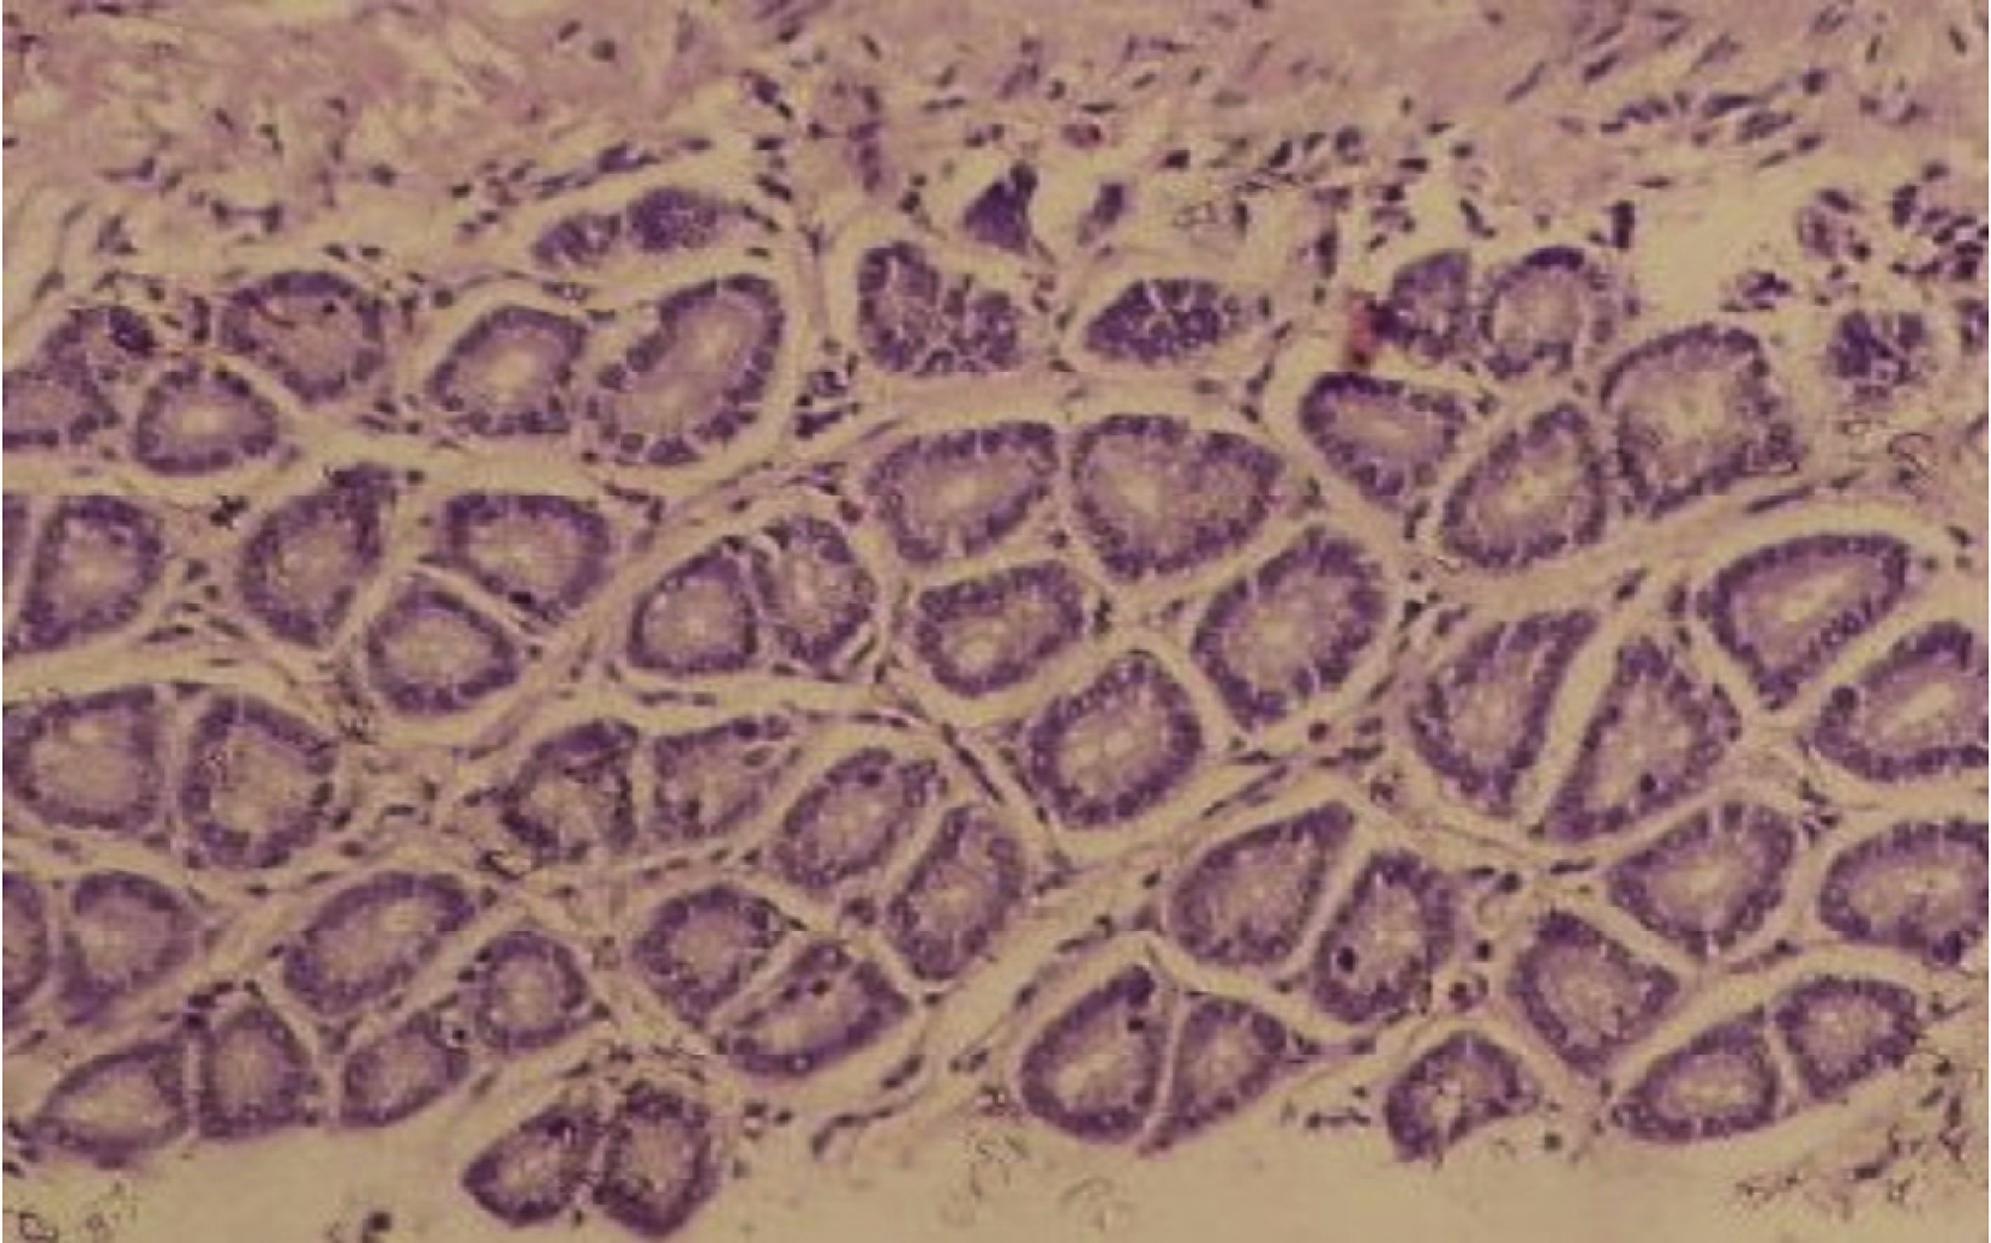
The animals in the control groups showed normal colorectal tissue. In the slides studied, the homogeneous pattern of staining in the nuclei was maintained, as well as its basal location. No mitotic tissue changes were observed, as well as in the size or shape of the glands, which remained uniform (Fig. 3).
Photomicrograph of colonic tissue stained with HE, representing a normal pattern of control groups.
G2 animals showed changes consistent with moderate dysplasia (Fig. 4). In G1 slides, areas of hyperplasia (Fig. 5), mild dysplasia (Fig. 6), severe dysplasia (Fig. 7) and carcinoma (Fig. 8) were observed.
Photomicrograph of colonic tissue stained with HE, showing a pattern of moderate dysplasia (G2 group).
Photomicrograph of colonic tissue stained with HE, showing hyperplasia of glandular epithelium (G1 group).
Photomicrograph of colonic tissue stained with HE, featuring carcinoma - the arrow signals a signet ring cell (G1 group).
Discussion
In the weight evolution in the control groups (C1 and C2), an increasing weight gain occurred.
In G2 group, i.e. those animals that received AOM, there was a weight loss in the first week and, thereafter, weight gain. Probably this was due to the metabolism of this substance, that acts directly in carcinogenesis.1515. Rosemberg DW, Giardina C, Tanaka T. Mouse models for the study of colon carcinogenesis. Carcinogenesis. 2009;30:183-96.
A difference in weight evolution of G1 and C1 was noted, compared to G2 and C2. In the group that received DMH (G1), although there has been no weight loss, weight gain was consistently lower than in the control group. This weight behavior was not analyzed in similar studies; however the research confirm different metabolisms between DMH and AOM, which can generate further research to justify such developments.1515. Rosemberg DW, Giardina C, Tanaka T. Mouse models for the study of colon carcinogenesis. Carcinogenesis. 2009;30:183-96.,2121. Lunz W. Interferência do Treinamento em Natação com Diferentes Intensidades na Carcinogênese Experimental do Cólon. Viçosa: Dissertação [Ciência da Nutrição] - Universidade Federal de Viçosa; 2006.
Regarding the microscopic morphology, in G2 group changes in a homogeneous pattern were observed and characterized as moderate dysplasia. In this group carcinoma was not obtained, perhaps due to the short time between inoculation and euthanasia, since other studies have identified carcinoma when the time elapsed was superior to ours.1515. Rosemberg DW, Giardina C, Tanaka T. Mouse models for the study of colon carcinogenesis. Carcinogenesis. 2009;30:183-96.,1919. Lu Q, Jiang B, Ling C, Shan T. Dark aberrant crypt foci with activated Wnt pathway are related to tumorigenesis in the colon of AOM-treated rat. J Exp Clin Cancer Res. 2008;27:26.,2222. Reddy BS, Hirose Y, Lubet R, Steele V, Kelloff G, Paulson S, et al. Chemoprevention of colon cancer by specific cyclooxygenase-2 inhibitor, Celecoxib, administered during different stages of carcinogenesis. Cancer Res. 2000;60:293-7.,2323. Paulsen JE, Løberg EM, Ølstørn HB, Knutsen H, Steffensen IL, Alexander J. Flat dysplastic aberrant crypt foci are related to tumorigenesis in the colon of azoxymethane-treated rat. Cancer Res. 2005;65:121-9.
The analysis of G1 slides showed histological changes in different stages, which confirmed the high carcinogenic capacity of DMH.77. Bird RP, Good CK. The significance of aberrant crypt foci in understanding the pathogenesis of colon cancer. Toxicol Lett. 2000;112:395-402.,1313. Perse M, Cerar A. Dimethylhydrazine model is not appropriate for evaluating effect of ethanol on colorectal cancer. Rev Esp Enferm Dig. 2007;99:463-6.,1515. Rosemberg DW, Giardina C, Tanaka T. Mouse models for the study of colon carcinogenesis. Carcinogenesis. 2009;30:183-96.,1818. Laranjeira LLS, Taha MO, Ferme A, Lemos R, Plapler H. Localização de lesões tumorais induzidas pela 1,2-dimetilhidrazina e seu grau de atipia no cólon de ratos. Acta Cirúrg Bras. 1998;13.,2121. Lunz W. Interferência do Treinamento em Natação com Diferentes Intensidades na Carcinogênese Experimental do Cólon. Viçosa: Dissertação [Ciência da Nutrição] - Universidade Federal de Viçosa; 2006.,2424. Reddy BS. Colon carcinogenesis models for chemoprevention studies. Cancer Chemoprevent. 1998;12:963-73.
It is known that the final amount of carcinogen found in the tissues is a function of activity of the metabolic pathways leading to its formation, of the activity of detoxification pathways, as well as the half-lives of all biological species involved.2525. Felis CP. Estudio de los cambios en la mucosa colónica de rata y cinética celular durante la carcinogénesis experimental inducida con 1,2-dimetilhidracina. Salamanca: Tese [Doutorado em Ciências] - Universitat de Lleida; 1995. Considering that in the methodology of DMH carcinogenesis 15 weeks should elapse for the final analysis, there was more time for the evolution of lesions, which confirms the importance of genetic and environmental factors in carcinogenesis.1212. Hisamuddin IM, Yang VW. Molecular genetics of colorectalcancer: an overview. Colorectal Cancer Rep. 2006;2:53-9.
The mechanism of carcinogenesis induction by inoculation of AOM and DMH is so well established in the literature that some authors are using substances to inhibit the carcinogenic process.55. Aguilar JFN, Antich IA, Martínez AP, et al. Cyclooxygenase-2 inhibition in colon experimental carcinogenesis. Rev Esp Enferm Dig. 2005;97:637-47.,2222. Reddy BS, Hirose Y, Lubet R, Steele V, Kelloff G, Paulson S, et al. Chemoprevention of colon cancer by specific cyclooxygenase-2 inhibitor, Celecoxib, administered during different stages of carcinogenesis. Cancer Res. 2000;60:293-7.,2424. Reddy BS. Colon carcinogenesis models for chemoprevention studies. Cancer Chemoprevent. 1998;12:963-73.,2626. Velmurugan B, Singh RP, Tyagi A, Agarwal R. Inhibition of azoxymethane induced colonic aberrant crypt foci formation by Silibinin in male fisher 344 rats. Cancer Prevent Res. 2008;1:376-84.,2727. Aguilar JFN, Martínez AP, Antich IA, Camis JMM, Collado CT, Tugores JJP. Influence of rofecoxib on experimental colonic carcinogenesis in rats. Rev Esp Enferm Dig. 2004;96:678-86. However, the cost of substances - a limiting factor of the feasibility of an experiment - is not being analyzed nor valued.
When in this study we compared the cost of AOM versus DMH, the latter was more than 50 times less expensive than AOM. Even requiring more carcinogenesis time with DMH and, consequently, an higher maintenance cost of animals, the use of AOM did not pay off.
The methodology used confirmed that the five weeks' time of inoculation followed by ten weeks of observation is sufficient for completion of experimental carcinogenesis by DMH.
Conclusion
DMH caused changes of weight different from those of G2 animals. Their carcinogenic action was evidenced by pathological changes, as dysplasias of various degrees were found, in addition to regions of neoplasia. AOM is able to promote histological changes consistent with the orderly events' sequence that leads to the development of colorectal cancer, being considered a good colorectal carcinogen.
Time is a preponderant factor for evidencing the histological changes. Neoplasia and severe dysplasia were produced by DMH which, compared to AOM, was more efficient in inducing colorectal cancer.
REFERENCES
-
1Ministério da Saúde; Instituto Nacional do Câncer José Alencar Gomes da Silva, Rio de Janeiro Incidência de câncer no Brasil - Estimativas 2012; 2011.
-
2Barone M, Lofano K, De Tullio N, Licino R, Albano F, Di Leo A. Dietary, endocrine, and metabolic factors in the development of colorectal cancer. J Gastrointest Cancer. 2012;43:13-9.
-
3Amaral EGAV. Expressão de superóxido dismutase em focos de criptas aberrantes induzidas pelo azoximentano em ratos wistar e inibição pelo inositol hexafosfato. São Paulo: Dissertação [Mestrado em Ciência] - Universidade Federal de São Paulo - Escola Paulista de Medicina; 2006.
-
4Pinho MSL. Biologia molecular do câncer colorretal: Uma revolução silenciosa em andamento. Rev Bras Coloproct. 2008;28:353-68.
-
5Aguilar JFN, Antich IA, Martínez AP, et al. Cyclooxygenase-2 inhibition in colon experimental carcinogenesis. Rev Esp Enferm Dig. 2005;97:637-47.
-
6Plate AYA, Gallaher DD. Effects of indole-3-carbinol and phenethyl isothiocyanate on colon carcinogenesis induced by azoxymethane in rats. Carcinogenesis. 2006;27:287-92.
-
7Bird RP, Good CK. The significance of aberrant crypt foci in understanding the pathogenesis of colon cancer. Toxicol Lett. 2000;112:395-402.
-
8Jucá MJ, Nunes BLBBP, Menezes HL, Gomes EGA, Matos D. Metaloproteinases 1 e 7 e câncer colorretal. Rev Bras Coloproct. 2008;28:353-62.
-
9Rocha FTR, Lourenço LG, Jucá MJ, Costa V, Leal AT. Quimioprevenção pelo celecoxibe no adenocarcinoma gástrico induzido por refluxo em ratos Wistar submetidos à gastrojejunostomia. Acta Cirúrg Bras. 2009;24:189-94.
-
10Gomes EGA, Jucá MJ, Menezes HL, Nunes BLBBP, Costa H, Lima FO, et al. Correlação entre as expressões imunohistoquímicas da MMP-1, MMP-7 e do VEGF no adenocarcinoma colorretal com fatores prognósticos. Acta Cirúrg Bras. 2009;24:303-10.
-
11Menezes HL, Jucá MJ, Gomes EGA, Nunes BLBBP, Costa HO, Matos D. Analysis of the immunohistochemical expressions of p53, bcl-2 and Ki-67 in colorectal adenocarcinoma and their correlations with the prognostic factors. Arq Gastroenterol. 2010;47:141-7.
-
12Hisamuddin IM, Yang VW. Molecular genetics of colorectalcancer: an overview. Colorectal Cancer Rep. 2006;2:53-9.
-
13Perse M, Cerar A. Dimethylhydrazine model is not appropriate for evaluating effect of ethanol on colorectal cancer. Rev Esp Enferm Dig. 2007;99:463-6.
-
14Corpet DE, Pierre F. How good are rodent models of carcinogenesis in predicting efficacy in humans? A systematic review and meta-analysis of colon chemoprevention in rats, mice and men. Eur J Cancer. 2005;41:1911-22.
-
15Rosemberg DW, Giardina C, Tanaka T. Mouse models for the study of colon carcinogenesis. Carcinogenesis. 2009;30:183-96.
-
16Madara JL, Harte P, Deasy J, Ross D, Lahey S, Glenn S. Evidence for an adenoma-carcinoma sequence in dimethyihydrazine-induced neoplasms of rat intestinal epithelium. Am J Pathol. 1983;110:207-30.
-
17Pérez-Holanda S, Rodrigo L, Pinyol-Felis C, Vinyas-Salas J. Colonic perianastomotic carcinogenesis in an experimental model. Bio Med Central Cancer. 2008;8:217.
-
18Laranjeira LLS, Taha MO, Ferme A, Lemos R, Plapler H. Localização de lesões tumorais induzidas pela 1,2-dimetilhidrazina e seu grau de atipia no cólon de ratos. Acta Cirúrg Bras. 1998;13.
-
19Lu Q, Jiang B, Ling C, Shan T. Dark aberrant crypt foci with activated Wnt pathway are related to tumorigenesis in the colon of AOM-treated rat. J Exp Clin Cancer Res. 2008;27:26.
-
20Cerato MM. Variabilidade interobservador no diagnóstico histológico dos pólipos colorretais. Porto Alegre: Dissertação [Mestrado em Ciências em Gastroenterologia] - Universidade Federal do Rio Grande do Sul; 2006.
-
21Lunz W. Interferência do Treinamento em Natação com Diferentes Intensidades na Carcinogênese Experimental do Cólon. Viçosa: Dissertação [Ciência da Nutrição] - Universidade Federal de Viçosa; 2006.
-
22Reddy BS, Hirose Y, Lubet R, Steele V, Kelloff G, Paulson S, et al. Chemoprevention of colon cancer by specific cyclooxygenase-2 inhibitor, Celecoxib, administered during different stages of carcinogenesis. Cancer Res. 2000;60:293-7.
-
23Paulsen JE, Løberg EM, Ølstørn HB, Knutsen H, Steffensen IL, Alexander J. Flat dysplastic aberrant crypt foci are related to tumorigenesis in the colon of azoxymethane-treated rat. Cancer Res. 2005;65:121-9.
-
24Reddy BS. Colon carcinogenesis models for chemoprevention studies. Cancer Chemoprevent. 1998;12:963-73.
-
25Felis CP. Estudio de los cambios en la mucosa colónica de rata y cinética celular durante la carcinogénesis experimental inducida con 1,2-dimetilhidracina. Salamanca: Tese [Doutorado em Ciências] - Universitat de Lleida; 1995.
-
26Velmurugan B, Singh RP, Tyagi A, Agarwal R. Inhibition of azoxymethane induced colonic aberrant crypt foci formation by Silibinin in male fisher 344 rats. Cancer Prevent Res. 2008;1:376-84.
-
27Aguilar JFN, Martínez AP, Antich IA, Camis JMM, Collado CT, Tugores JJP. Influence of rofecoxib on experimental colonic carcinogenesis in rats. Rev Esp Enferm Dig. 2004;96:678-86.
Publication Dates
-
Publication in this collection
Jul-Sep 2014
History
-
Received
12 Feb 2014 -
Accepted
13 Mar 2014