
Abstract
Personal Rapid Transit (PRT) is an efficient rapid transit system which provides the last mile connectivity to the users with a high level of reliability and comfort. This paper is focused on the estimation of travel demand for a PRT system in an area using stated preference technique and binary logit models. Dwarka is a township in south-western region of New Delhi, India, and it has been selected as the case study area for this study. Primary data has been collected during household and establishment surveys in the area. The surveys were conducted using stated preference technique and coupled with willingness to pay survey. Further, binary logit models have been developed to estimate a 36 percent (222,456 trips per day) shift to PRT from the existing modes in the area. Travel demand estimation is one of the critical aspects of planning a PRT system in an area. Using stated preference technique and binary logit models, the travel demand can be estimated very precisely for any area-wide or a larger city-wide PRT system.
Keywords:
PRT; personal rapid transit; travel demand; binary logit model; Dwarka
Introduction
Travel demand estimation of a PRT system is essential for efficient planning and utilization of the mode. Stated preference technique and logit models have been used widely by researchers for estimation of travel demand of public transport systems and feeder systems (Maitra et al., 2013Maitra, B., Ghosh, S., Das, S. S., & Boltze, M. (2013). Effect of model specification on valuation of travel attributes: a case study of rural feeder service to bus stop. Journal of Transport Literature, 7(2), 8-28.). Travel demand estimation requires each individual’s trip making characteristics in a household or establishment. PRT is an emerging mode of urban transportation. Operational and financial feasibility of PRT is still a major concern for urban transport planners due to the very limited number of fully functional modern PRT systems in the world. Travel demand is one of the most significant part of operational and financial feasibility of any new mode being introduced in an area. Thus, there is a need to prepare a precise methodology for travel demand estimation which can reduce the uncertainty associated with PRT and lead to efficient and precise operational and financial planning. In this study, stated preference technique has been used in the surveys and willingness to pay survey has also been coupled with it. Utility functions for each mode have been developed and used for development on binary logit models. These models have been used to estimate the shift in patronage from each of the modes to PRT and thus estimate the travel demand in the study area.
PRT is a state-of-the-art form of public transport that uses small automated electric ‘podcars’ to provide a taxi-like demand responsive services for individuals or small groups of travelers (European Commission, 2004European Commission. (2004). Fifth Framework Programme Key Action - City of Tomorrow and Cultural Heritage. EDICT Final Report.and Anderson, 1978Anderson, J. E. (1978). What is Personal Rapid Transit. University of Washington.). The podcars are usually two, four or six passenger vehicles that run on a segregated guide way. PRT is gaining popularity around the world for its uninterrupted (Anderson, 2009Anderson, J. E. (2009). An Intelligent Transportation Network System: Rationale, Attributes, Status, Economics, Benefits, and Courses of Study for Engineers and Planners. PRT International, LLC.), efficient and sustainable journey between origin and destination (Gilbert and Anthony, 2006Gilbert, R. and Anthony, P. (2006). Grid-connected vehicles as the core of future land based transport systems. Energy Policy, 35(5), 3053–3060.). It is a lightweight system and it incurs lesser capital cost as compared to other Public Transport systems (Gilbert and Anthony, 2006Gilbert, R. and Anthony, P. (2006). Grid-connected vehicles as the core of future land based transport systems. Energy Policy, 35(5), 3053–3060.). There have been several studies on integration of feeder modes like bicycle to the transit systems (Castro et al., 2013Castro, C. M. S. e., Barbosa, H. M. and Oliveira, L. K. de. (2013). Analysis of the potential integration of cycling with public transport in Belo Horizonte. Journal of Transport Literature, 7(2), 146-170.). PRT can be integrated with the transit directly at the platform level which is not possible with any other mode. PRT can also work as a standalone network to serve the demand in a particular area (Vibhuti, 2009Vibhuti, A. (2009). Personal Rapid Transit: A Suitable Mass Transit Alternative for India. Institute of Urban Transport, New Delhi, India.).
This paper first briefly discusses the existing PRT systems around the world, followed by the case study area and primary data collection in section 2 and section 3 respectively. Further, estimation of base year trips from the collected sample data and travel demand has been carried out. The mode share before and after introduction of PRT has also been presented. Then, considering a maximum acceptable walking distance of 250 meters, a PRT network has been proposed in the study area followed by conclusions and discussion.
1. Experiences of PRT around the World
The concept of PRT was introduced in 1953 by Don Fichter who conducted a research on alternative transportation methods (Anderson, 1996Anderson, J. E. (1996). Some Lessons from the History of Personal Rapid Transit. Conference on PRT and Other Emerging Transit Systems, Minneapolis.). An operational PRT system was first introduced in 1975 in West Virginia University in Morgantown, USA. PRT got real momentum only after 2011 when PRT operations began at Heathrow Airport Terminal 5. Since then the world has realized the potentials of PRT system and it is now being considered for public transport planning studies in various cities around the world. Morgantown PRT was the first PRT system implemented in the world in 1975 (Anderson, 1996Anderson, J. E. (1996). Some Lessons from the History of Personal Rapid Transit. Conference on PRT and Other Emerging Transit Systems, Minneapolis.). It connects three campuses of West Virginia University in Morgantown, USA. It is also known as Automated Group Rapid Transit system. There is some disagreement whether Morgantown system is a true PRT system or not. This is because it has a capacity to hold 21 person (8 seated & rest standing), which is large in comparison to most PRT concepts. It is also known as Morgantown People mover (MPM). The total length of this system is 13.2 km.
As of 2014, only two modern PRT systems are operational worldwide. Since 2010 a 13-vehicle 2getthere system at Masdar City, UAE, and since 2011 a 21-vehicle Ultra PRT system at London Heathrow Airport has been operational (Ultra Fairwood Green Transport, 2013Ultra Fairwood Green Transport. (2009). DPR of PRT Amritsar Project. Detailed project Report, India.). The route length of the first phase of Masdar PRT and Heathrow PRT is 1.5 km and 3.8 km long respectively.
In April 2013 a 5.3 km long 40-vehicle Vectus system was expected to open in Suncheon, South Korea but has now been delayed. However, Suncheon bay PRT had started its first test trails in April 2013 (Sarkar et al., 2012Sarkar, P. K., Maitri, V., Ram S. and Meenaz I. (2012). Personalized Rapid Transit Systems – An Approach towards Solving Urban Transport Problems, A Case Study in Gurgaon City, Haryana. School of Planning & Architecture, New Delhi, India.). Additional systems have been announced at London Heathrow Airport and Amritsar, India (Ultra Fairwood Green Transport, 2013Ultra Fairwood Green Transport. (2009). DPR of PRT Amritsar Project. Detailed project Report, India.). Numerous other PRT systems have been proposed but not implemented, including many substantially larger than those now operating (Muller, 2009Muller, P. J. (2009). The Impact of PRT on Army Base Sustainability. Automated People Movers 2009, pp. 309-320.).
2. Case Study – Dwarka, New Delhi
Dwarka Sub City is situated in South West Delhi part of National Capital Territory of Delhi and is the zone K-II in the zoning system given by the Delhi Development Authority. Dwarka has a location advantage as it is very close to Gurgaon which is one of the largest business hubs in the National Capital Region. Dwarka is also adjacent to Indira Gandhi International Airport, New Delhi. Dwarka was divided into 29 sectors when it was planned by the Delhi Development Authority (DDA). It has a total population of 11 Lakhs (1.1 million) in these 29 sectors. The total area of the sub city is 5924 hectares and the existing built up area is 1933 hectares. Dwarka is one of the largest planned residential areas in Asia. It is also known as the “Model Township” and is considered to be one of the most organized and cleanest areas of Delhi. As compared to other colonies and townships in Delhi.
Dwarka is well connected to various other areas of Delhi by the city bus routes, Delhi Metro Blue Line and Delhi Metro Airport Express Line. The majority of residents of Dwarka belong to the Middle Income group (MIG) and High Income Group (HIG) category. There are well established authorized commercial areas which attract recreational and shopping trips. There are large universities campuses like Guru Gobind Singh Indraprastha University and Netaji Subhash Institute of Technology which attract education and work trips every day. PRT has been planned in the case study area to cater to the “Intra Dwarka Trips” which are the trips contained within Dwarka sub city. Intra Dwarka Trips consist of access dispersal trips to the bus stops and metro stations, shopping trips, recreational trips and educational trips within Dwarka.
3. Data Collection
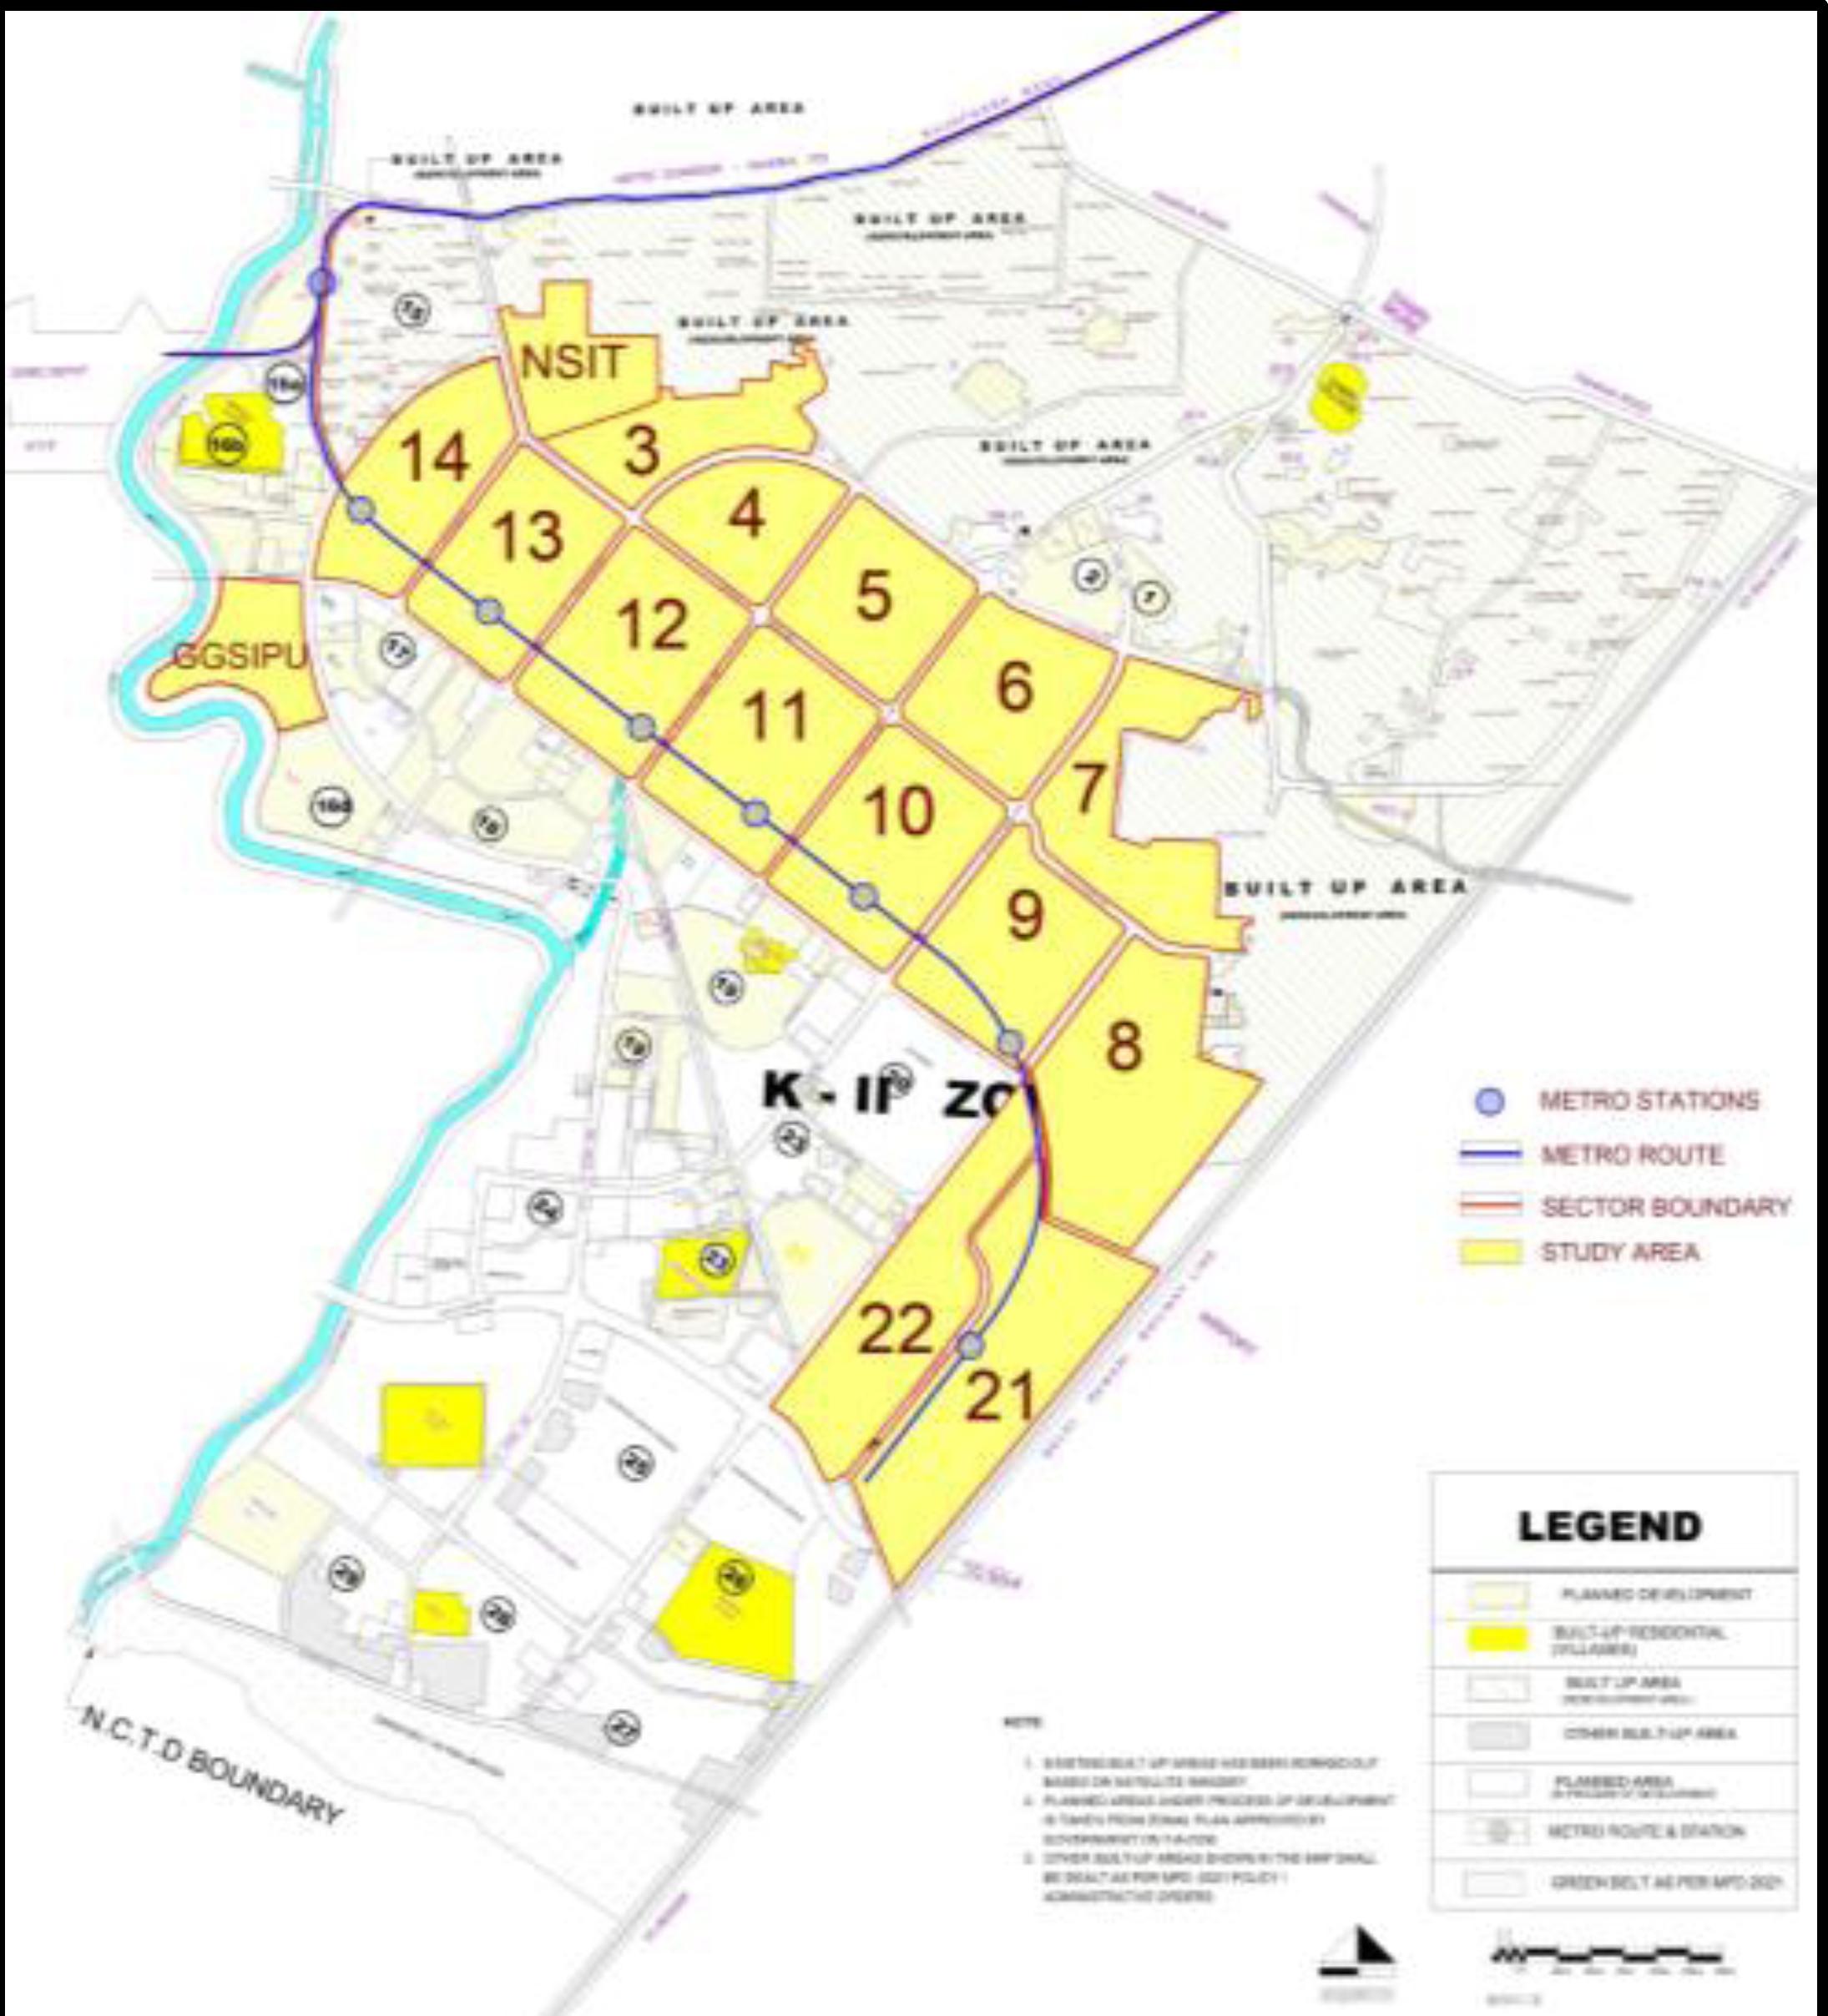
Primary and secondary data has been collected for the travel demand assessment of Intra Dwarka trips and development of a PRT system in Dwarka. The secondary data has been collected from various sources like Delhi Development Authority (DDA), and Fairwood Group Pvt. Ltd. Primary data has been collected through different surveys conducted in Sector - 3, 4, 5, 6, 7, 8, 9, 10, 11, 12, 13, 14, 16, 21, and 22 (Total 15 sectors) of Dwarka. The study area sectors selected in Dwarka have been presented in Figure 1.
Household socio economic and trip information has been collected from the residential areas and commercial/institutional areas in the household and establishment surveys respectively. Willingness to shift (WTS) and willingness to pay (WTP) surveys have been conducted during both household and establishment surveys using stated preference technique. These surveys are user opinion surveys where the users are first informed about Personal rapid System, its utilities and benefits. Then the users are asked if they will be willing to shift to PRT if it is introduces in their area. If the answer is yes then they are asked at what fare they will be willing to shift to the PRT system.
4. Travel Demand Estimation
The first step towards travel demand estimation was estimation of base year trips using the sample data and the sample size. Also, it was ensured that the sample data is representative of the population before expanding it to get the base year trips in the study area. Further, utility functions were developed using the WTS and WTP data which led to building of binary logit models.
4.1. Base Year Trips
The base year trips have been calculated as the sum of expanded household trips and establishment trips. The sample size for household trips and establishment trips is 0.115% and 0.53% respectively. The average trip length (ATL) and per capita trip rate (PCTR) of the sample data have been compared with that published in the RITES Report in 2010 (RITES, 2010RITES. (2010). Transport Demand Forecast Study and Development of an Integrated Road cum Multi-Modal Public Transport Network for Modal Public Transport Network for NCT of Delhi. Government of National Capital Territory of Delhi, Transport Department, India.) to check if the sample collected is representative of the population. Hypothesis was setup and Z-test was conducted to check if the mean ATL and mean PCTR values of sample data and RITES report data are statistically same. The p-values obtained for ATL and PCTR tests were 0.001 and 0.020 (both less than 0.05) at 95 percent confidence level. This implies that the ATL and PCTR values of sample data and RITES report are statistically same and thus, the sample data is representative of the population.
The Household trips include all the trips which were recorded during the household surveys and the establishment trips include all the trips recorded during the establishment surveys. Establishment trips had some overlapping trips which were recorded previously in the household survey as well. This duplicity in trips was eliminated and then the sum of household and establishment trips was taken as the total trips recorded in the study area. The sample size was further used to expand the sample number of trips to the base year trips. The Base Year Intra Dwarka Trips in the study area are 607,496 Trips per Day. The mode-wise trips recorded during the surveys and expanded base year trips have been presented in Table 1.
Expandede Base Year Trips (Inter Dwarka Trips). Source: Primary survey data with own calculations.
4.2. Travel Demand Assessment
The base year trips and the primary data collected from the WTS and WTP surveys have been used to develop utility functions and build binary logit models for each of the existing modes. Binary logit model has been used to calculate the percentage shift to PRT from each of the existing mode in Dwarka. The percentage shift to PRT is the estimated travel demand on the PRT system. Minitab software has been used for development of Binary Logit models of each mode. Variables like travel time and travel cost of each mode have been taken as input along with a willingness to shift to PRT in the form of yes/no. The utility functions, percentage shift to PRT from each mode and estimated travel demand have been shown in the Table 2.
Here, X1 and X2 are variables Travel Cost and Travel Time respectively. In case of Walk Trips the variable X1 is Travel Distance and X2 is Travel Time. 69.5 percent of cycle rickshaw trips have been estimated to shift to PRT. One of the most common reason for shift to PRT reported by cycle rickshaw users was the uncertainty in availability and travel cost of cycle rickshaws. In terms of absolute number of trips estimated to shift to PRT, the highest number is observed to be of car trips (97,340) followed by cycle rickshaw trips (75,387). None of the bicycle users reported willingness to shift to PRT, and thus a utility function was not developed for bicycles. Out of the total 607,496 trips per day, there was 36.6% overall shift expected to PRT at the base fare of INR 10 per km. The travel demand for PRT in Dwarka has been estimated to be 222,465 trips per day.
According to the estimated shift from each of the existing modes, there will be a change in the modal split of Intra Dwarka Trips when PRT is introduced. There will be reduction in trips of each of the existing modes. The existing modal split and the new expected modal split of Intra Dwarka trips has been shown below in Figure 2.
After the introduction of PRT in Dwarka, the most significant reduction of 16% and 12% is expected in car trips and cycle rickshaw trips respectively. The reduction in car trips will reduce the carbon emissions and the congestion on roads. Congestion would be further eased due to reduction of other modes like cycle rickshaws on the road. The reduction in cycle rickshaw trips could be a concern in terms of reducing the daily earnings and livelihood of rickshaw pullers. But, the reduction in congestion on roads will help the cycle rickshaw pullers in reducing their time taken to complete one trip and they can increase the frequency of their trips thereby compensating for the loss in patronage.
5. Proposed PRT Network
PRT network of 18 km length has been proposed in the case study area to meet the estimated travel demand of the sectors already inhabited. The network has been designed to provide the high level of accessibility and the last mile connectivity to the users. The maximum acceptable walking distance has been taken as 250 meters while designing the PRT network. The network has been designed in small loops running parallel to the Blue Line of Delhi Metro. The network connects all the major metro stations, residential areas, commercial areas and institutional areas in the study area. The proposed route network has been presented in Figure 3.
Conclusion
In this study, stated preference technique has been used to record the willingness of the respondents to shift to PRT. Stated preference technique helps the respondents to make an informed decision about the mode choices available to them. Utility functions and binary logit models have been developed for each mode using factors like travel cost and travel time. These models have been used to estimate the patronage shift from each mode to PRT. This patronage shift is the estimated travel demand for PRT. The maximum number of trips are estimated to shift to PRT are from personal cars (97,340 trips per day). This will also help in reducing congestion on roads and air pollution due to reduction of number of cars on the roads. The overall shift to PRT has been estimated to be 36.6 percent of total trips. The travel demand for PRT in Dwarka has been estimated to be 222,465 trips per day. Although this is a fairly high number of trips, the viability of the project should checked only after finalizing the supply capacity and complete operational analysis.
This study was limited to certain selected sectors of Dwarka sub city in New Delhi. The sectors were selected such that they have high population density, residential, commercial and institutional land use which would ensure sufficient production and attraction of travel trips. The methodology adopted for travel demand estimation using stated preference technique and logit models can be modified or replicated in a similar way to estimate the travel demand for any other area where PRT is being planned. This will help urban transport planners to get precise travel demand which will further lead to efficient and accurate feasibility studies for PRT.
PRT is a comparatively newer and unexplored mode of public transportation in developing countries. Some of the critical issues associated with PRT are estimation of travel demand, operational capacity, empty runs and financial feasibility. One of these issues has been addressed in this study. Further studies should be conducted to assess other issues related to PRT and to better understand the practical applications and feasibility of PRT as a feeder as well as a stand-alone public transport system for urban areas.
References
- Anderson, J. E. (1978). What is Personal Rapid Transit. University of Washington.
- Anderson, J. E. (1996). Some Lessons from the History of Personal Rapid Transit. Conference on PRT and Other Emerging Transit Systems, Minneapolis.
- Anderson, J. E. (2009). An Intelligent Transportation Network System: Rationale, Attributes, Status, Economics, Benefits, and Courses of Study for Engineers and Planners. PRT International, LLC.
- Castro, C. M. S. e., Barbosa, H. M. and Oliveira, L. K. de. (2013). Analysis of the potential integration of cycling with public transport in Belo Horizonte. Journal of Transport Literature, 7(2), 146-170.
- European Commission. (2004). Fifth Framework Programme Key Action - City of Tomorrow and Cultural Heritage. EDICT Final Report.
- Gilbert, R. and Anthony, P. (2006). Grid-connected vehicles as the core of future land based transport systems. Energy Policy, 35(5), 3053–3060.
- Maitra, B., Ghosh, S., Das, S. S., & Boltze, M. (2013). Effect of model specification on valuation of travel attributes: a case study of rural feeder service to bus stop. Journal of Transport Literature, 7(2), 8-28.
- Muller, P. J. (2009). The Impact of PRT on Army Base Sustainability. Automated People Movers 2009, pp. 309-320.
- RITES. (2010). Transport Demand Forecast Study and Development of an Integrated Road cum Multi-Modal Public Transport Network for Modal Public Transport Network for NCT of Delhi. Government of National Capital Territory of Delhi, Transport Department, India.
- Sarkar, P. K., Maitri, V., Ram S. and Meenaz I. (2012). Personalized Rapid Transit Systems – An Approach towards Solving Urban Transport Problems, A Case Study in Gurgaon City, Haryana. School of Planning & Architecture, New Delhi, India.
- Ultra Fairwood Green Transport. (2009). DPR of PRT Amritsar Project. Detailed project Report, India.
- Vibhuti, A. (2009). Personal Rapid Transit: A Suitable Mass Transit Alternative for India. Institute of Urban Transport, New Delhi, India.
Publication Dates
-
Publication in this collection
June 2016
History
-
Received
23 Jan 2015 -
Reviewed
26 May 2015 -
Accepted
12 July 2015

 Source: Primary survey data.
 Source: Primary survey data with own calculations.
 Source: Primary survey data with own calculations.