ABSTRACT:
Autogenic controls have significant influence on deep-water fans and depositional lobes morphology. In this work, we aim to investigate autogenic controls on the topography and geometry of deep-water fans. The influence of the sediment concentration of turbidity currents on deep-water fans morphology was also investigated. From the repeatability of 3D physical modeling of turbidity currents, two series of ten experiments were made, one of high-density turbidity currents (HDTC) and another of low-density turbidity currents (LDTC). All other input parameters (discharge, sediment volumetric concentration and grain size median) were kept constant. Each deposit was analyzed from qualitative and quantitative approaches and statistical analysis. In each experimental series, the variability of the morphological parameters (length, width, L/W ratio, centroid, area, topography) of the simulated deep-water fans was observed. Depositional evolution of the HDTC fans was more complex, showing four evolutionary steps and characterized by the self-channelizing of the turbidity current, while LDTC fans neither present self-channelizing, nor evolutionary steps. High disparities on the geometrical parameters of the fans, as characterized by the elevated relative standard deviation, suggest that autogenic controls induced a stochastic morphological behaviour on the simulated fans of the two experimental series.
KEYWORDS:
Autogenic controls; Deep-water fans morphology; Turbidity currents; Physical modeling; Sediment concentration
RESUMO:
Controles autogênicos influenciam significativamente a morfologia dos leques de águas profundas e seus lobos deposicionais. Neste trabalho, objetivamos investigar a ação dos controles autogênicos sobre a topografia e a geometria de leques de águas profundas, bem como a influência da concentração de sedimentos gerados por correntes de turbidez sobre a morfologia destes. Por meio da repetibilidade de experimentos de modelagem física 3D de correntes de turbidez, foram realizadas duas séries de experimentos: correntes de turbidez de alta densidade (HDTC) e correntes de turbidez de baixa densidade (LDTC). Todos os demais parâmetros de entrada (vazão, concentração volumétrica de sedimentos e tamanho de grão) foram mantidos constantes. Cada depósito foi analisado mediante abordagens qualitativas e quantitativas e análise estatística. Em cada série experimental, foi observada a variabilidade dos parâmetros morfológicos dos depósitos gerados (comprimento, largura, razão comprimento/largura, área, topografia). Os leques de HDTC apresentaram evolução deposicional complexa, com quatro etapas evolutivas bem marcadas ao longo do tempo que resultaram no processo de autocanalização das correntes de turbidez, enquanto que nos leques de LDTC não foi identificado autocanalização ou quaisquer etapas evolutivas distintas. Altas disparidades na geometria dos leques, caracterizadas pelos elevados valores de desvio padrão relativo, sugerem que os controles autogênicos induziram a um comportamento morfológico estocástico nos leques.
PALAVRAS-CHAVE:
Controles autogênicos; Morfologia de leques submarinos; Correntes de turbidez; Modelagem física; Concentração de sedimentos
INTRODUCTION
Turbidity currents are powerful processes in deep-water fan systems in terms of volume of sandy sediments transported into ocean basins, and can generate large deposits with high potential for hydrocarbon reservoirs. The main sandy deposits are generated by turbidity currents, a sediment density flow in which the fluid turbulence acted as the grains support mechanism (Kuenen 1950Kuenen P.H. 1950. Turbidity Currents of High Density. In:18th International Geologic Congress, London, Report, Part 8, p. 44-52., 1951Kuenen P.H. 1951. Properties ofTurbidity Currents of High Density. Society of Economic Paleontologists and Mineralogists, Special Publication. 2:14-33.,Lowe 1982Lowe D.R. 1982. Sediment gravity flows; II, Depositional models with special reference to the deposits of high-density turbidity currents. Journal of Sedimentary Res earch. 52(1):279-298.), which can store hydrocarbon in deep-water fan systems as lobe complexes and their elements, commonly located at the most distal areas of deep-water fans (Prélat et al. 2010Prélat A., Covault J.A., Hodgson D.M., Fildani A., Flint S.S. 2010. Intrinsic controls on the range of volumes, morphologies, and dimensions of submarine lobes. SedimentaryGeology . 232(1-2):66-76.).
The morphology of deep-water fans and lobes is controlled by allogenic and autogenic processes. Allogenic controls are related to extrinsic factors of the depositional system (Beerbower 1964Beerbower J.R. 1964. Cyclothems and cyclic depositional mechanism in alluvial plain sedimentation. Kansas Geological Survey, Bulletin. 169:31-32., Johnson et al. 2001Johnson S.D., Flint S., Hinds D., Wickens H.V. 2001. Anatomy of basin floor to slope turbidite systems, Tanqua Karoo, South Africa: Sedimentology , sequence stratigraphy and implications for subsurface prediction. Sedimentology . 48:987-1023.), such as sea level, climatic and tectonic changes. Autogenic controls, in turn, are related to intrinsic factors of the depositional system and its capacity of self-organization (Beerbower 1964Beerbower J.R. 1964. Cyclothems and cyclic depositional mechanism in alluvial plain sedimentation. Kansas Geological Survey, Bulletin. 169:31-32., Paola et al. 2009Paola C., Straub K., Mohrig D., Reinhardt L. 2009. The “unreasonable effectiveness” of stratigraphic and geomorphic experiments. Earth-Science Reviews . 97(1-4):1-43.), as avulsion, migration and abandonment of channels.
Recent studies (Straub et al. 2009Straub K.M., Paola C., Mohrig D., Wolinsky M.A., George T.2009. Compensational stacking of channelized sedimentary deposits. Journal of Sedimentary Res earch. 79(9):673-688., Hajek et al. 2010Hajek E.A., Heller P.L., Sheets B.A. 2010. Significance of channel-belt clustering in alluvial basins. Geology . 38(6):535-538., Jerolmack & Paola 2010Jerolmack D.J., & Paola C. 2010. Shredding of environmental signals by sediment transport. Geophysical Research Letters. 37(19):L19401., Prélat et al. 2010Prélat A., Covault J.A., Hodgson D.M., Fildani A., Flint S.S. 2010. Intrinsic controls on the range of volumes, morphologies, and dimensions of submarine lobes. SedimentaryGeology . 232(1-2):66-76., Wang et al. 2011Wang Y., Straub K.M., Hajek E.A. 2011. Scale-dependent compensational stacking: An estimate of autogenic time scales in channelized sedimentary deposits. Geology . 39(9):811-814.) on autogenic dynamics and allogenic controls have been focused on autogenic signatures within the sedimentary record. They intend to verify whether these records can be distinguished from allogenic signatures or mask some allogenic processes. With the use of different approaches, i.e., physical and numerical modelling and description of ancient sedimentary systems at the outcrop, these studies introduced statistical and qualitative methods to quantify the influence of self-organization on stratigraphic stacking and also on the morphology of sedimentary systems, particularly considering the spatial and temporal scales of each type of control. Autogenic processes can erase the evidence generated by allogenic processes. However, a significant gap remains in the understanding of turbidity currents, because autogenic processes may form structures similar to allogenic processes.
The goals of this work are to observe the influence of autogenic controls on geometry and morphology of fans and lobes, as well as on the morphodynamic evolution of deposits, and to verify the influence of sediment concentration of the turbidity currents on the geometry and morphology of the deposits. We explore the autogenic influence on morphology and geometry of turbidity currents deposits with the 3D physical modelling of turbidity currents in a tank with similar slope and basin geometry. This is an important topic in deep-water sedimentology, and the data presented are relevant to the better understanding of the behavior of turbidity currents in the natural environment and their resulting deposits.
APPARATUS AND METHODOLOGY
Experimental methodology
The experimental methodology reproduced a scenario of simulation in which only autogenic processes acted on the formation of deposits, i. e., without changes of extrinsic factors to the experiment. Two series of ten continuous feed experiments of turbidity currents were made, one with higher sediment concentration (15% Cvol), representing high-density turbidity currents (HDTC>10% Cvol.; Kuenen 1966Kuenen P.H. 1966. Matrix of turbidites: Experimental approach. Sedimentology . 7(4):267-297., Middleton 1967Middleton G.V. 1967. Experiments on density and turbidity currents: III. Deposition of sediment. Canadian Journal of Earth Science. 4(3):475-505.), and one with lower sediment concentration (5%), representing low-density turbidity currents (LDTC<10% Cvol; Middleton & Hampton 1973Middleton G.V., & Hampton M.A. 1973. Sediment gravity flows: mechanics of flow and deposition. In: Middleton G.V., & Bouma A.H. (eds.) Turbidity and Deep Water Sedimentation. SEPM, Pacific Section, Short Course Lecture Notes, p. 1-38.). In each experimental series, all input parameters, such as discharge, sediment concentration, suspension grain size, suspension volume and experiment duration (Tab. 1), had the same value and were maintained constant during each experiment, giving to the experiments an ideal condition for the evaluation of autogenic processes. In addition, an extra experiment of low-density turbidity currents (LDTCEx) was run at three times the duration.
We thus compared the deposits in each experimental series and observed their geometric and morphological trends, testing the autogenic influence on depositional products and, also, the influence of sediment concentration, comparing deposits of HDTC and LDTC series. The analysis was of individual deposits of each experiment series and not of stacked deposits.
Experimental apparatus and flow characteristics
The physical experiments were performed in a 230 cm-long × 110 cm-wide tank (Fig. 1A) featuring a 4º sloping floor that deepened from 30 cm at the input to 50 cm at the tank bottom (Fig. 1B). The simulation of the connection of the continental slope to the basin floor was made at the laboratory of the Núcleo de Estudos em Correntes de Densidade of the Instituto de Pesquisa Hidráulica of the Universidade Federal do Rio Grande do Sul (NECOD/IPH/UFRGS).

Experimental apparatus. (A) Tank and tower of feeding (I - Tank, II - Metallic tower, III - reservoir, IV - Mixer, V - Flow rate meter, VI - Diffuser conduit, VII - Tank bottom and their X and Y axis). (B) Longitudinal profile geometry.
The suspension was prepared in an auxiliary reservoir (feeder system) (Fig. 1A), consisting of a metal bowl of 90 L connected through pipes and valves to a metal tower with 270 cm in height (Fig.1A). A mechanical mixer inside this auxiliary reservoir was responsible for keeping the suspension homogenised. The suspension was composed of water and sieved mineral coal with a density of 1,190 kg/m3 and grain size ranging from 0.5 to 150 µm (with grain size median - D50 - approximately 45 µm). The sieved mineral coal was used due its good hydrodynamic behaviour in small-scale experiments of turbidity currents (Manica 2002Manica R. 2002. Modelagem física de correntes de densidade não conservativas em canal tridimensional de geometria simplificada. MS Dissertation, Instituto de Pesquisas Hidráulicas, Universidade Federal do Rio Grande do Sul, Porto Alegre, 121 p., Manica et al. 2006Manica R., Maestri R.D., Borges A.L.O. 2006.Modelagem física de correntes de turbidez: descrição do processo e implicações no estudo dos depósitos turbidíticos. Pesquisas em Geociências.33(2):19-33.), decreasing the scale effects, beyond to have a low cost.
The suspension was injected continuously into the tank after passing through a magnetic flowmeter (Siemens M1100) with a discharge time series at 4 Hz frequency. At the end of this feeder system, a diffuser conduit (30 cm long) (Fig. 1A) was installed to conduct the flow in order to decrease the effects of the jet generated at the injection point.
Two samples of the injected suspension were collected, one before and the other after the experiment, to determine the concentration and grain-size homogenization. The experiments were recorded using two cameras, one positioned at the top-view of the tank, recording the flow initial propagation at the same location for all experiments every 10 s (Fig.2), and another movable, recording flow and deposit details during the experiment. Qualitative visual description of the deposits evolution was also performed along the entire simulation to follow the depositional system development and/or evolution. At the end of each run, a laser scanner (accuracy of 0.1 mm) swept the entire deposit to create digital surfaces. Finally, the sediment grain size of both mixture and deposit samples were performed by a Cilas 1180 laser particle analyser.
Experiment evolution. Sequence of images showing the first 90 s of the experiment, in which each picture is 30 seconds delayed. (A) 0s. (B) 30s. (C) 60 s. (D) 90s.
The main characteristic of the density flows generated in both experimental series was the bipartite behaviour of the currents, in which it was identified, visually, a concentrated basal layer, that concentrated most of the sediments and a cloud of fine sediments in suspension (Alexander & Morris 1994Alexander J., & Morris S. 1994. Observations on experimental, nonchannelized, high-concentration turbidity currents and variations in deposits around obstacles. Journal of Sedimentary Research. 64(4): 899-909. , Parsons et al. 2002Parsons J.D., Schweller W.J., Stelting C.W., Southard J.B., Lyons W.J., Grotzinger J.P. 2002. A preliminary experimental study of turbidite fan deposits. Journal of Sedimentary Res earch. 72(5):619-628., Baas et al. 2004Baas J.H., Kesteren W.V., Postma G. 2004. Deposits of depletive high-density turbidity currents: Aflume analogue of bed geometry, structure and texture. Sedimentology. 51(5):1053-1088., Guirro 2008Guirro A.C. 2008. simulações físicas de correntes de turbidez: efeitos da variação do tamanho dos grãos e da vazão. PhD Thesis, Instituto de Geociências, Universidade Federal do Rio Grande do Sul, Porto Alegre, 161 p.). The hydrodynamic analysis of the individual flow layers (basal concentrated and fine suspension) was not possible due to the lack of appropriate instrumentation. However, the entire body of the currents were analysed by videos and images, in which was calculated the average Froude and Reynolds number (Tab. 2) in the first 60 s of experiment. Thus, all HDTC and LDTC presented subcritical (Froude<1) and good degree of turbulence behaviour (Reynolds>500), when compared with open channel flows. These characterizations showed no significant inlet jet influence during the first stages of the flow; it was mainly aided by the wall diffuser installed just after the source. Yet, the two simulated types of flows (15 and 5% - initial sediment volumetric concentration - Cvol) had Newtonian rheological behaviour, as both had less than 25% of volumetric concentration threshold of pure coal sediment (non-cohesive) in the mixture, as reported by Castro (2016Castro C. 2016. Propriedades reológicas de misturas utilizadas em simulação física de correntes de turbidez. MS Dissertation, Instituto de Pesquisas Hidráulicas, Universidade Federal do Rio Grande do Sul,Porto Alegre, 100 p.). Despite the basal layer of the flows had had probably a different concentration than the initial suspension, perhaps higher what would imply a non-Newtonian behaviour, it cannot be suggested exactly why, when a density flow is streaming, sediments are settling and ambient fluid is incorporated (Mulder & Alexander 2001Mulder T., & Alexander J. 2001. The physical character of subaqueous sedimentary density flows and their deposits. Sedimentology . 48(2):269-299.,Talling et al. 2012Talling P.J., Masson D.G., Sumner E.J., Malgesini G. 2012. Subaqueous sediment density flows: Depositional processes and deposit types. Sedimentology . 59(7):1937-2003.), in order to damp the concentration increasing and to maintain its rheological behaviour.
Analytical methodology
The analytical methodology used in this study was based in quantitative aspects, from the statistical analysis, and qualitative observations. This methodology was applied to evaluate both the boundary conditions of experiments and the deposits and their elements. In this manner, the identification of a standard behavior of the results as function of constant boundary conditions, allowed an accurate method to evaluate the morphologic features of the deposits (channels, lobes, levees, etc.) regarding visual repetition.
The standard deviation (S) (Eq. 1) and the relative standard deviation (RSD) (Eq. 2) were used to assess the repeatability of the experiments and quantify the level of variance of the geometric elements.
in which xi is the individual value; x_, the arithmetic mean; and n, the total quantity of individual values.
in which S is the standard deviation (non-polarised) and x_, the arithmetic mean.
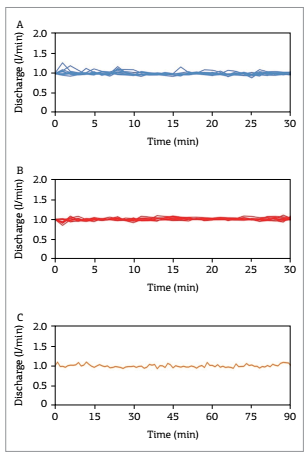
The input parameters of each suspension demonstrate the degree of repeatability of the experiments. In all experiments, the mean values for discharge (Tab. 3) were close to the expected value of 1.0 L/min. The RSD discharge values of the HDTC series (around 4% on average) were higher than LDTC series (3% on average). Averaged time series of discharge (per minute) in all experiments of both series (Fig.3) show few oscillations during the experiments, but, in most cases, discharge remained constant at 1.0 L/min. Mean values of volumetric concentrations and grain sizes (D50) (Tab.4) showed close to the expected values (Tab. 1). RSD values of sediment volumetric concentration and suspension sediment grain sizes were similar in the HDTC and LDTC series and LDTCEx experiment.

Discharge temporal series. (A) High-density turbidity current series. (B) Low-density turbidity current series. (C) Extra experiment of low-density turbidity currents.
Low RSD values in all input parameters (discharge, volumetric sediment concentration and grain size of suspension sediments) indicate a satisfactory degree of experimental repeatability (>90%). From this statistical analysis, we have an experimental scenario of autogenic controls in the simulated deep-water fan systems that have minimal external controls.
MORPHOLOGY OF SIMULATED DEEP-WATER FANS
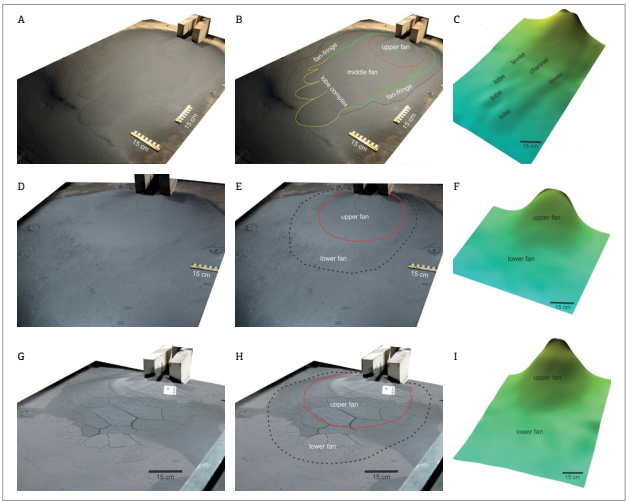
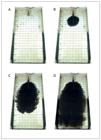
The deposits generated in both experimental series settled along the slope area of the tank. On the basin (horizontal bottom), it was generated just a thin accumulation (<0.5 mm), deposited by the suspension cloud over the entire area of the tank. The accumulations that were considered as effective deposit areas (analysable) presented visible relief and, generally, thickness >1 mm. Both series of the experiments generated fan-shaped deposits, here called simulated deep-water fans; showing different dimensions and morphologies. The HDTC deposits (Figs. 4A-4C) were longer and had a more complex morphology than the nearly round-shape deposits of LDTC (Figs. 4D-4F).

Details of morphological elements of the simulated deep-water fans. (A, B, C) Example of high-density turbidity current fan (H3): pure image, image with morphological units discrimination and topographic model with internal features discrimination. (D, E, F) Example of low-density turbidity current fan (L3): pure image with morphological units discrimination and topographical model with morphological units discrimination.
Morphology of high-density turbidity current fans
The HDTC fans presented a slightly varied morphology (Figs. 5A-5T), mainly distinguished by internal units. From visual analysis and topographic surveying, four major morphological elements were identified and classified: upper fan, middle fan, lobe complex and fan-fringes, presented in detail in Figures 4A-4C.
-
Upper fan: the upper fan was identified as a thicker semi-circular shaped body localized at the proximal area of the fans and surrounding the current entry point. This body had 250-300 mm radius and thickness between 20 and 45 mm. Proximal fans were identified in all 10 simulated HDTC fans;
-
Middle fan: the middle fan was identified by an elongated shape extending from the upper fan to the lobe complex and limited laterally by the fan-fringes, showing thicknesses between 3 and 20 mm. This morphological element was characterized by two different internal features. One has two longitudinal elongated relief features at the flanks of the middle fan similar to levee shapes, represented by incipient topographic highs extending from the upper fan to the lobe complex. The other one is a smooth and short channel between the longitudinal elongated deposits, mostly filled by sediments at more proximal areas and more visible near the lobe complexes. All simulated HDTC fans presented longitudinal elongated relief features and channel with the exception of the experiment H10;
-
Lobe complex: the lobe complex occurred at the more distal area of the simulated deep-water fan (lower fan), characterized by a group of lobes arranged side by side and, in a few cases, partially amalgamated. They had variable sizes and lobe quantities (from 2 to 4 units), showing thicknesses between 1 and 3 mm. These lobes were considered the smallest hierarchical element in the lobe complexes, according to the Prélat et al. (2009Prélat A., Hodgson D.M., Flint S.S. 2009. Evolution, architecture and hierarchy of distributary deep-water deposits: A high-resolution outcrop investigation from the Permian Karoo Basin, South Africa. Sedimentology . 56(7):2132-2154.) classification. The boundary between the lobe complex and middle fan and the boundaries of some lobes were diffuse, due the smoothness of the topography of these deposit areas. Experiment H10 did not generate a lobe complex;
-
Fan-fringes: fan-fringes were thin sheets, thickness around 1 mm, located on the edge of the upper and middle fan, and, in a few cases, around the lobe complexes. All HDTC fans had fan-fringe elements.

3D topographical model (A, C, E, G, I, K, M, O, Q, S) and morphological units delimitation (B, D, F, H, J, L, N, P, R, T) of the high-density turbidity current fans.
Morphology of low-density turbidity current fans
Simulated LDTC fans had a simple morphology constituted by two elements. An upper fan occurred as a circular, conical feature around the current entry point, and a lower fan as a circular flat deposit that pinched out uniformly and smoothly from the upper fan to the edges (Figs. 4D-4F and Figs. 6A-6T). Lobes, levees and channels were not observed in LDTC fans. The LDTCEx fan (Figs. 4G-4I and Figs. 6U-6V) presented the same morphological features as the LDTC fans, however the boundary between the upper and lower fan was very clear, due to the different gradient and thickness.

3D topographical model (A, C, E, G, I, K, M, O, Q, S) and morphological units delimitation (B, D, F, H, J, L, N, P, R, T) of low-density turbidity current fans and extra experiment of low-density turbidity current fan. Obs.: distal fans were delimitated by the 1 mm isopach, due poor visible deposit edges.
QUANTITATIVE COMPARISON OF THE MORPHOLOGY OF THE SIMULATED DEEP-WATER FANS
Two topographic sections of the laser sweep were selected to compare quantitatively the morphology of both series from statistically analysis, one longitudinal (line 500 - Y axis) and the other one transverse (line 300 - X axis), in all deposits of them. The chosen lines are good elements for a quantitative comparison of deposits morphology, because they cross lines at approximately the maximum length and width of the deposits.
HDTC fans were thicker than LDTC fans along the entire longitudinal and transversal sections, except in the first 200 mm of strike sections, in which some LDTC fans were thicker than HDTC fans (Figs. 7A and 7B). Deposits of the HDTC fans were longer and wider than LDTC deposits. Simulated HDTC fans presented topographic gradients (average dip angle) lower than LDTC deposits (Fig. 7A), with no significant topographical break in the longitudinal section in both series. The LDTCEx fan showed the highest deposit thickness in the first 350 mm of the longitudinal sections. At the beginning of the section, the LDTC EX fan was approximately twice thick than the HDTC and LDTC fans (Fig. 7A). Moreover, LDTCEx fan had higher average dip angle than fans of the other two experimental series, showing a significant topographic break at the 500 mm of the longitudinal section. Transversal sections (Fig. 7B) of the simulated fans presented shape distinctions between HDTC and LDTC deposits. The main difference was the top of the sections, in which HDTC fans were flat, and LDTC fans and LDTCEx fan were curved.

Quantitative comparison between high-density turbidity current and low-density turbidity current fans morphology. (A) Longitudinal sections topography of the simulated deep-water fans of both series and standard deviation of their topographic levels. (B) Transversal sections topography of the simulated deep-water fans of both series and standard deviation of their topographic levels. (C) Sections orientation.
Longitudinal sections of the HDTC fans had higher topographic S than LDTC sections, except in the first 50 mm (Fig. 7A). In the transverse sections (Fig. 7B), the HDTC topography had higher values of S than LDTC topography along the entire sections.
GEOMETRICAL PARAMETERS OF THE SIMULATED DEEP-WATER FANS
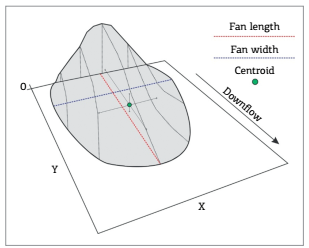
The geometrical parameters of length, width, length to width (L/W) ratio, volumetric centroids and fan areas were obtained for the effective deposits (Fig.8), i. e., the simulated deep-water fans. Length and width were measured in deposit images and 3D digital surfaces. The volumetric centroids (X and Y coordinates) and area were calculated from the 3D laser survey. Due to low thickness of the fans, the Z coordinate of the centroids was not considered.

Scheme of measurement of length, width and centroids of the simulated deep-water fans, which were obtained from 3D topographic models and deposit images.
The values of the geometric parameters of the simulated deep-water fans of both experimental series, as well as their statistical analysis, are shown in Table 5.The HDTC deposits were approximately twice in terms of mean values of length and width than LDTC deposits (Fig.9). In the HDTC fans, the difference between the maximum value (H9) and the minimum value (H2) of length was 22%, and the maximum value of width (H10) and minimum value (H3) was 16%. In the LDTC fans, the maximum value (L5 and L7) and the minimum value (L9) of length had a discrepancy of 7%, while the maximum value (L10) and the minimum value (L3) of width had 14%. The LDTCEx deposit was almost two times longer and wider than the LDTC deposits, but had smaller length and width than HDTC deposits.

Geometrical parameters of the simulated deep-water fans. (A) Graphic fan length x fan width. (B) Graphic fan area x fan L/W ratio. Note that the high-density turbidity current (HDTC) fans occupy a larger area of the graphics than low-density turbidity current (LDTC) fans, suggesting higher geometrical variability of the HDTC fans than LDTC fans.
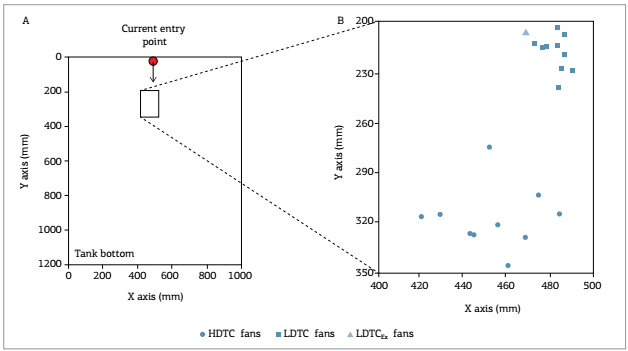
Simulated HDTC fans were on average 20% more elongated than LDTC fans and the LDTCEx fan, based on to their mean L/W ratios. The volumetric centroids (Fig. 10 and Tab.5) of HDTC deposits were positioning 100 mm farther downflow than the centroids of LDTC fans and the LDTCEx fan. In addition, the HDTC centroids location varied (mainly in X) more than LDTC fans. Simulated LDTC fans had L/W ratio and centroid coordinates similar to the LDTCEx fan. HDTC fan areas were around three times greater than LDTC areas, and around 1,5 time greater than the LDTCEx fan.
X and Y coordinates of fan centroids of the both experimental series. Note the major dispersal of centroids of the high-density turbidity current fans than centroids of low-density turbidity current fans.
According to RSD values (Tab.5), HDTC fans presented variability higher than 6% for all geometric parameters, except for the width and centroid coordinate X. On the other hand, LDTC fans presented variability lower than 6% for all geometric parameters.
GEOMETRICAL ANALYSIS OF THE HIGH-DENSITY TURBIDITY CURRENT LOBE COMPLEXES
The lobe complexes are the main depositional result of the turbidity currents in the natural environment and they constitute high-quality oil reservoirs. The geometrical analysis of lobe complexes can provide consistent data for the interpretation of depositional processes and the influence of autogenic controls in turbidity current deposits. Thus, it focuses on the analysis of simulated lobe complexes of the HDTC fans for further discussion and interpretation. From the length, width, L/W ratio, area and area factor (lobe complex area to fan area ratio (A)) (Eq. 3), the lobe complexes and their individual lobes were analyzed to compare the morphology of the HDTC fans (Tab. 6). We preferred to use the area values rather than volume values, because of the difficulty in calculating the volume of the lobe complexes and their individual lobes; as they are similar and very thin in all HDTC fans. On the other hand, this area analysis provided consistent data for the deposits analysis.
Based on the lobe complex L/W ratio and area (Fig. 11A), two distinct groups of simulated HDTC fans, each one comprising about half of experiments, are apparent.
-
Group I: lobe complexes of simulated fans H1, H2, H4, H6 and H8, which had L/W ratio <1 and presented the smaller areas than group II fans. Moreover, group I fans presented the lowest fan L/W ratio (Fig. 11B) and the lowest A factor (Fig. 11C);
-
Group II: lobe complexes of the simulated fans H3, H5, H7 and H9, which had L/W ratio >1 and presented the larger areas than group I fans. Moreover, group II fans presented the highest fan L/W ratio (Fig. 11B) and A factor (Fig. 11C).

Geometrical parameters of lobe complexes of the high-density turbidity current fans. (A) Graphic of lobe complex area x lobe complex L/W ratio. (B) Graphic of fan L/W x lobe complex L/W ratio. (C) Graphic of A factor x lobe complex L/W ratio.
Statistical analysis of lobe complexes of the HDTC fans (Tab. 6) confirms the high disparity in geometry among the lobe complexes, in which the RSD of length, width, L/W ratio and area were higher than fans geometry variability (Tab.5). In addition, A factor also had a considerable variability in terms of RSD.
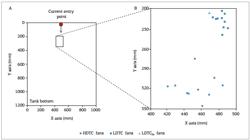
Individual lobes of the lobe complexes were also analyzed for length, width and L/W ratio. In this analysis, the lobes were previously divided into lobe complexes group I and group II. The lobes presented a tendency to group together in two different regions (Fig. 12), according to their length and width, so that individual lobes of complexes group I were in a region (region I) and individual lobes of complexes group II were in other region (region II). Lobes of group I (region I) are smaller than lobes of group II (region II), according to their mean values (Tab. 7). On the other hand, L/W ratio had approximately the same mean values (2.0), indicating similar forms. RSD values show significant variance (between 20 and 40%) of geometrical parameters in both lobe groups. Length variation was higher in group II, while width and L/W ratio were more variable in group I.

Graphic of length x width of the individual lobes and their respective regions (grey) according lobe complex groups.
DESCRIPTIVE EVOLUTION OF THE SIMULATED DEEP-WATER FANS
Depositional evolution of the simulated deep-water fans was obtained by visual description of the deposit, following the superficial morphological evolution during the experiments. Internal architecture of the fans could not be observed due the lack of color contrast of the sedimentary material used in the models, and for the small thickness of the deposits as well. Depositional evolution was different between the two experimental series, but progradational and aggradational behaviour was observed in both series.
High-density turbidity current fans evolution
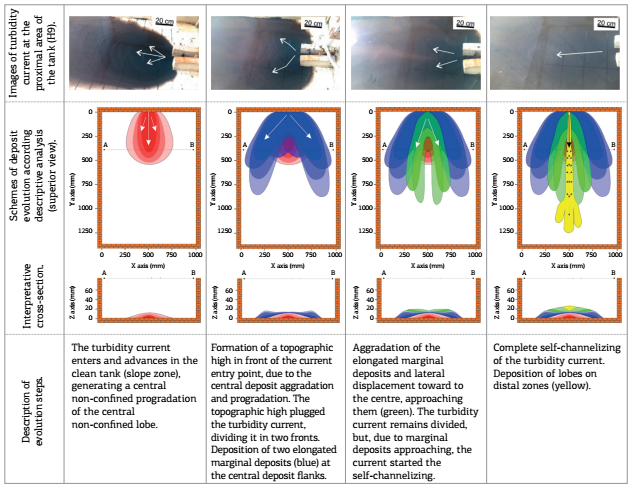
All simulated HDTC fans had a complex and chronologically organised depositional evolution, except in experiment H10. Self-channelizing was the main process observed in HDTC fans (Métivier et al. 2005Métivier F., Lajeunesse E., Cacas M.C. 2005.Submarine canyons in the bathtub. Journal of Sedimentary Res earch. 75(1):6-11., Yu et al. 2006Yu B., Cantelli A., Marr J., Pirmez C., O’Byrne C., Parker G. 2006. Experiments on self-channelized subaqueous fans emplaced by turbidity currents and dilute mudflows. Journal of Sedimentary Res earch. 76(6):889-902. , Guirro 2008Guirro A.C. 2008. simulações físicas de correntes de turbidez: efeitos da variação do tamanho dos grãos e da vazão. PhD Thesis, Instituto de Geociências, Universidade Federal do Rio Grande do Sul, Porto Alegre, 161 p., Hoyal et al. 2008Hoyal D., Sheets B.A., Edwards C.M., Bloch R.B. 2008. Controls from channel formation in deep-water distributive systems. AAPG Search and Discovery. Article#50090., Silva et al. 2012Silva D.S., Puhl E., Maestri R.D., Viana A.R. 2012. Comportamento de fluxos sedimentares como agentes de formação de canais submarinos: uma visão através da modelagem física. In: 46ºCongresso Brasileiro de Geologia, Santos, Brasil.), through the formation of a central topographic channel (valley) that captured and channelized the turbidity current (Fig. 13).

Descriptive depositional evolution of simulated high-density turbidity currents fans. (A) First evolutional step: deposit stage after 10 min (2/6 of experimental time). (B) Second evolutional step: deposit stage after 20 min (4/6 of experimental time). (C) Third evolutional step: deposit stage after 25 min (5/6 of experimental time). (D) Fourth evolutional step: deposit stage after 30 min (6/6 of experimental time).
The morphologic evolution of the HDTC deposits presented four well-defined steps, observed in all experiments except H10, whose deposit did not generate lobe complex formation and self-channelizing processes. These four steps followed the following chronological order (Fig. 13):
-
First step: from the beginning to minute 10 (2/6 of experimental time), the turbidity current entered the clean tank bottom, generating a central non-confined deposit, which prograded and aggraded along time (Fig. 13A). Until this time, 2/6 of total time, the evolution of HDTC fans is very similar to the entire LDTC fans, as shown in the next sub-item;
-
Second step: from minute 10 to minute 20 (4/6 of experimental time), the non-confined deposit aggraded and formed a topographic high (first step), which nearly plugged the current entry point, dividing the flow into two lateral fronts. By compensational stacking (Straub et al. 2009Straub K.M., Paola C., Mohrig D., Wolinsky M.A., George T.2009. Compensational stacking of channelized sedimentary deposits. Journal of Sedimentary Res earch. 79(9):673-688.), from this moment (minute 10) on, the formation of two elongated deposits started at the non-confined central deposit flanks, prograding and aggrading until minute 20 (Fig. 13B);
-
Third step: from minute 20 to minute 25 (5/6 of experimental time), lateral elongated deposits stopped progradation and aggraded, generating two lateral topographic highs (similar to levees morphology) and a topographic low in the middle (incipient channel). Consequently, the two turbidity current fronts started a lateral movement toward the centre. At this time, an incipient self-channeling of the current began, but the flow remained divided in two fronts (Fig. 13C);
-
Fourth step: from minute 25 to 30 (6/6 of experimental time), complete self-channelizing of the turbidity current unified the flow. Partial filling of the central topographic low occurred, forming a very smooth channel and a lobe complex at distal areas (Fig. 13D).
Low-density turbidity current fans evolution
In LDTC series, deposits evolution was characterized by a continuous and uniform progradation and aggradation along time (Fig. 14), generating a smooth fan-shaped body. LDTC fans evolution presented similar evolution steps and no self-channelizing of the simulated turbidity currents, in which the flow remained non-confined during the entire experiment duration. The LDTCEx fan had three times more experimental duration, but presented the same depositional evolution of the LDTC fans. However, the LDTCEx fan presented higher aggradational and lower progadational behaviour in relation to LDTC fans.

Descriptive depositional evolution of simulated low-density turbidity current (LDTC) fans. (A) Deposit stage after 10 min (1/3 of experimental time). (B) Deposit stage after 20 min (2/3 of experimental time). (C) Deposit stage after 30 min (3/3 of experimental time). (D) Scheme of simulated LDTC fan progradation (superior view) and aggradation (cross section) during experimental time.
DISCUSSION
The discussion is divided into three parts. Part one discusses the analogy with modern deep-water fans, part two deals with the influence of the sediment volumetric concentration on HDTC and LDTC fans morphology, and part three approaches the influence of the autogenic forces on the simulated deep-water fans morphology.
Comparison with modern deep-water fans
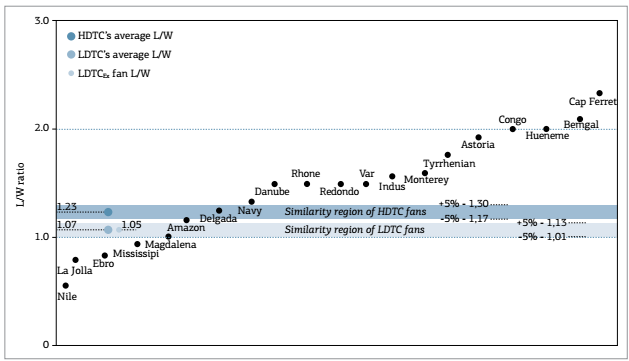
The morphology of the simulated fans and lobes is compared with some modern deep-water fans and their depositional lobes to validate our deep-water fans simulations and establish a good degree of “unreasonable effectiveness” (Paola et al. 2009Paola C., Straub K., Mohrig D., Reinhardt L. 2009. The “unreasonable effectiveness” of stratigraphic and geomorphic experiments. Earth-Science Reviews . 97(1-4):1-43.). The morphological comparison was based in the average L/W ratio of HDTC and LDTC fans and the L/W ratio of some important deep-water fans of the world (Fig. 15). Two graphic regions with 95% similarity degree (5% to more or less about the average L/W ratio of HDTC and LDTC fans) were created to establish good modern analogs. According to the graphic regions, Delgada Fan (USA, California) has the best similarity with the simulated HDTC fans, while the Magdalena Fan (Caribbean Sea, Colombia) resembles with the LDTC fans and LDTCEx fan.
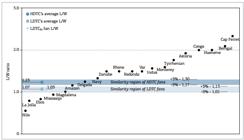
Morphological comparison among the simulated and modern deep-water fans: graphic of L/W ratio with the average L/W of high-density turbidity currents (HDTC) and low-density turbidity current (LDTC) fans and L/W of modern submarine fans, showing Delgada Fan into the similarity region of HDTC fans and Magdalena Fan occupying the similarity region of LDTC fans. (*): The boundaries of the similarity regions were defined by 5% above and below of the average L/W ratio of HDTC and LDTC fans (similarity degree of 95%).
Beyond the L/W ratio comparison, other geologic parameters of these modern deep-water fans can be linked to reinforce the comparisons in a relative way. Discharge and average sediment load at their feed river mouth is presented in Tab. 8. The sediment concentration average at the feeder river mouth of Delgada Fan is higher than Magdalena Fan. Moreover, Delgada Fan is from the California borderland, a small-active continental margin (Somme et al. 2009Somme T.O., Helland-Hansen W., Martinsen O.J., Thurmond J.B. 2009. Relationships between morphological and sedimentological parameters in source-to-sink systems: Abasis for predicting semi-quantitative characteristics in subsurface systems. Basin Research. 21(4):361-387.), characterized by the strong longshore drift-feed of their canyons in a narrow continental shelf (Covault et al. 2007Covault J.A., Normark W.R., Romans B.W., Graham S.A. 2007. Highstand fans in the California borderland: the overlooked deep-water depositional systems. Geology. 35(9):783-786.). These two sedimentological parameters combined have great capacity to generate high-density turbidity currents at continental slope canyons (Piper & Aksu 1987Piper D.J.W., & Aksu A.E. 1987. The Source and origin of the 1929 grand banks turbidity current inferred from sediment budgets. Geo-Marine Letters . 7(4):177-182., Mulder & Syvitski 1995Mulder T., & Syvitski J.P.M. 1995. Turbidity currents generated at river mouths during exceptional discharges to the world oceans. The Journal ofGeology. 103(3):285-299., Mulder et al. 2003Mulder T., Syvitski J.P.M., Migeon S., Faugères J-C., Savoye B. 2003. Marine hyperpycnal flows: Initiation, behavior and related deposits. A review. Marine and PetroleumGeology. 20(6-8):861-882.), therefore Delgada Fan is more inclined to be dominated by HDTC than Magdalena Fan, supporting HDTC fans as good analogs to Delgada Fan.
In the other hand, Magdalena Fan is located on a mixed (active/passive) narrow continental shelf fed mainly by the Magdalena River mouth, settling its sediment load directly on the continental slope (Kolla & Buffler 1983Kolla V., & Buffler R.T. 1983. Morphologic, acoustic, and sedimentologic characteristics of the Magdalena Fan. Geo-Marine Letters. 3(2-4):85-91., Ercilla et al. 2002Ercilla G., Alonso B., Estrada F., Chiocci F.L., Baraza J.S., Farran M. 2002. The Magdalena Turbidite System (Caribbean Sea): present-day morphology and architecture model. MarineGeology . 185(3-4):303-318.). Longshore drift-feed has no documented influence in the Magdalena Fan. Its low sediment concentration at the river mouth, in relation to the Delgada Fan, suggests that the Magdalena Fan is more likely to be dominated by LDTC than HDTC, although some events of debris-flow also occurred (Kolla & Buffler 1983Kolla V., & Buffler R.T. 1983. Morphologic, acoustic, and sedimentologic characteristics of the Magdalena Fan. Geo-Marine Letters. 3(2-4):85-91.). Therefore, LDTC fans can be good analogs to Magdalena Fan.
Another experimental result related to the modern and ancient deep-water fans concerns the relief gradient (slope) of the fans (Fig. 7A). According to Somme et al. (2009Somme T.O., Helland-Hansen W., Martinsen O.J., Thurmond J.B. 2009. Relationships between morphological and sedimentological parameters in source-to-sink systems: Abasis for predicting semi-quantitative characteristics in subsurface systems. Basin Research. 21(4):361-387.), longer fans have lower gradients. The same relationship was found in the simulated deep-water fans. HDTC fans were longer and had lower gradients than LDTC and LDTCEx fans.
The comparison between the HDTC lobes and the lobes of some modern deep-water fans (Prélat et al. 2010Prélat A., Covault J.A., Hodgson D.M., Fildani A., Flint S.S. 2010. Intrinsic controls on the range of volumes, morphologies, and dimensions of submarine lobes. SedimentaryGeology . 232(1-2):66-76.) used the L/W ratio (Fig. 16). The mean of the L/W ratio of the HDTC lobes had the same value as the lobes of Congo (Africa west coast), Kutai (Indonesia) and Niger (Nigeria) Fans, and similar values of Fan 3 (Karoo Basin - ancient) and Golo Fan (France). The lobes of the Amazon Fan have different values. Thus, we consider that the depositional lobes generated in HDTC experimental series have similarity in terms of L/W ratio with lobes present in many deep-water fans systems around the world.

Morphological comparison among the simulated high-density turbidity currents lobes and natural depositional lobes.
Despite the simplified morphology of simulated fans relative to modern fans, mainly in terms of their short and straight (simulated models) relative to the long and sinuous (natural examples) channels of the actual examples, which probably reflects a more complex set of sedimentological processes acting in deep-water environments, it is here assumed that a satisfactory unreasonable effectiveness in terms of both fans and individual lobes geometry was successfully achieved through physical simulation. A large similarity in terms of L/W ratio between simulated and modern deep-water fans, as well as between their individual lobes, points to a good comparison degree.
The influence of the sediment volumetric concentration of high-density turbidity current and low-density turbidity current on fans morphology
The great disparity presented by the simulated HDTC and LDTC fans in terms of morphology and depositional evolution suggests that the sediment volumetric concentration of the simulated turbidity currents had decisive influence on the different morphologies, despite both flow types had the same Newtonian rheological behaviour. The quantitative (L/W ratio) and qualitative (descriptive) analysis led to the observation that the HDTC fans had a diverse morphology of four, well developed, major relief features in the more elongated and lower gradient fans (than LDTC fans). The HDTC fans had a complex depositional evolution, with four observed evolutionary steps, characterized by the self-channelizing process. The LDTC fans had a more smooth morphology than HDTC fans, presenting two smooth relief features in less elongated fans and a simple depositional evolution, with no distinct evolutionary steps or any self-channelizing processes.
High-density flows (more viscous) have more sediment transport capacity than low-density flows (less viscous) when they keep their rheological (Newtonian) and turbulent behaviour along the system (Baas et al. 2004Baas J.H., Kesteren W.V., Postma G. 2004. Deposits of depletive high-density turbidity currents: Aflume analogue of bed geometry, structure and texture. Sedimentology. 51(5):1053-1088., Manica 2009Manica R. 2009. Geração de correntes de turbidez de alta densidade: condicionantes hidráulicos e deposicionais. PhD Thesis, Instituto de Pesquisas Hidráulicas, Universidade Federal do Rio Grande do Sul, Porto Alegre, 425 p., Manica 2012Manica R. 2012. Sediment Gravity Flows: Study based on experimental simulations. In: Harry E., Schulz E., Simões A.L.A., Lobosco R. J. Hydrodynamics -Natural Water Bodies, 1:263-286., Talling et al. 2012Talling P.J., Masson D.G., Sumner E.J., Malgesini G. 2012. Subaqueous sediment density flows: Depositional processes and deposit types. Sedimentology . 59(7):1937-2003.). This is a key point in support of the higher L/W ratio of the HDTC fans in relation to LDTC fans. The simulated turbidity currents generated in the HDTC series transport more sediment in the downflow direction, generating more elongated fans than the LDTC series. Moreover, the HDTC fans and the LDTCEx presented different area and length, although both had similar bulk volume. HDTC fans had higher area and length than LDTCEx fan, suggesting that the simulated HDTC bypass more sediment to the distal regions in the tank than the low-density flows, which spread over a greater area. Additionally, the position of the distal fan centroids and the lower fan gradient of HDTC fans compared to the LDTC fans suggest a more progradational and less aggradational evolutionary behavior of the HDTC fans in relation to LDTC fans.
In addition, the flows with high sediment concentration had three times higher sediment input rate compared to the LDTC series. Thus, the larger sediment input rate of the HDTC experiments suggests a high demand for the self-adjustment of the system to accommodate these sediments in the tank during the experiments. This may explain the complex depositional evolution and the morphological features of the HDTC fans in relation to the LDTC fans. On the other hand, LDTC fans were generated by lower sediment input rates and, therefore, an easier accommodation of the sediment in the tank bottom, generating a simple depositional evolution and morphology.
Another key point to influence the disparity between HDTC and LDTC fans morphology and depositional evolution may be the bulk volume of the simulated fans. HDTC fans volume was three times greater than LDTC fans, one of the causes of the differences between the two experimental series. However, the fan generated in the LDTCEx had the same bulk volume of the HDTC fans and presented similar morphological (L/W ratio, centroid coordinates and smooth circular fan shape deposit), in addition to similar evolutionary behavior to all simulated LDTC fans of experimental series. Furthermore, the modern deep-water fan of the LDTC series fans and LDTCEx fan were similar to the Magdalena Fan. One effect observed was the higher dimensions of the LDTCEx fan, such as length, width and area, compared to LDTC fans. Therefore, the sediment volume was not the cause of the different morphological and evolutionary behaviors.
Autogenic controls on the simulated deep-water fans morphology
Autogenic influence over the simulated fans morphology is discussed from the statistical analysis of the geometrical parameters and topography. Based on the RSD and S, simulated HDTC and LDTC fans had a considerable variability of their geometrical parameters and topography. These oscillations were higher than expected, even considering the low variance of the experimental input parameters in both experimental series. The geometric parameters with higher than expected oscillation in the HDTC fans were length, L/W ratio, centroid Y coordinate and area (Fig. 17), while in the LDTC fans they were width, L/W ratio, centroid Y coordinate and area oscillated more than the input parameters. In addition, topographic surface presented great S in both series. Thus, these over-variations suggest that autogenic (intrinsic) controls had influence in the simulated fans morphology. This influence was attributed to the self-organizing property of sedimentary systems, which tend to adjust for a more efficient energy condition (Catuneanu et al. 2009Catuneanu O., Abreu V., Bhattacharya J.P., Blum M.D., Dalrymple R.W., Eriksson P.G., Fielding C.R., Fisher W.L., Galloway W.E., Gibling M.R., Giles K.A., Holbrook J.M., Jordan R., Kendall C.G.S.C., Macurda B., Martinsen O.J., Miall A.D., Neal J.E., Nummedal D., Pomar L., Posamentier H.W., Pratt B.R., Sarg J.F., Shanley K.W., Steel R.J., Strasser A., Tucker M.E., Winker C. 2009.Towards the standardization of sequence stratigraphy. Earth-Science Reviews. 92(1-2):1-33.). Therefore, in each experiment, a determinate self-adjust condition may have occurred, resulting in different geometrical and morphological behaviour.

Relative standard deviation comparison among the input parameters and geometric parameters of the fans. Grey belt in the graphic represents the range of input parameters relative standard deviation oscillation.
To investigate how the self-organization acted in the fans construction, it was investigated the morphological units of the HDTC fans and related to their depositional evolution. HDTC fans had a more well-developed morphological units and depositional evolution steps than the simulated LDTC fans and, therefore, led to a clear analysis of the autogenic influence. The geometrical analysis of the lobe complexes showed two groups in HDTC fans, which differ in terms of L/W ratio, area and A factor. Group I presented lower L/W ratios (<1), lower areas and lower A factor than group II, which had higher L/W ratios (>1), areas and A factor. The depositional lobes of the two groups also differed in terms of length and width; the lobes of group II had a tendency to be larger than lobes of group I. These four aspects - L/W ratio, lobe complex area, A factor and lobes dimensions - suggest that the HDTC fans of group II were more efficient in sediment bypassing to distal regions of the tank than group I HDTC fans, creating larger lobe complexes.
This more efficient sediment bypassing of group II was attributed to the greater depth of the late stage confining channel as compared to group I. Figure 18 compares the channel depth of a group II fan which had the maximum A factor and lobe complex area (H9) and the group I fan which had the minimum A factor and lobe complex area (H4). The channel of the H9 fan (Figs. 18A and 18B) was two times deeper and wider than H4 fan (Figs. 18C and 18D), suggesting a better flow confinement in group II fans through the upper and middle fan to distal regions of the tank relative to group I fans. This more efficient flow confinement indicates a lower tendency of channel fill and lateral flow avulsion, leading the turbidity current to transport a higher quantity of sediments to distal regions in the tank and, consequently, creating larger lobe complexes and lobes. H10 fan channel (Figs. 18E and 18F) was shallower compared with H9 and H4 fans and did not generate lobe complex. Therefore, the lobe complexes and lobe dimensions were directly associated with their channel depths which, in turn, were related with the self-channelizing process observed in the HDTC fans depositional evolution. Moreover, this self-channelizing process was interpreted as a way of self-organizing of the simulated deep-water fans systems, demonstrating an effective autogenic control on the depositional process of the experiments.

Channel geometry of H9 (A, B), H4 (C, D) and H10 (E, F) fans. The sections analysed were chosen from visual analysis of the best developed channel morphology on the fan topographical surfaces. Note that the deepest channel was on the H9 fan, the same fan which presented de highest lobe complex area, while H4 fan had the lowest lobe complex area and shallower channel than H9 fan. H10 fan had the shallowest channel and did not generate lobe complex.
Previous works (Jerolmack & Paola 2010Jerolmack D.J., & Paola C. 2010. Shredding of environmental signals by sediment transport. Geophysical Research Letters. 37(19):L19401., Hajek et al. 2010Hajek E.A., Heller P.L., Sheets B.A. 2010. Significance of channel-belt clustering in alluvial basins. Geology . 38(6):535-538., Wang et al. 2011Wang Y., Straub K.M., Hajek E.A. 2011. Scale-dependent compensational stacking: An estimate of autogenic time scales in channelized sedimentary deposits. Geology . 39(9):811-814., Straub &Wang 2013Straub K.M., & Wang Y. 2013. Influence of water and sediment supply on the long-term evolution of alluvial fans and delta: Statistical characterization of basin-filling sedimentation patterns. Journal of Geophysical Research. Earth Surface. 118(3):1602-1616.) focused on the influence of autogenic depositional controls, in terms of the resulting stratigraphic stacking created by a succession of various events. They inferred that autogenic signals can produce noise of sufficient intensity to destroy environmental signals (allogenic controls) of the depositional record. However, in the present experimental study, we demonstrate that a sedimentary system dominated by autogenic controls, with no oscillating boundary conditions during its duration, could build deposits with different geometrical dimensions, morphological features and depositional evolution. Thus, we interpret from our results that the autogenic controls created stochastic depositional results can be mistaken for the results generated by events in which allogenic controls (oscillating boundary conditions) dominate. This is observed both in architectural elements scale, evidenced by the high statistical variation of the lobe complexes, and in their depositional lobes dimensions (groups I and II), as in the depositional system scale, evidenced by the high RSD for the geometrical dimensions and topography of the simulated fans.
The significance of these variations was interpreted by extrapolating the geometrical differences presented by the simulated HDTC and LDTC fans to their respective modern analogous. For that, the difference between maximum and minimum simulated fan length and area of the two experimental series were applied to the length and area of their deep-water fan analogous. The difference between the maximum and minimum HDTC fans length (H9 fan and H2 fan) was 22% (approximately ¼), which in the Delgada Fan corresponds to 77 km. The maximum and minimum area (H5 fan and H6 fan) was 26%, representing 13 × 103 km2. In simulated LDTC fans, the difference between the maximum and minimum length (L5-L7 fans and L9 fan) was 7%, representing 21 km in Magdalena Fan. The maximum and minimum areas (L2-L9 fans and L3 fan) were 19% and represent 10 × 103 km2. Based on this extrapolation, differences in the order of tens of kilometres for the fan length and tens of thousands of kilometres for the fan area were observed in both modern analogues. It highlights the potential of the autogenic controls to influence the modern deep-water fans morphology.
Moreover, according to Prélat et al. (2010Prélat A., Covault J.A., Hodgson D.M., Fildani A., Flint S.S. 2010. Intrinsic controls on the range of volumes, morphologies, and dimensions of submarine lobes. SedimentaryGeology . 232(1-2):66-76.), depositional lobes dimensions are controlled by autogenesis, because their dimensions, particularly volume, are similar in the six deep-water fans studied, with different sediment supply characteristics. On the other hand, it was found that lobe dimensions had a large variation of their dimensions and shape, in terms of length, width and L/W ratio in systems with the same sediment supply characteristics, suggesting a dimension and shape stochastic behaviour of the depositional lobes.
CONCLUSIONS
This study led to the following conclusions:
-
Autogenic controls influenced a stochastic morphological behaviour of the simulated fans of the two experimental series, as well in depositional element scale. It is evidenced by the disparity between HDTC lobes dimensions (length, width and L/W ratio) and lobe complexes dimensions (length, width, L/W ratio, area and A factor). It is comparable to depositional system scale, as observed by the differences in the simulated HDTC fans dimensions (length, L/W ratio, centroid Y coordinate and area) and LDTC fans dimensions (width, L/W ratio, centroid Y coordinate and area). Therefore, from our experimental results, we conclude that the autogenic controls create stochastic depositional results which may be confused with results generated by systems in which allogenic controls (oscillating boundary conditions) dominate the depositional processes;
-
Sediment volumetric concentration influenced the characteristics of the simulated fans morphology. More concentrated flows (HDTC series - Cvol 15%) generated more elongated, widespread, longer and lower gradient fans than less concentrated flows (LDTC series - Cvol 5%). Also, simulated high-density turbidity currents generated more progradational and less aggradational depositional evolution than simulated low-density currents. The hypothesis of the suspension bulk volume to influence morphological characteristics does not support the differences presented between HDTC and LDTC fans. It is evidenced in the morphology and depositional evolution of LDTCEx fan (same bulk volume of HDTC fans), which had the same L/W ratio, smooth-circular shape and more aggradational depositional evolution fan than LDTC fans. The bulk volume of the suspension influenced the fan dimensions, so LDTCEx fan had higher length, width and area than LDTC fans;
-
Simulated HDTC fans showed satisfactory analogy with Delgada Fan (California borderland, USA) in terms of L/W ratio and sedimentological characteristics (dominated by HDTC). The simulated LDTC fans and LDTCEx fan presented similarities with Magdalena Fan (Caribbean Sea, Colombia). Depositional lobes of HDTC fans also presented shape similarities, in terms of L/W ratio averages, with lobes of several deep-water fans around the world. Therefore, the unreasonable effectiveness of the simulated fans reached a satisfactory degree, supporting the experimental results extrapolation to modern deep-water systems.
ACKNOWLEDGEMENTS
We thank Rogério Dornelles Maestri and Ana Luiza de Oliveira Borges for encouraging this study, the technical support of NECOD hydrology technicians (especially Cristian Schenk), Professor Léo Afraneo Hartmann for the support in the manuscript organization and English review, and the reviewers Paulo Paim and Giorgio Basilici for providing an increase in the scientific quality of this manuscript with their suggestions and comments. In addition, the first author thanks the Human Resources Program (PRH) of Petrobras S.A. for the financial support. Elírio E. Toldo Jr. and Rafael Manica acknowledge a scholarship from Conselho Nacional do Desenvolvimento Científico e Tecnológico, through the Brazilian government.
REFERENCES
- Alexander J., & Morris S. 1994. Observations on experimental, nonchannelized, high-concentration turbidity currents and variations in deposits around obstacles. Journal of Sedimentary Research 64(4): 899-909.
- Baas J.H., Kesteren W.V., Postma G. 2004. Deposits of depletive high-density turbidity currents: Aflume analogue of bed geometry, structure and texture. Sedimentology 51(5):1053-1088.
- Beerbower J.R. 1964. Cyclothems and cyclic depositional mechanism in alluvial plain sedimentation. Kansas Geological Survey, Bulletin 169:31-32.
- Castro C. 2016. Propriedades reológicas de misturas utilizadas em simulação física de correntes de turbidez MS Dissertation, Instituto de Pesquisas Hidráulicas, Universidade Federal do Rio Grande do Sul,Porto Alegre, 100 p.
- Catuneanu O., Abreu V., Bhattacharya J.P., Blum M.D., Dalrymple R.W., Eriksson P.G., Fielding C.R., Fisher W.L., Galloway W.E., Gibling M.R., Giles K.A., Holbrook J.M., Jordan R., Kendall C.G.S.C., Macurda B., Martinsen O.J., Miall A.D., Neal J.E., Nummedal D., Pomar L., Posamentier H.W., Pratt B.R., Sarg J.F., Shanley K.W., Steel R.J., Strasser A., Tucker M.E., Winker C. 2009.Towards the standardization of sequence stratigraphy. Earth-Science Reviews 92(1-2):1-33.
- Covault J.A., Normark W.R., Romans B.W., Graham S.A. 2007. Highstand fans in the California borderland: the overlooked deep-water depositional systems. Geology 35(9):783-786.
- Ercilla G., Alonso B., Estrada F., Chiocci F.L., Baraza J.S., Farran M. 2002. The Magdalena Turbidite System (Caribbean Sea): present-day morphology and architecture model. MarineGeology . 185(3-4):303-318.
- Guirro A.C. 2008. simulações físicas de correntes de turbidez: efeitos da variação do tamanho dos grãos e da vazão PhD Thesis, Instituto de Geociências, Universidade Federal do Rio Grande do Sul, Porto Alegre, 161 p.
- Hajek E.A., Heller P.L., Sheets B.A. 2010. Significance of channel-belt clustering in alluvial basins. Geology . 38(6):535-538.
- Hoyal D., Sheets B.A., Edwards C.M., Bloch R.B. 2008. Controls from channel formation in deep-water distributive systems. AAPG Search and Discovery. Article#50090.
- Jerolmack D.J., & Paola C. 2010. Shredding of environmental signals by sediment transport. Geophysical Research Letters 37(19):L19401.
- Johnson S.D., Flint S., Hinds D., Wickens H.V. 2001. Anatomy of basin floor to slope turbidite systems, Tanqua Karoo, South Africa: Sedimentology , sequence stratigraphy and implications for subsurface prediction. Sedimentology . 48:987-1023.
- Kolla V., & Buffler R.T. 1983. Morphologic, acoustic, and sedimentologic characteristics of the Magdalena Fan. Geo-Marine Letters 3(2-4):85-91.
- Kuenen P.H. 1950. Turbidity Currents of High Density. In:18th International Geologic Congress, London, Report, Part 8, p. 44-52.
- Kuenen P.H. 1951. Properties ofTurbidity Currents of High Density. Society of Economic Paleontologists and Mineralogists, Special Publication 2:14-33.
- Kuenen P.H. 1966. Matrix of turbidites: Experimental approach. Sedimentology . 7(4):267-297.
- Lowe D.R. 1982. Sediment gravity flows; II, Depositional models with special reference to the deposits of high-density turbidity currents. Journal of Sedimentary Res earch 52(1):279-298.
- Manica R. 2002. Modelagem física de correntes de densidade não conservativas em canal tridimensional de geometria simplificada MS Dissertation, Instituto de Pesquisas Hidráulicas, Universidade Federal do Rio Grande do Sul, Porto Alegre, 121 p.
- Manica R. 2009. Geração de correntes de turbidez de alta densidade: condicionantes hidráulicos e deposicionais PhD Thesis, Instituto de Pesquisas Hidráulicas, Universidade Federal do Rio Grande do Sul, Porto Alegre, 425 p.
- Manica R. 2012. Sediment Gravity Flows: Study based on experimental simulations. In: Harry E., Schulz E., Simões A.L.A., Lobosco R. J. Hydrodynamics -Natural Water Bodies, 1:263-286.
- Manica R., Maestri R.D., Borges A.L.O. 2006.Modelagem física de correntes de turbidez: descrição do processo e implicações no estudo dos depósitos turbidíticos. Pesquisas em Geociências33(2):19-33.
- Métivier F., Lajeunesse E., Cacas M.C. 2005.Submarine canyons in the bathtub. Journal of Sedimentary Res earch 75(1):6-11.
- Middleton G.V. 1967. Experiments on density and turbidity currents: III. Deposition of sediment. Canadian Journal of Earth Science 4(3):475-505.
- Middleton G.V., & Hampton M.A. 1973. Sediment gravity flows: mechanics of flow and deposition. In: Middleton G.V., & Bouma A.H. (eds.) Turbidity and Deep Water Sedimentation SEPM, Pacific Section, Short Course Lecture Notes, p. 1-38.
- Mulder T., & Alexander J. 2001. The physical character of subaqueous sedimentary density flows and their deposits. Sedimentology . 48(2):269-299.
- Mulder T., & Syvitski J.P.M. 1995. Turbidity currents generated at river mouths during exceptional discharges to the world oceans. The Journal ofGeology 103(3):285-299.
- Mulder T., Syvitski J.P.M., Migeon S., Faugères J-C., Savoye B. 2003. Marine hyperpycnal flows: Initiation, behavior and related deposits. A review. Marine and PetroleumGeology 20(6-8):861-882.
- Paola C., Straub K., Mohrig D., Reinhardt L. 2009. The “unreasonable effectiveness” of stratigraphic and geomorphic experiments. Earth-Science Reviews . 97(1-4):1-43.
- Parsons J.D., Schweller W.J., Stelting C.W., Southard J.B., Lyons W.J., Grotzinger J.P. 2002. A preliminary experimental study of turbidite fan deposits. Journal of Sedimentary Res earch 72(5):619-628.
- Piper D.J.W., & Aksu A.E. 1987. The Source and origin of the 1929 grand banks turbidity current inferred from sediment budgets. Geo-Marine Letters . 7(4):177-182.
- Prélat A., Covault J.A., Hodgson D.M., Fildani A., Flint S.S. 2010. Intrinsic controls on the range of volumes, morphologies, and dimensions of submarine lobes. SedimentaryGeology . 232(1-2):66-76.
- Prélat A., Hodgson D.M., Flint S.S. 2009. Evolution, architecture and hierarchy of distributary deep-water deposits: A high-resolution outcrop investigation from the Permian Karoo Basin, South Africa. Sedimentology . 56(7):2132-2154.
- Silva D.S., Puhl E., Maestri R.D., Viana A.R. 2012. Comportamento de fluxos sedimentares como agentes de formação de canais submarinos: uma visão através da modelagem física. In: 46ºCongresso Brasileiro de Geologia, Santos, Brasil.
- Somme T.O., Helland-Hansen W., Martinsen O.J., Thurmond J.B. 2009. Relationships between morphological and sedimentological parameters in source-to-sink systems: Abasis for predicting semi-quantitative characteristics in subsurface systems. Basin Research 21(4):361-387.
- Straub K.M., Paola C., Mohrig D., Wolinsky M.A., George T.2009. Compensational stacking of channelized sedimentary deposits. Journal of Sedimentary Res earch 79(9):673-688.
- Straub K.M., & Wang Y. 2013. Influence of water and sediment supply on the long-term evolution of alluvial fans and delta: Statistical characterization of basin-filling sedimentation patterns. Journal of Geophysical Research. Earth Surface 118(3):1602-1616.
- Talling P.J., Masson D.G., Sumner E.J., Malgesini G. 2012. Subaqueous sediment density flows: Depositional processes and deposit types. Sedimentology . 59(7):1937-2003.
- Wang Y., Straub K.M., Hajek E.A. 2011. Scale-dependent compensational stacking: An estimate of autogenic time scales in channelized sedimentary deposits. Geology . 39(9):811-814.
- Yu B., Cantelli A., Marr J., Pirmez C., O’Byrne C., Parker G. 2006. Experiments on self-channelized subaqueous fans emplaced by turbidity currents and dilute mudflows. Journal of Sedimentary Res earch 76(6):889-902.
Publication Dates
-
Publication in this collection
Jul-Sep 2017
History
-
Received
04 May 2017 -
Accepted
14 Aug 2017