
ABSTRACT
Soil moisture is a main factor for the study of drought impacts on vegetation. Drought is a regional phenomenon and affects the food security more than any other natural disaster. Currently, the monitoring of different types of drought is based on indexes that standardize in temporal and regional level allowing, thus, comparison of water conditions in different areas. Therefore, in order to assess the impact of soil moisture during periods of drought, drought Palmer Severity Index was estimated for the entire region of the territory. For this were used meteorological data (rainfall and evapotranspiration) and soil (field capacity, permanent wilting point and water storage in the soil). The data field capacity and wilting point were obtained from the physical properties of soil; while the water storage in soil was calculated considering the water balance model. The results of the PSDI were evaluated during the years 2000 to 2015, which correspond to periods with and without occurrence of drought. In order to assess the future drought projections, considering the set of the Coupled Model Intercomparison rainfall data Project Phase 5 (CMIP5). Climate projections precipitation in CMIP5 for the period 2071-2100 was extracted generating entitled forcing scenarios Representative Concentration Pathways - RCPs, and referred to as RCOP 8.5, corresponding to an approximate radiative forcing the end the twenty-first century of 8.5 Wm-2. The results showed that the PDSI is directly associated with climatological patterns of precipitation and soil moisture in any spatial and temporal scale (including future projections). Therefore, it is concluded that the PDSI is an important index to assess soil moisture different water conditions, as well as the association with economic and social information to create risk maps for subsidies to decision makers.
Keywords:
Soil moisture; Palmer Drought Severity Index; Future projections; Brazil
RESUMO
A umidade do solo constitui-se num dos fatores principais para o estudo da seca, do clima e da vegetação. No caso da seca, esta é um fenômeno regional e afeta a segurança alimentar mais do que qualquer outro desastre natural. Atualmente, o monitoramento dos diversos tipos de seca é feito com base em índices que os padronizam em escala temporal e regional permitindo, com isso, a comparação das condições hídricas de diferentes áreas. Assim sendo, a fim de avaliar o impacto da umidade do solo durante os períodos de seca, o Índice de Severidade de Seca de Palmer foi estimado para toda a região do território brasileiro durante o período de 2000 a 2015, os quais incluem períodos com ocorrência de seca. Para isto foram utilizadas informações meteorológicas e pedológicas extraídas do modelo de balanço hídrico. A fim de avaliar as projeções de secas futuras, considerando o conjunto de dados de precipitação e de umidade do solo do Coupled Model Intercomparison Project Phase 5 (CMIP5) para o período de 2071-2100. Os resultados mostraram que o Índice de Seca de Palmer está diretamente associado aos padrões climatológicos de precipitação e de umidade do solo, em qualquer escala espacial e temporal (incluindo as projeções futuras). Assim sendo, conclui-se que este índice constitui de uma ferramenta importante para avaliar a umidade do solo em diferentes condições hídricas, bem como para a associação com informações econômicas e sociais para gerar mapas de riscos para subsídios aos tomadores de decisão.
Palavras-chave:
Umidade do solo; Índice de Severidade de Seca de Palmer; Projeções futuras; Brasil
INTRODUCTION
Soil moisture constitutes one of the main factors for the study of drought and its impacts on vegetation. Soil moisture represents the water content in the soil. It can be calculated as the weight of water contained in a soil sample divided by the dry weight of the solid soil particles, expressed as a percentage. The term “drought” refers to dry weather of prolonged duration, where there is a water deficit in the soil. During drought, the water availability is below the usual soil moisture levels of a given geographical area; therefore, the water is inadequate to meet the needs of humans, animals and plants. Drought is a phenomenon of regional scale and affects food security, water and energy more than any other natural disaster; it represents a water imbalance generated by the absence of precipitation accompanied by dry air and high temperatures. The forecast of when drought will occur, as well as its duration is very difficult if compared to other disasters, such as floods (KESHAVARZ; VAZIFEDOUST; ALIZADEH, 2014KESHAVARZ, M. R.; VAZIFEDOUST, M.; ALIZADEH, M. A. Drought monitoring using a Soil Wetness Deficit Index (SWDI) derived from MODIS satellite data. Agricultural Water Management, v. 132, p. 37-45, 2014. http://dx.doi.org/10.1016/j.agwat.2013.10.004.
http://dx.doi.org/10.1016/j.agwat.2013.1...
; CARRÃO; NAUMANN; BARBOSA, 2016CARRÃO, H.; NAUMANN, G.; BARBOSA, P. Mapping global patterns of drought risk: an empirical framework based on sub-national estimates of hazard, exposure and vulnerability. Global Envrironmental Change-Human and Policy Dimensions, v. 39, p. 108-124, 2016. http://dx.doi.org/10.1016/j.gloenvcha.2016.04.012.
http://dx.doi.org/10.1016/j.gloenvcha.20...
). For this reason, the monitoring of various types of drought has been based on indices that standardize on temporal and spatial scales.
Thus, different indices are proposed for determining the degree of drought severity (e.g., Palmer Drought Severity Index, Effective Drought Index, Hydride Cultural Stress Index, Drought Index Bhalme & Mooley, Standardized Precipitation Index etc.) (PALMER, 1965PALMER, W. C. Meteorological drought. Research Paper, v. 45, p. 1-58, 1965.; ALLEY, 1984ALLEY, W.M. The Palmer drought severityindex: limitations and assumptions. Journal of Climate and Applied Meteorology, v. 23, p. 1100-1109, 1984.; GUTTMAN; WALLIS; HOSKING, 1992GUTTMAN, N. B.; WALLIS, J. R.; HOSKING, J. R. M. Spatial comparability of the Palmer Drought Severity Index. Water Resources Bulletin, v. 28, n. 6, p. 1111-1119, 1992. http://dx.doi.org/10.1111/j.1752-1688.1992.tb04022.x.
http://dx.doi.org/10.1111/j.1752-1688.19...
; SRIDHAR et al., 2008SRIDHAR, V.; HUBBARD, K. G.; YOU, J.; HUNT, E. D. Development of the soil moisture index to quantify agricultural drought and its “User Friendliness” in severity-area-duration assessment. Journal of Hydrometeorology, v. 9, n. 4, p. 660-676, 2008. http://dx.doi.org/10.1175/2007JHM892.1.
http://dx.doi.org/10.1175/2007JHM892.1...
; HOGG; BARR; BLACK, 2013HOGG, E. H.; BARR, A. G.; BLACK, T. A. A simple soil moisture index for representing multi-year drought impacts on aspen productivity in the western Canadian interior. Agricultural and Forest Meteorology, v. 178-179, p. 173-182, 2013. http://dx.doi.org/10.1016/j.agrformet.2013.04.025
http://dx.doi.org/10.1016/j.agrformet.20...
; KESHAVARZ; VAZIFEDOUST; ALIZADEH, 2014KESHAVARZ, M. R.; VAZIFEDOUST, M.; ALIZADEH, M. A. Drought monitoring using a Soil Wetness Deficit Index (SWDI) derived from MODIS satellite data. Agricultural Water Management, v. 132, p. 37-45, 2014. http://dx.doi.org/10.1016/j.agwat.2013.10.004.
http://dx.doi.org/10.1016/j.agwat.2013.1...
). According to Palmer (1968)PALMER, W. C. Keeping track of crop moisture conditions, nationwide: the new Crop Moisture Index. Weatherwise, v. 21, n. 4, p. 156-161, 1968. http://dx.doi.org/10.1080/00431672.1968.9932814.
http://dx.doi.org/10.1080/00431672.1968....
, for monitoring of drought, the Drought Severity Index, is calculated using as input all the terms of the water balance equation, including evapotranspiration, runoff, soil recharge and loss of moisture in the surface layer. In this context, use of a monthly scale to monitor the implications of agricultural drought presents an excessively long latency which may, therefore, result in a high deficit ETR (real evapotranspiration), and consequently in large agricultural losses. Therefore, this type of analysis requires a detailed time scale (10 days, for example) for its effects to be properly assessed so that control and mitigation measures can be adopted.
Sridhar et al. (2008)SRIDHAR, V.; HUBBARD, K. G.; YOU, J.; HUNT, E. D. Development of the soil moisture index to quantify agricultural drought and its “User Friendliness” in severity-area-duration assessment. Journal of Hydrometeorology, v. 9, n. 4, p. 660-676, 2008. http://dx.doi.org/10.1175/2007JHM892.1.
http://dx.doi.org/10.1175/2007JHM892.1...
evaluated the impact of soil moisture in the quantification of drought through the development of the Soil Moisture Index (SMI) obtained from observed and modeled soil moisture data for the Nebraska region. Observed data were used, collected from the network of automated data from the content of available water (obtained from the difference between the field capacity and the wilting point) for determination of this index. In addition, the SMI was also calculated using soil moisture information obtained from a hydrologic model to compare with the drought duration at several sites. The results showed that the influence of soil moisture undoubtedly is a quantitative indicator of drought.
Currently, the monitoring of different types of drought is based on indices which standardize on temporal and regional scales, thus allowing comparisons of water conditions in different areas. Such water quantifiers have been used in state and federal policies as parameters which assist decision-making regarding the adoption of plans to combat the implications of drought in various sectors of society. The Palmer Drought Severity Index (PDSI) and the Standardized Precipitation Index (SPI) are the world's best known and most frequently used quantifiers (WMO; GWP, 2016WMO - WORLD METEOROLOGICAL ORGANIZATION; GWP - GLOBAL WATER PARTNERSHIP. Handbook of drought indicators and indices: Integrated Drought Management Programme (IDMP). Geneva: WMO, 2016. Available from: <http://www.droughtmanagement.info/literature/GWP_Handbook_of_Drought_Indicators_and_Indices_2016.pdf>. Access on: 22 apr. 2016.). To support effective strategies for actions in agriculture, this study aims to assess the impact of soil moisture due to the drought indicator using the PDSI in Brazil for the years 2000 to 2015.
Rainfall, evapotranspiration and soil water storage data extracted from the database of the Weather Forecasting and Climate Studies Center of the National Institute for Space Research (Centro de Previsão de Tempo e Estudos Climáticos/Instituto Nacional de Pesquisas Espaciais - CPTEC/INPE), as describe at Doyle et al. (2013)DOYLE, M. E.; TOMASELLA, J.; RODRIGUEZ, D. A.; CHOU, S. C. Experiments using new initial soil moisture conditions and soil map in the Eta model over La Plata Basin. Meteorology and Atmospheric Physics, v. 121, n. 3, p. 119-136, 2013. http://dx.doi.org/10.1007/s00703-013-0265-5.
http://dx.doi.org/10.1007/s00703-013-026...
, were used to calculate the PDSI. The analysis of the soil moisture temporal series and the PDSI during the period of 2000-2015, serve as the basis for the assessment of the impacts caused by drought.
For quantification of drought, one of the most utilized and globally recognized indices is the PDSI, which considers that the total rainfall required to maintain an area in a given period is dependent on the weather conditions of the previous months and the current month.
In addition, the PDSI also can be used as input for analysis of future projections in order to assist decision makers in action plans for more effective strategies to enable farmers to survive drought without losing their livelihoods. Thus, considering different scenarios for future projections, the PDSI was estimated from the data of climate projections of precipitation and soil moisture of the Coupled Model Intercomparison Project Phase 5 (CMIP5, TAYLOR; STOUFFER; MEEHL, 2012TAYLOR, K. E.; STOUFFER, R. J.; MEEHL, G. A. An overview of CMIP5 and the experiment design. Bulletin of the American Meteorological Society, v. 93, n. 4, p. 485-498, 2012. http://dx.doi.org/10.1175/BAMS-D-11-00094.1.
http://dx.doi.org/10.1175/BAMS-D-11-0009...
), coming from IPCC AR5 (IPCC 2013IPCC - Intergovernmental Panel on Climate Change. Climate Change 2013: The Physical Science Basis. Cambridge: Cambridge University Press, 2013. 1535 p. Working Group I Contribution to the Fifth Assessment Report of the Intergovernmental Panel on Climate Change. http://dx.doi.org/10.1017/CBO9781107415324.
http://dx.doi.org/10.1017/CBO97811074153...
, 2014IPCC - Intergovernmental Panel on Climate Change. Summary for policymakers. In: IPCC - Intergovernmental Panel on Climate Change. Climate Change 2014: Mitigation of Climate Change. Cambridge: Cambridge University Press, 2014. p. 22. Working Group III Contribution to the Fifth Assessment Report of the Intergovernmental Panel on Climate Change.). The climate projections of precipitation and soil moisture of CMIP5 models for the period 2071-2100 for the scenario Representative Concentration Pathways - RCPs 8.5 corresponding to an approximate radiative forcing at the end of the 21st century of the 8.5 Wm-2 (MOSS et al., 2010MOSS, R. H.; EDMONDS, J. A.; HIBBARD, K. A.; MANNING, M. R.; ROSE, S. K.; VAN VUUREN, D. P.; CARTER, T. R.; EMORI, S.; KAINUMA, M.; KRAM, T.; MEEHL, G. A.; MITCHELL, J. F.; NAKICENOVIC, N.; RIAHI, K.; SMITH, S. J.; STOUFFER, R. J.; THOMSON, A. M.; WEYANT, J. P.; WILBANKS, T. J. The next generation of scenarios for climate change research and assessment. Nature, v. 463, n. 7282, p. 747-756, 2010. PMid:20148028. http://dx.doi.org/10.1038/nature08823.
http://dx.doi.org/10.1038/nature08823...
). The PDSI was obtained for models of CMIP5 in the monthly and annual scale for the long term (2071-2100) concerning to the climatology (1961-90). Analysis of the results predict the impacts of drought in several areas in order to avoid drastic reductions in the levels of the reservoirs, losses in agricultural crops, losses in production of electricity and in the economy caused by this type of natural disaster.
MATERIALS AND METHODS
Meteorological data
The weather information (precipitation, evapotranspiration, and water storage in the soil) considered in this study to determine the PDSI were drawn from the networks of the CPTEC/INPE data collection platform. The daily precipitation was obtained using the information observed in rain gauges, considering different data sources, and the 3B42 product from the Tropical Rainfall Measuring Mission satellite - TRMM (HUFFMAN; BOLVIN, 2011HUFFMAN, G. J.; BOLVIN, D. T. TRMM and other data precipitation data set documentation. Washington: NASA, 2011. 45 p. NASA GSFC Report. Available from: <https://precip.gsfc.nasa.gov/pub/trmmdocs/3B42_3B43_doc.pdf>. Access on: 6 nov. 2016.
https://precip.gsfc.nasa.gov/pub/trmmdoc...
). The observations were grouped according to the cells defined by the resolution of the TRMM data (0.25º x 0.25º). Incident global radiation, temperature and relative humidity, wind speed and pressure data were also used for the estimation of real and potential evapotranspiration daily using the Penman-Monteith model (ALLEN et al., 1998ALLEN, R. G.; PEREIRA, L. S.; RAES, D.; SMITH, M. Crop evapotranspiration: guidelines for computing crop water requirements. Rome: FAO, 1998. 300 p. (FAO Irrigation and Drainage Paper, 56). ).
The soil water storage data were obtained from the water balance model derived from the MUSA Project - Soil Moisture Monitoring in southeastern South America, information is detailed in (DOYLE et al., 2013DOYLE, M. E.; TOMASELLA, J.; RODRIGUEZ, D. A.; CHOU, S. C. Experiments using new initial soil moisture conditions and soil map in the Eta model over La Plata Basin. Meteorology and Atmospheric Physics, v. 121, n. 3, p. 119-136, 2013. http://dx.doi.org/10.1007/s00703-013-0265-5.
http://dx.doi.org/10.1007/s00703-013-026...
).
The estimates of water in the soil were carried out integrating the meteorological (described above) and soil information. The existing soil information is from EMBRAPA (Brazilian Agricultural Research Corporation - Empresa Brasileira de Pesquisa Agropecuária) soil surveys and Radam-Brazil, which include the depth of horizons, soil type, vegetation type, etc. Physical (texture, structure, etc.) and chemical (organic matter, macro and micro nutrients, carbon, etc.) analyses were performed for each horizon. To obtain water storage in soil pedo-transfer functions are used (TOMASELLA; HODNETT; ROSSATO, 2000TOMASELLA, J.; HODNETT, M.; ROSSATO, L. Pedo-transfer functions for soil water retention in brazilian soils. Soil Science Society of America Journal, v. 64, n. 1, p. 327-338, 2000. http://dx.doi.org/10.2136/sssaj2000.641327x.
http://dx.doi.org/10.2136/sssaj2000.6413...
; ROSSATO; ALVALA; TOMASELLA, 2004ROSSATO, L.; ALVALA, R. C. S.; TOMASELLA, J. Variação espaço-temporal da umidade do solo no Brasil: analise das condições médias para o período de 1971-1990. Revista Brasileira de Meteorologia, v. 19, n. 2, p. 113-122, 2004.; SOUZA et al., 2001SOUZA, S. S.; TOMASELLA, J.; GRACIA, M. G.; MENEZES, P. C. P.; AMORIN, M. C.; PINTO, C. A. M. O Programa de Monitoramento Climático em Tempo Real na área de atuação da SUDENE: PROCLIMA. Boletim da Revista Brasileira de Meteorologia, v. 25, n. 1, p. 15-24, 2001.).
Palmer Drought Severity Index (PDSI)
The PDSI introduced by Palmer (1965)PALMER, W. C. Meteorological drought. Research Paper, v. 45, p. 1-58, 1965. is calculated based on the parameters of water balance of Thornthwaite and Mather (1955)THORNTHWAITE, C. W.; MATHER, J. R. The water balance. New Jersey: Drexel Institute of Technology, 1955. 104 p.. The methodology considers that the soil is divided into two layers, a surface (Ss) and other sub-surface (Su). The value of the Ss layer is 25% of the available water capacity in soil (AWC) and the Su layer represents 75% of AWC. Thus, the Su layer will begin to lose water only when all water of Ss layer is lost.
To calculate the monthly water anomaly (d), Palmer proposed that the observed precipitation in a month (Pi) be compared to the expected (P) for the same period, ie:
which,
where ET is evapotranspiration, R is the ground water recharge, R0 is the runoff, L is the soil water loss and i is the ith month.
For d to become a standard index, comparable in different locations at any time, Palmer (1965)PALMER, W. C. Meteorological drought. Research Paper, v. 45, p. 1-58, 1965. developed a new climate characterization factor designated by the letter K, which is given by:
D is the monthly average of the absolute values of d.
Finally, from the product between the factor K and d have the Z-index from the water anomaly, which Palmer proposed the following equation:
Where,
Xi – value of the Palmer index of the month in question;
Xi-1 – value of the Palmer index of the previous month.
A detailed description of the PDSI methodology has been presented by Blain and Brunini (2007)BLAIN, G. C.; BRUNINI, O. Análise da escola temporal de monitoramento das secas agrícolas e meteorológicas no estado de São Paulo. Revista Brasileira de Meteorologia, v. 22, n. 2, p. 255-261, 2007. http://dx.doi.org/10.1590/S0102-77862007000200010.
http://dx.doi.org/10.1590/S0102-77862007...
.
Models of the CMIP5
In this study, we evaluated the future projections of PDSI using the global CMIP5 models. The horizontal resolutions of CMIP5 models vary around 1 to 3 degrees. However, for the purpose of intercomparison, all variables were interpolated to a common regular grid of 2.5° x 2.5° latitude/longitude using a bilinear interpolation. The CMIP5 set of models used in this study are the following: a) ACCESS 1.0; b) BCC -CSM1-1; c) CanMES; d) CNMR; e) CSIRO; f) EC-EARTH; g) FGOALS-g2; h) FIO-ESM; i) GFDL-CM3; j) GFDL-ESM2G; l) FDL-ESM2M; m) Giss-E2-R; n) HadGEM2-CC; o) INMCM4; p) IPSL-CM5A-LR; q) MIRI-ESM; r) MIROC-ESM; s) MIROC-ESM-CHEM and t) MRI-GCM3. More detailed information regarding the CMIP5 model is described in Torres (2014)TORRES, R. R. Análise de incertezas em projeções de mudanças climáticas na América do Sul. 2014. 271 f. Tese (doutorado em meteorologia)-Instituto Nacional de Pesquisas Espaciais, São José dos Campos, 2014..
As indicated in the methodology, the climate projections in CMIP5 are performed using the next generation of entitled forcing scenarios RCPs 2.6, 4.5, 6.0, and 8.5, which correspond to an approximate radiative forcing at the end of the 21st century of 2.6, 4.5, 6.0 and 8.5 Wm-2, respectively, relative to the pre-industrial conditions (MOSS et al., 2010MOSS, R. H.; EDMONDS, J. A.; HIBBARD, K. A.; MANNING, M. R.; ROSE, S. K.; VAN VUUREN, D. P.; CARTER, T. R.; EMORI, S.; KAINUMA, M.; KRAM, T.; MEEHL, G. A.; MITCHELL, J. F.; NAKICENOVIC, N.; RIAHI, K.; SMITH, S. J.; STOUFFER, R. J.; THOMSON, A. M.; WEYANT, J. P.; WILBANKS, T. J. The next generation of scenarios for climate change research and assessment. Nature, v. 463, n. 7282, p. 747-756, 2010. PMid:20148028. http://dx.doi.org/10.1038/nature08823.
http://dx.doi.org/10.1038/nature08823...
). Regarding the equivalent CO2 concentrations, the RCPs 2.6, 4.5, 6.0, and 8.5 roughly correspond to 490, 650, 850, and 1370 ppm, respectively, in 2100 (TORRES, 2014TORRES, R. R. Análise de incertezas em projeções de mudanças climáticas na América do Sul. 2014. 271 f. Tese (doutorado em meteorologia)-Instituto Nacional de Pesquisas Espaciais, São José dos Campos, 2014.). In this study, data from projections of future precipitation and soil moisture to the end of the century are detailed at Li, Robock and Wild (2007)LI, H.; ROBOCK, A.; WILD, M. Evaluation of IPCC AR4 Soil Moisture Simulations for the Second Half of the Twentieth Century. Journal of Geophysical Research, v. 112, p. D06106, 2007. http://dx.doi.org/10.1029/2006JD007455.
http://dx.doi.org/10.1029/2006JD007455...
and Marengo et al. (2009)MARENGO, J. A.; JONES, R.; ALVES, L. M.; VALVERDE, M. C. Future change of temperature and precipitation extremes in South America as derived from the PRECIS regional climate modeling system. International Journal of Climatology, v. 29, n. 15, p. 2241-2255, 2009. http://dx.doi.org/10.1002/joc.1863.
http://dx.doi.org/10.1002/joc.1863...
. In this study we use the RCP8.5.
RESULTS AND DISCUSSION
Studies confirm that the soil moisture response to precipitation is predominantly positive (ZHANG et al., 2004ZHANG, H.; MCGREGOR, J. L.; HENDERSON-SELLERS, A.; KATZFEY, J. J. Impacts of land surface model complexity on a regional simulation of a typical synoptic event. Journal of Hydrometeorology, v. 5, n. 1, p. 190-198, 2004. http://dx.doi.org/10.1175/1525-7541(2004)005<0180:IOLSMC>2.0.CO;2.
http://dx.doi.org/10.1175/1525-7541(2004...
; JONES; BRUNSELL, 2009JONES, A. R.; BRUNSELL, N. A. Energy balance partitioning and net radiation controls on soil moisture–precipitation feedbacks. Earth Interactions, v. 13, n. 2, p. 1-25, 2009. http://dx.doi.org/10.1175/2009EI270.1.
http://dx.doi.org/10.1175/2009EI270.1...
; ASHARAF; DOBLER; AHRENS, 2012ASHARAF, S.; DOBLER, A.; AHRENS, B. Soil moisture-precipitation feedback processes in the Indian summer monsoon season. Journal of Hydrometeorology, v. 13, n. 5, p. 1461-1474, 2012. http://dx.doi.org/10.1175/JHM-D-12-06.1.
http://dx.doi.org/10.1175/JHM-D-12-06.1...
). Therefore, soil moisture has a large influence on the natural and/or agricultural vegetation. It is through soil moisture monitoring that alerts for decision-makers regarding potential flooding and assessment of the severity of droughts are generated. However, direct measurements of soil moisture are relatively rare on a global scale, so that soil moisture typically is calculated based on models that utilize precipitation as initial conditions.
The temporal and spatial variability of rainfall are a striking feature of the climate of Brazil, in particular in the semi-arid region, where the temporal and spatial irregularity of rainfall is a relevant factor for the rainfed agriculture, which depends on soil moisture maintenance during the growing period (MARENGO et al., 2012MARENGO, J. A.; CHOU, S. C.; KAY, G; ALVES, L. M.; PESQUERO, J.; SOARES, W.; SANTOS, D. C.; LYRA, A. A.; SUEIRO, G.; BETTS, R.; CHAGAS, D. J.; GOMES, J. L.; BUSTAMANTE, J. F.; TAVARES, P. Development of regional future climate change scenarios in South America using the Eta CPTEC/HadCM3 climate change projections: climatology and regional analyses for the Amazon, São Francisco and the Parana River basins. Climate Dynamics, v. 23, n. 9, p. 1829-1848, 2012. http://dx.doi.org/10.1007/s00382-011-1155-5.
http://dx.doi.org/10.1007/s00382-011-115...
).
Figures 1 and 2 show the distribution of space-time observed rainfall (mm/day) and the estimated water storage in soil (mm) for the entire Brazilian territory during the period of 2000 to 2015. The results show that in the year 2003 and especially in 2012, the amounts of precipitation and moisture stored in the soil were lower than those observed in other years for the northeastern semi-arid region (NEB). The El Niño-Southern Oscillation (ENSO) was responsible for the rain and for the stored soil moisture that caused lower values than the historical average in the NEB during December of 2002 to April 2003.

Spatial-temporal distribution of the mean annual rainfall observed (mm/day) in Brazil during the period: a) 2000, b) 2001, c) 2002, d) 2003, e) 2004, f) 2006, g) 2007, h) 2008, i) 2009, j) 2010, k) 2011, l) 2012, m) 2013, n) 2014, o) 2015, p) 2016. Source: Doyle et al. (2013).

Spatial-temporal distribution of the soil water storage (mm) in Brazil during the period: a) 2000, b) 2001, c) 2002, d) 2003, e) 2004, f) 2006, g) 2007, h) 2008, i) 2009, j) 2010, k) 2011, l) 2012, m) 2013, n) 2014, o) 2015, p) 2016. Source: Rossato, Alvala and Tomasella (2004).
It should be noted that the NEB is a region vulnerable to drought with a long history of famine, migration and associated social problems (MARENGO et al., 2016MARENGO, J. A.; ARAGÃO, L. E. O. C.; COX, P. M.; BETTS, R.; COSTA, D.; KAYE, N.; SMITH, L. T.; ALVES, L. M.; REIS, V. Impacts of climate extremes in Brazil: the development of a web platform for understanding long-term sustainability of ecosystems and human health in Amazonia (PULSE-Brazil). Bulletin of the American Meteorological Society, v. 100, p. 1341-1346, 2016. http://dx.doi.org/10.1175/BAMS-D-14-00177.1.
http://dx.doi.org/10.1175/BAMS-D-14-0017...
). Currently this region presents a drought situation that began in 2012 and still persists in some areas with rainfall below the climatological average in the region. This drought can be considered as the worst of the last 30 years. From 2012 to 2015, the drought hit the NEB, especially the state of Bahia. In this state, about 230 municipalities were affected. The municipalities of Alagoas and Piauí also suffered from the lack of rain. The drought has brought much damage to the main sources of income in the region: livestock, and agricultural cultivation of corn and bean. The entire NEB had more than 1,400 affected municipalities (MARENGO et al., 2013a,MARENGO, J. A.; ALVES, L.; SOARES, W.; RODRIGUEZ, D.; CAMARGO, H.; RIVEROS, M. P.; PABLO, A. D. Two contrasting severe seasonal extremes in tropical South America in 2012: flood in Amazonia and drought in Northeast Brazil. Journal of Climate, v. 26, p. 9137-9154, 2013a. 2016; GUTIÉRREZ et al., 2014GUTIÉRREZ, A. P. A.; ENGLE, N. L.; NYS, E. D.; MOLEJÓN, C.; MARTINS, E. S. Drought preparedness in Brazil. Weather and Climate Extremes, v. 3, p. 95-106, 2014. http://dx.doi.org/10.1016/j.wace.2013.12.001.
http://dx.doi.org/10.1016/j.wace.2013.12...
). The El Nino of 2015 worsened the drought that had already been going on since 2012.
The drought that started in 2012 caused a devastating impact on agricultural, livestock and industrial productions. In April 2013, about 880,000 farmers had received assistance from the Federal Government through social support programs. According to the study by Gutiérrez et al. (2014)GUTIÉRREZ, A. P. A.; ENGLE, N. L.; NYS, E. D.; MOLEJÓN, C.; MARTINS, E. S. Drought preparedness in Brazil. Weather and Climate Extremes, v. 3, p. 95-106, 2014. http://dx.doi.org/10.1016/j.wace.2013.12.001.
http://dx.doi.org/10.1016/j.wace.2013.12...
, the drought has been attributed to the occurrence of two coupled atmospheric phenomena: (1) a slight increase in the sea surface temperature between 0.5°C and 1.5°C in the central region and the eastern equatorial Pacific ocean, indicating the presence of ENSO phenomenon; and (2) the conditions in the Atlantic also were not favorable to rain in the region.
This drought caused a new round of discussions to improve policy and management of drought at the state and federal levels. Thus, Gutiérrez et al. (2014)GUTIÉRREZ, A. P. A.; ENGLE, N. L.; NYS, E. D.; MOLEJÓN, C.; MARTINS, E. S. Drought preparedness in Brazil. Weather and Climate Extremes, v. 3, p. 95-106, 2014. http://dx.doi.org/10.1016/j.wace.2013.12.001.
http://dx.doi.org/10.1016/j.wace.2013.12...
presented a Brazilian case study, based on interviews with experts. From a documentary analysis, they found that although there is a rich drought management history in Brazil, there are gaps and short and long-term opportunities that decision-makers may consider, focusing on improvement in monitoring and forecasting with enhanced warning systems.
The results shown in Figure 2 indicate a decrease in water storage in the soil for the NEB, in 2003 as well as in 2012, 2013 and 2015, with the lowest levels of water values in the soil due to low index of precipitation.
Besides the NEB, it was observed that Brazil's Southeast region was affected by drought from 2014 to 2015, with areas of a wider range of low water storage in the soil in the north of Minas Gerais (Figure 1d).
On a global scale, Dorigo et al. (2015)DORIGO, W. A.; REIMER, C.; CHUNG, D.; PARINUSSA, R. M.; MELZER, T.; WAGNER, W.; DE JEU , R. A. M., KIDD, R. Soil Moisture. Bulletin of the American Meteorological Society, v. 96, n. 7, p. S28, 2015. Special Supplement. also evaluated soil moisture deviations from the climatological average of 1991-2012. The results show that the soil moisture conditions were within the climatological average, and in much of the globe, were related to the El Niño-Southern Oscillation (ENSO). In a global average scale, the El Niño tends to produce more dry soil conditions than normal than that observed during the 1997-1998 period, while La Niña tends to produce wetter conditions than usual, especially in the south hemisphere. In the NEB, the conditions of low soil moisture that persisted over the previous two years (2012-2013) saw some relief during 2014, as corroborated with the results shown in Figure 2o.
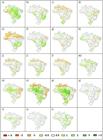
Figure 3 shows the average annual variation of PDSI during the period of 2000 to 2015 for the entire Brazilian territory. From these results, it was found that the PDSI reached drought indices of extremely dry classification (less than -3) in 3 distinct regions: Northeast, Amazon and Southeast).

Spatial-temporal distribution of Palmer Drought Severity Index (PDSI) in the Brazil during the period a) 2000, b) 2001, c) 2002, d) 2003, e) 2004, f) 2006, g) 2007, h) 2008, i) 2009, j) 2010, k) 2011, l) 2012, m) 2013, n) 2014, o) 2015, p) 2016.
The Amazon region has suffered severe weather anomalies over the last decade, sometimes with more dry years in sequence than normal, sometimes with prolonged periods of heavy rainfall. The drought years of 2003-2005 and 2010 are examples of such interannual variability. The high variability of precipitation in the region is related to variations in the position and intensity of the Intertropical Convergence Zone (ITCZ) over the Atlantic (MARENGO et al., 2008MARENGO, J. A.; NOBRE, C.; TOMASELLA, J.; OYAMA, M.; SAMPAIO DE OLIVEIRA, G.; DE OLIVEIRA, R.; CAMARGO, H.; ALVES, L. M.; BROWN, I. F. The drought of Amazonia in 2005. Journal of Climate, v. 21, n. 3, p. 495-516, 2008. http://dx.doi.org/10.1175/2007JCLI1600.1.
http://dx.doi.org/10.1175/2007JCLI1600.1...
, 2012MARENGO, J. A.; CHOU, S. C.; KAY, G; ALVES, L. M.; PESQUERO, J.; SOARES, W.; SANTOS, D. C.; LYRA, A. A.; SUEIRO, G.; BETTS, R.; CHAGAS, D. J.; GOMES, J. L.; BUSTAMANTE, J. F.; TAVARES, P. Development of regional future climate change scenarios in South America using the Eta CPTEC/HadCM3 climate change projections: climatology and regional analyses for the Amazon, São Francisco and the Parana River basins. Climate Dynamics, v. 23, n. 9, p. 1829-1848, 2012. http://dx.doi.org/10.1007/s00382-011-1155-5.
http://dx.doi.org/10.1007/s00382-011-115...
, 2013bMARENGO, J. A.; BORMA, L. S.; RODRIGUEZ, D. A.; PINHO, P.; SOARES, W. R.; ALVES, L. M. Recent extremes of drought and flooding in Amazonia: vulnerabilities and human adaptation. American Journal of Climate Change, v. 2, n. 2, p. 87-96, 2013b. http://dx.doi.org/10.4236/ajcc.2013.22009.
http://dx.doi.org/10.4236/ajcc.2013.2200...
) which is strongly modulated by the meridional gradient of sea surface temperature and also by temperature of equatorial Pacific. In 2015, the reduction in rainfall caused by El Niño phenomena contributed to the rapid fall in the river levels (MARENGO et al., 2016MARENGO, J. A.; ARAGÃO, L. E. O. C.; COX, P. M.; BETTS, R.; COSTA, D.; KAYE, N.; SMITH, L. T.; ALVES, L. M.; REIS, V. Impacts of climate extremes in Brazil: the development of a web platform for understanding long-term sustainability of ecosystems and human health in Amazonia (PULSE-Brazil). Bulletin of the American Meteorological Society, v. 100, p. 1341-1346, 2016. http://dx.doi.org/10.1175/BAMS-D-14-00177.1.
http://dx.doi.org/10.1175/BAMS-D-14-0017...
).
The current climate change projections are based exclusively on the use of climate models, such as the Global Circulation Models (GCMs). Thus, Torres (2014)TORRES, R. R. Análise de incertezas em projeções de mudanças climáticas na América do Sul. 2014. 271 f. Tese (doutorado em meteorologia)-Instituto Nacional de Pesquisas Espaciais, São José dos Campos, 2014. evaluated the uncertainties involved in projections of changes in temperature and rainfall in South America, generated by numerous GCMs belonging to CMIP3 and CMIP5 (Coupled Model Intercomparison Project Phase 3 and Phase 5, respectively) in order to identify how these uncertainties are distributed geographically and provide more reliable, synthetic, and probabilistic information. Seven different forcings scenarios were evaluated: SRES B1, A1B, and A2; and RCP 2.6, 4.5, 6.0, and 8.5. Special attention was given in the projections for 2071-2100 with the period 1961-1990. Simulations of GCM's of CMIP3 and CMIP5 proved to be able to well represent the basic climatological aspects observed from the analyzed variables such as seasonal average and annual cycle, although some biases are identified primarily on the Andes, northwestern South America, Amazon basin, and northeastern Brazil. However, the GCMs of CMIP5 presented the closest simulations of observations compared to CMIP3.
In other regions of Brazil, drought in the Northweast and Southeast since 2012 to 2015, (MARENGO et al., 2016MARENGO, J. A.; ARAGÃO, L. E. O. C.; COX, P. M.; BETTS, R.; COSTA, D.; KAYE, N.; SMITH, L. T.; ALVES, L. M.; REIS, V. Impacts of climate extremes in Brazil: the development of a web platform for understanding long-term sustainability of ecosystems and human health in Amazonia (PULSE-Brazil). Bulletin of the American Meteorological Society, v. 100, p. 1341-1346, 2016. http://dx.doi.org/10.1175/BAMS-D-14-00177.1.
http://dx.doi.org/10.1175/BAMS-D-14-0017...
; MARENGO; ALVES, 2016MARENGO, J. A.; ALVES, L. M. Crise hídrica em São Paulo em 2014: seca e desmatamento. Geousp – Espaço e Tempo, v. 19, n. 3, p. 485-494, 2016. http://dx.doi.org/10.11606/issn.2179-0892.geousp.2015.100879.
http://dx.doi.org/10.11606/issn.2179-089...
; NOBRE et al., 2016NOBRE, C.; MARENGO, J. A.; SELUCHI, M. E.; CUARTAS, A.; ALVES, L. M.; CAMARGO, H. The record drought and water crises of summer 2014 in Southeastern Brazil. Bulletin of the American Meteorogical Society, 2016. No prelo.) and in the Amazon 2005, 2010 and 2015 (MARENGO et al., 2008MARENGO, J. A.; NOBRE, C.; TOMASELLA, J.; OYAMA, M.; SAMPAIO DE OLIVEIRA, G.; DE OLIVEIRA, R.; CAMARGO, H.; ALVES, L. M.; BROWN, I. F. The drought of Amazonia in 2005. Journal of Climate, v. 21, n. 3, p. 495-516, 2008. http://dx.doi.org/10.1175/2007JCLI1600.1.
http://dx.doi.org/10.1175/2007JCLI1600.1...
; LEWIS et al., 2011LEWIS, S. L.; BRANDO, P. M.; PHILLIPS, O. L.; VAN DER HEIJDEN, M. F.; NEPSTAD, D. The 2010 Amazon drought. Science, v. 331, n. 6017, p. 554, 2011. PMid:21292971. http://dx.doi.org/10.1126/science.1200807.
http://dx.doi.org/10.1126/science.120080...
) was also important, with serious impacts on human and natural systems, specially 2012 year that showed extremes drought index (PDSI > -3, Figure 3m).
In southeastern Brazil, Reboita et al. (2015)REBOITA, M. S.; OLIVEIRA, D. M.; FREITAS, C. H.; OLIVEIRA, G. M.; PEREIRA, R. A. A. Anomalias dos padrões sinóticos da atmosfera na América do Sul nos meses de janeiros de 2014 e 2015. Revista Brasileira de Energias Renováveis, v. 4, p. 1-12, 2015., Nobre et al. (2016)NOBRE, C.; MARENGO, J. A.; SELUCHI, M. E.; CUARTAS, A.; ALVES, L. M.; CAMARGO, H. The record drought and water crises of summer 2014 in Southeastern Brazil. Bulletin of the American Meteorogical Society, 2016. No prelo. reported the occurrence of rainfall deficits in January for the years 2014 and 2015, which impacted the availability of water for human consumption, agriculture and for the production of hydroelectric power. The volume of water reservoirs began to reach their lowest levels on record. As an example, the volume of the Cantareira System reservoir which decreased from 76.10% in 2012 to 21.99% in 2014, reached a volume of only 4.68% in the year 2015. In this context, the authors found that in both years there was an atmospheric blocking during the summer on the south-eastern area of Brazil, resulting in positive anomalies of atmospheric pressure over southeastern Brazil and positive temperature anomalies of the sea surface near the south-east coast. These atmospheric characteristics disfavor the occurrence of precipitation in southeastern Brazil, blocking the moisture transport coming from the Amazon and from the cold fronts moving from the South, leaving the sky clear in the Southeast region with air temperatures above normal.
In the Southeast region, the severely dry classification (<-2) reached the north of Minas Gerais and São Paulo in 2014. In São Paulo, the areas of severe droughts were reduced in 2015, but continued covering the state of Minas Gerais; drought also reached severe levels in the Amazon in 2015, with PDSI values <-2.
It also was observed that the areas of occurrence of PDSI with severe and extreme intensities (ie PDSI values <-2 and <-3, respectively) increased in the years of 2014 and 2015 (Figure 3o, p). In 2015, the increase in areas with moderate to extreme drought intensity was observed in the southeastern and the northern regions of Brazil, due to the occurrence of reduced rainfall and consequently reduced soil moisture. In 2014, according to Munich Re (2015)MUNICH RE, TOPICS-GEO 2014: Naturkatastrophen 2014 Analysen, Bewertungen, Positionen. Munich: Munich Re, 2015. 67 p., the drought in southeastern Brazil was the fifth most important natural disaster in the world this year. The lack of rain and high temperatures led to drastic reductions in the levels of reservoirs and the desiccation of rivers. Huge losses were reported in the production of sugarcane and coffee and in the production of hydroelectric power, affecting approximately 27 million people. Economic losses resulting from this disaster (until January 2015) were estimated at US$5bn.
Other natural disasters in occurring in 2014 (floods in Rondonia and lack of rain in the Southeast) may be general meteorological phenomena associated with causes unrelated to global climate change. It is difficult to attribute the drought in the Southeast to climate change because drought is a short-term phenomenon and climate change is a long-term process. This type of study to determine the impact of climate change on drought in southeastern Brazil, has not yet been done and the weather causes are still objects of analysis. For example, in January and February of 2014 it should have rained a lot there, but it rained almost 80% less than the climatological average (MARENGO, 2014bMARENGO, J. A. O futuro clima do Brasil. Revista USP, n. 103, p. 25-32, 2014b., 2015MARENGO, J. A. A crise de agua do Sudeste do Brasil em 2014-15: extremos e risco climático. In: COLÓQUIO BRASILEIRO DE MATEMÁTICA, 30., Rio de Janeiro. Anais... Rio de Janeiro: IMPA, 2015. Vídeo. Available from: <http://strato.impa.br/videos/2015-coloquio/especial/coloquio_especial_28072015_jose_marengo.mp4>. Access on: 6 nov. 2016.
http://strato.impa.br/videos/2015-coloqu...
).
According to Costa (2015)COSTA, L. M. Crise hídrica: seca persiste em 2015 e seus efeitos se alastram pelo país. Revista SANEAR, v. 8, n. 26, p. 14-16, 2015., the most severe extended drought of the past 80 years, maintaining the effects of the dry season in most municipalities of Brazil, occurred in 2014. As a result, the first two months of 2015 already have 932 municipalities that are in a state of emergency due to drought or dry season per the Ministry of Integration data. Throughout the year 2014 the number of municipalities in the same condition was 1,265. Not even the beginning of the rainy season in the country was enough to reduce drought impacts, although the rainfall in February has helped to stabilize the level of some reservoirs.
As seen in Figure 3, the increase of the dry classification in the Southeast, from severe to extreme (<-2 to <-3), is due to the decrease of precipitation and water storage in soil (Figures 1 and 2) observed during the past 4 years (2012-2015). Dai, Trenberth and Qian (2004)DAI, A.; TRENBERTH, K. E.; QIAN, T. A global dataset of Palmer Drought Severity Index for 1870-2002: relationship with soil moisture and effects of surface warming. Journal of Hydrometeorology, v. 5, p. 1117-1130, 2004., from a study of a set of monthly global PDSI data during the period of 1870-2002, reviewed the correlation of soil moisture with PDSI and found that the PDSI was correlated significantly (R = 0.5 to 0.7) with soil moisture content observed within the top 1 m depth during the months of the hot season.
Based on considerations from the study mentioned above, the projection of the PDSI was calculated from the precipitation information generated by GCMs belonging to CMIP5 using the RCP 8.5 scenario forcing to the end of the century (2071-2100). The results show the spatial variability of precipitation for the different models of CMIP5. Among the set of models belonging to the CMIP5, the GISS model had higher distribution of rainfall in the Northeast.
In order to check the impact of the changes of the PDSI in certain regions of Brazil, 4 different areas of study were selected which are characteristic of humid and semi-arid regions: northern Amazon, Northeast Brazil (NEB), parts of South and Central -West of Brazil and southern Brazil (Figure 4).
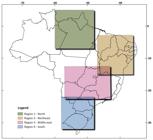
These regions were chosen because they present different anomalous climatic conditions during El Niño and La Niña events, as well as various anomalies in temperature and rainfall. In recent years, a significant decrease in rainfall has been observed in much of the North, Northeast and Southeast. Thus, for each study area the time series of PDSI from 2000-2015 and the projections for the end of the century (Figure 5) were generated.
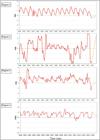
Time series of PDSI for the period 2000-2015 and the future projection (2100) obtained from 17 CMIP5 projection models using RCP 8.5 emissions over 4 different regions of studies in Brazil (Region 1 - North; Region 2 - Northeast, Region 3 - Midwest/Southeast; Region 4 - South).
The results indicate that the Northeast (Region 2) has averaged more intense levels of drought, reaching extreme values of -6 in 2012, when this region was severely affected by a drought event in its semi arid area. It is important to note that Region 2 also presents severe drought events for the future as indicated by the climatic forecast during the period 2071-2100. Future climate projections indicate risks of severe droughts in semiarid region, rainfall reductions up to 40% and increase of consecutive dry days. The results previously described are in accordance with Dai, Trenberth and Qian (2004)DAI, A.; TRENBERTH, K. E.; QIAN, T. A global dataset of Palmer Drought Severity Index for 1870-2002: relationship with soil moisture and effects of surface warming. Journal of Hydrometeorology, v. 5, p. 1117-1130, 2004., who also found that, since the late 1970´s, much of dry periods seem to be linked to episodes of ENSO.
For the Amazon (Region 1) has been observed a variability of PDSI classified into normal to extremely wet in the last 15 years. However, the projection of PDSI for this region tends to decrease and become a region with characteristics within the normal climatic conditions.
The Region 3 (area covered by the Central Brazil according to Figure 6) showed PDSI values ranging from 0 to 2 (normal to moderate). However, some extremes values were observed in 2001, when PDSI peaked -2 (moderately dry). In 2001, the water shortage in the reservoirs of hydroelectric power throughout the entire Region 3 caused intense blackouts (‘apagões’) over the majority of Brazilian population settled in the center of the country, and led to a prolonged electricity rationing. Another extreme PSDI event was observed in 2015, and this peak caused by occurrences of rainfall absences in the Southeast from 2013 until 2015 (Figure 1 n-p). Finally, for Region 4 (Southern region) it was observed a more constant variability of PDSI, ranging from normal to moderately moist.

PDSI correlation with rainfall (a) and soil moisture (b) for the entire Brazilian territory, considering the period 2000-2015.
Therefore, the impacts of these changes may affect directly about 7 million people who are linked to family farming in the NEB, and often found in extreme poverty (IBGE, 2006IBGE - INSTITUTO BRASILEIRO DE GEOGRAFIA E ESTATÍSTICA. Censo agropecuário. Rio de Janeiro, 2006. 775 p.; LINDOSO et al., 2011LINDOSO, D. P.; ROCHA, J. D.; DEBORTOLI, N.; PARENTE, I. C. I.; EIRÓ, F.; BURSZTYN, M.; RODRIGUES FILHO, S. Agricultura familiar e mudanças climáticas: avaliando a vulnerabilidade à seca no Semi-Árido Nordestino. In: MOTTA, R. S.; HARGRAVE, J.; LUEDEMANN, G.; GUTIERREZ, M. B. S. Mudança do clima no Brasil: aspectos econômicos, sociais e regulatórios. Brasília: IPEA, 2011. p. 277-300.).
In order to verify the variable with greatest impact in the drought index, this study also obtained the correlation of PDSI as a function of rainfall and soil moisture, as shown in Figure 6. From the spatial distribution of the correlation between PDSI and precipitation, a negative correlation in the Northeast and in some areas of northern Brazil is observed. For the correlation between PDSI and the soil moisture, it is observed that the results are highly correlated in almost all parts of Brazil. This correlation is explained by the fact that the physical properties of soil (percentage of sand, silt and clay) are not influenced by weather conditions (i.e. the soil does not change with time). Therefore, the results showed that the PDSI is more correlated with soil moisture than precipitation, corroborating studies by Dai, Trenberth and Qian et al. (2004).
According to the models of climate projections, extreme events (droughts/floods) should be more intense in the more distant future (2030 or 2040). However, extremes of more frequent and intense rains are already occurring in the last 50 to 60 years in various regions of the world, such as in Southeast South America, including Sao Paulo, Rio de Janeiro and Buenos Aires. Extremes of rainfall result in increases in natural disasters. These extreme rainfall events are a result of increased concentrations of greenhouse gases and urbanization. Where once there was the Atlantic Forest, there is now concrete. Moreover, often, rainfall is misplaced, as in São Paulo, occurring on the city, but not on the Cantareira region where rain is desirable (MARENGO, 2014aMARENGO, J. A. Escassez de água: cada gota é preciosa: falta de chuva evidencia insegurança hídrica no país. Senado analisa soluções. Em Discussão!: Os principais Debates do Senado Federal, v. 5, n. 23, p. 33, dez. 2014a.).
PDSI was estimated considering future projections of precipitation and soil moisture for the end of the century (2100) from different CMIP5 models. It is expected that the wet or dry classifications from PDSI also are directly linked to rainfall and soil moisture.
Figure 7 shows the PDSI projections for the end of the century (2071-2100) in RCP85 forcing scenario from the CMIP set. From the results, it is observed that the ACCESS, INMC and IPSL models showed larger areas with indexes above 1 (wet) in the greater part of Brazil. The other models showed minor changes rates below or above normal in some regions of Brazil.
Projection of the standard deviation of precipitation (mm/day) to the end of the century (2071-2100) in RCP85 forcing scenario from the set CMIP5: a) ACCESS, b) BCC, c) CanESM, d) CNMR, e) CSIRO, f) EC-EARTH, g) FGOALS, h) FIO-ESM, I) GFDL, j) GFDL-ESM, l) GFDL-ESM2M, m) GISS, n) HadGEM, o) INMC, p) IPSL, q) MIRI-ESM, r) MIROC, s) MIROC-ESM, t) MRI-GCM3.
In general, in relation to the future projection of the PDSI, the CMPI5 models showed drought indexes below -1, and other regions, above 1. This variability of PDSI standard ranging from dry and wet corresponds to the reduction and increased precipitation and the soil moisture, respectively, to the end of the century. However, as pointed out by SALES et al. (2015)SALES, D. C.; COSTA, A. A.; SILVA, E. M.; VASCONCELOS JÚNIOR, F. C.; CAVALCANTE, A. M. B.; MEDEIROS, S. S.; MARIN, A. M. P.; GUIMARÃES, S. O.; ARAÚJO JUNIOR, L. M.; PEREIRA, J. M. R. Projeções de mudanças na precipitação e temperatura no Nordeste Brasileiro utilizando a técnica de downscaling dinâmico. Revista Brasileira de Meteorologia, v. 30, n. 4, p. 297-308, 2015. http://dx.doi.org/10.1590/0102-778620140075.
http://dx.doi.org/10.1590/0102-778620140...
, there remains a divergence by the CMIP5 models with regard to precipitation, which should be the subject of study to try to understand the uncertainties related to this variable.
In the Northeast region of Brazil and Midwest regions of Brazil, while the CSIRO, CanMES, GFDL, INMC, IPSL, MIRI-ESM and MIROC models indicated projections of low rainfall in the Amazon. The reduction of precipitation for the projection at the end of the century noted for the Amazon was also observed in the Midwest region obtained by ACCESS, MIROC, MIROC-ESM and MRI-GCM3 models. Torres (2014)TORRES, R. R. Análise de incertezas em projeções de mudanças climáticas na América do Sul. 2014. 271 f. Tese (doutorado em meteorologia)-Instituto Nacional de Pesquisas Espaciais, São José dos Campos, 2014. found that the uncertainty of the models with respect to the precipitation changes is very high.
For the analysis of the risk of drought, Carrão, Naumann and Barbosa (2016)CARRÃO, H.; NAUMANN, G.; BARBOSA, P. Mapping global patterns of drought risk: an empirical framework based on sub-national estimates of hazard, exposure and vulnerability. Global Envrironmental Change-Human and Policy Dimensions, v. 39, p. 108-124, 2016. http://dx.doi.org/10.1016/j.gloenvcha.2016.04.012.
http://dx.doi.org/10.1016/j.gloenvcha.20...
developed a global map with the impact of the drought during the period of 2000-2014, which was based on the product of three independent factors: hazard, exposure and vulnerability. The results confirm the idea that the risk of drought is driven by an exponential growth of regional exposure; while the danger and vulnerability have a weaker relationship with the geographic distribution of risk values. The results also found that the risk of drought is lower for the dense vegetation regions (such as tundra and tropical forests) and higher for populated areas and regions widely exploited for agricultural and livestock production, such as South-Central Asia, Southeast South America, Central Europe and the Southeast US. Moreover, considering that the projections of climate change provide an increased frequency and intensity of drought for these regions, the study showed that there is a risk to global food security and a potential for civil conflict in the medium and long term. As most agricultural regions have high vulnerability of infrastructure to drought, the regional adaptation of climate change can start through the implementation and widespread use of irrigation and rainwater harvesting systems.
Whereas, in recent years, the Southeast region has shown high climate variability, increasing the percentage of areas affected by the severe and extreme droughts, the PDSI was analyzed - specifically for this region to check the impact on the spatial scale (Figure 8). The results showed that the impact of the drought that occurred in 2001 (which led to power rationing), reached up to 60% of areas in the Southeast. But the drought in recent years (2014 and 2015) showed peaks of up to approximately 80% of the areas affected by the drought.

Percentage of areas affected by drought in southeastern Brazil during the period 2000-2015.
Therefore, from the analysis of PDSI for area percentage of Southeast region (Figure 8), it was observed that in 2015 the area with extreme indexes of PDSI increased, as presented in Figure 3p.
The PDSI was also calculated only for the mesoregions of the Southeast region (Figure 9) for the year 2000-2015 and for the projection 2071-2100. The result (Figure 10) shows the impact of reduced precipitation in 2012-2015 presenting indexes of -2. The projection for 2071-2100 shows that this index may tend to normalize by the end of the century.
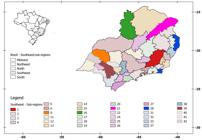

Time series of PDSI for the period of 2000-2015 and the future projection (2100) obtained from 17 CMIP5 projection models using RCP 8.5 emissions for mesoregions of Southeastern Brazil.
As noted by Marengo et al. (2013b)MARENGO, J. A.; BORMA, L. S.; RODRIGUEZ, D. A.; PINHO, P.; SOARES, W. R.; ALVES, L. M. Recent extremes of drought and flooding in Amazonia: vulnerabilities and human adaptation. American Journal of Climate Change, v. 2, n. 2, p. 87-96, 2013b. http://dx.doi.org/10.4236/ajcc.2013.22009.
http://dx.doi.org/10.4236/ajcc.2013.2200...
, the news labeled by the press and Brazilian government agencies in 2012 classified the floods in the Amazon and drought in northeastern Brazil as the most severe weather events in recent decades, and many districts in the Amazon and states in the Northeast of Brazil were declared natural disaster areas, especially in the flood plains of the Amazon and in the semi-arid lands of the Northeast. The most critical situation, however, is in the Northeast, where drought is a chronic problem.
In the scope of the National Plan for Risk Management and Disaster Response, the National Center for Monitoring and Alerts Natural Disaster (CEMADEN) became operational at on December 2, 2011, issuing alerts to the National Center for Risk Management and Disaster - CENAD throughout Brazil. The municipalities monitored by CEMADEN have a history of natural disasters records arising from landslides and floods. In addition, the Center assists preventive actions, identifying vulnerabilities in the use and occupation of land, with emphasis on urban planning and the installation of infrastructure.
The effects of drought have seriously depleted several reservoirs, reaching the dead volume in the Southeast (Belo Horizonte, Campinas and Recife, as well as in Rio de Janeiro and São Paulo); since 2012 CEMADEN provides reports of the current situation and a hydrological forecast for the Cantareira System.
According to a survey done by the newspaper O Globo, in 2015, the drought had spread throughout Brazil: 45.8 million people suffered from a lack of water, which means 20% of the country, based on information from watershed committees and state governments. In total, 936 municipalities throughout Brazil were in an emergency situation due to drought. This information confirms the results obtained from PDSI, increasing the areas of severe droughts in the region and reaching indices more intense in the last years (2014 and 2015) (O GLOBO, 2015O GLOBO. Seca afeta 46 milhões e crise é pior no Nordeste. Salvador: Correio, 2015. Available from: <http://www.correio24horas.com.br/detalhe/noticia/seca-afeta-46-milhoes-e-crise-e-pior-no-nordeste/?cHash=77472f02af270d76c841d9914a59683f>. Access on: 6 nov. 2016.
http://www.correio24horas.com.br/detalhe...
).
CONCLUSION
In this work, PDSI was used to estimate soil moisture to the layer of 1 m in Brazil during the period 2000 to 2015. This period included neutral years (with rainfall within normal standards) and years with extreme events (such as El Niño events). The results showed that the PDSI satisfactorily simulated the interannual variations, varying according to the climatic conditions of each region of the country. On a monthly basis, PDSI responds to decreased precipitation and soil water. This feature shows the PDSI recognizes the meteorological drought in different geographic locations, especially in the NEB. In this region where semiarid conditions prevail, the PDSI reached the severe to extreme dry scales over the entire analysis period. Thus, it was found that the PDSI can be applied to different regions of Brazil, considering the climatological patterns of precipitation and soil moisture.
For the analysis of future projections, the PDSI was estimated for 19 different RCP85 forcing scenarios from the CMIP set. According to the optimistic scenario (rainfall and soil moisture above the average), the ACCESS, INMC and IPSL models were those with larger areas with rates above normal for the wet (PDSI between 1 and 2) in a large part of Brazil. For regions with scenarios of reduced precipitation and soil moisture, it was found that the CSIRO, CanMES, GFDL, INMC, IPSL, MIRI-ESM and MIROC models indicated projections of low rainfall in the Amazon. For ACCESS, MIROC, MIROC-ESM and MRI-GCM3 models, a reduction in rainfall was observed in the Midwest. Among the analyzes of four different fields of study (Figure 4), it was observed that the North leaves the classification of a moist area and tends to normal water conditions. In region 2 (northeastern Brazil), drought classification tends to a moist condition. And for the regions 3 and 4 (Midwest + Southeast and South, respectively) that are characteristic of wet patterns, the trend is that by the end of the century water conditions are within the normal range. Therefore, the results show the PDSI capability in forecasting soil water conditions in different regions, from future projections. But when we analyzed only the Southeast there was an increased percentage of areas affected by severe to extreme drought due to high climate variability occurring in the region. However, the projection for 2071-2100 suggests that the index may tend to normalize by the end of the century.
Finally, it was concluded that the PDSI constitutes an important tool to evaluate soil moisture in moisture/flood conditions in different regions and periods. However, despite the apparent importance of these types of natural disasters, such extreme events have yet to be quantitatively related to various climatic, economic and social variables to enable creation of drought risk maps on monthly and/or daily scales. The generation of such maps becomes an essential component of risk management to provide support to decision makers. In addition, due to the impacts of droughts occurring during recent years and in future climate projections, there is a need to develop more effective strategic planning for the implementation and widespread use of irrigation and rainwater harvesting systems.
ACKNOWLEDGMENTS
The research leading to these results shown on this publication has received funding from the Rede-CLIMA, the National Institute of Science and Technology (INCT) for Climate Change funded by CNPq Grant Number 573797/2008-0 and FAPESP Grant Number 57719-9. JAM and LR were funded by CNPq. EMM was funded by CAPES 88887.091743/2014-01 Alerta-USP.
REFERENCES
- ALLEN, R. G.; PEREIRA, L. S.; RAES, D.; SMITH, M. Crop evapotranspiration: guidelines for computing crop water requirements. Rome: FAO, 1998. 300 p. (FAO Irrigation and Drainage Paper, 56).
- ALLEY, W.M. The Palmer drought severityindex: limitations and assumptions. Journal of Climate and Applied Meteorology, v. 23, p. 1100-1109, 1984.
- ASHARAF, S.; DOBLER, A.; AHRENS, B. Soil moisture-precipitation feedback processes in the Indian summer monsoon season. Journal of Hydrometeorology, v. 13, n. 5, p. 1461-1474, 2012. http://dx.doi.org/10.1175/JHM-D-12-06.1
» http://dx.doi.org/10.1175/JHM-D-12-06.1 - BLAIN, G. C.; BRUNINI, O. Análise da escola temporal de monitoramento das secas agrícolas e meteorológicas no estado de São Paulo. Revista Brasileira de Meteorologia, v. 22, n. 2, p. 255-261, 2007. http://dx.doi.org/10.1590/S0102-77862007000200010
» http://dx.doi.org/10.1590/S0102-77862007000200010 - CARRÃO, H.; NAUMANN, G.; BARBOSA, P. Mapping global patterns of drought risk: an empirical framework based on sub-national estimates of hazard, exposure and vulnerability. Global Envrironmental Change-Human and Policy Dimensions, v. 39, p. 108-124, 2016. http://dx.doi.org/10.1016/j.gloenvcha.2016.04.012
» http://dx.doi.org/10.1016/j.gloenvcha.2016.04.012 - COSTA, L. M. Crise hídrica: seca persiste em 2015 e seus efeitos se alastram pelo país. Revista SANEAR, v. 8, n. 26, p. 14-16, 2015.
- DAI, A.; TRENBERTH, K. E.; QIAN, T. A global dataset of Palmer Drought Severity Index for 1870-2002: relationship with soil moisture and effects of surface warming. Journal of Hydrometeorology, v. 5, p. 1117-1130, 2004.
- DORIGO, W. A.; REIMER, C.; CHUNG, D.; PARINUSSA, R. M.; MELZER, T.; WAGNER, W.; DE JEU , R. A. M., KIDD, R. Soil Moisture. Bulletin of the American Meteorological Society, v. 96, n. 7, p. S28, 2015. Special Supplement.
- DOYLE, M. E.; TOMASELLA, J.; RODRIGUEZ, D. A.; CHOU, S. C. Experiments using new initial soil moisture conditions and soil map in the Eta model over La Plata Basin. Meteorology and Atmospheric Physics, v. 121, n. 3, p. 119-136, 2013. http://dx.doi.org/10.1007/s00703-013-0265-5
» http://dx.doi.org/10.1007/s00703-013-0265-5 - GUTIÉRREZ, A. P. A.; ENGLE, N. L.; NYS, E. D.; MOLEJÓN, C.; MARTINS, E. S. Drought preparedness in Brazil. Weather and Climate Extremes, v. 3, p. 95-106, 2014. http://dx.doi.org/10.1016/j.wace.2013.12.001
» http://dx.doi.org/10.1016/j.wace.2013.12.001 - GUTTMAN, N. B.; WALLIS, J. R.; HOSKING, J. R. M. Spatial comparability of the Palmer Drought Severity Index. Water Resources Bulletin, v. 28, n. 6, p. 1111-1119, 1992. http://dx.doi.org/10.1111/j.1752-1688.1992.tb04022.x
» http://dx.doi.org/10.1111/j.1752-1688.1992.tb04022.x - HOGG, E. H.; BARR, A. G.; BLACK, T. A. A simple soil moisture index for representing multi-year drought impacts on aspen productivity in the western Canadian interior. Agricultural and Forest Meteorology, v. 178-179, p. 173-182, 2013. http://dx.doi.org/10.1016/j.agrformet.2013.04.025
» http://dx.doi.org/10.1016/j.agrformet.2013.04.025 - HUFFMAN, G. J.; BOLVIN, D. T. TRMM and other data precipitation data set documentation. Washington: NASA, 2011. 45 p. NASA GSFC Report. Available from: <https://precip.gsfc.nasa.gov/pub/trmmdocs/3B42_3B43_doc.pdf>. Access on: 6 nov. 2016.
» https://precip.gsfc.nasa.gov/pub/trmmdocs/3B42_3B43_doc.pdf - IBGE - INSTITUTO BRASILEIRO DE GEOGRAFIA E ESTATÍSTICA. Censo agropecuário. Rio de Janeiro, 2006. 775 p.
- IPCC - Intergovernmental Panel on Climate Change. Climate Change 2013: The Physical Science Basis. Cambridge: Cambridge University Press, 2013. 1535 p. Working Group I Contribution to the Fifth Assessment Report of the Intergovernmental Panel on Climate Change. http://dx.doi.org/10.1017/CBO9781107415324
» http://dx.doi.org/10.1017/CBO9781107415324 - IPCC - Intergovernmental Panel on Climate Change. Summary for policymakers. In: IPCC - Intergovernmental Panel on Climate Change. Climate Change 2014: Mitigation of Climate Change. Cambridge: Cambridge University Press, 2014. p. 22. Working Group III Contribution to the Fifth Assessment Report of the Intergovernmental Panel on Climate Change.
- JONES, A. R.; BRUNSELL, N. A. Energy balance partitioning and net radiation controls on soil moisture–precipitation feedbacks. Earth Interactions, v. 13, n. 2, p. 1-25, 2009. http://dx.doi.org/10.1175/2009EI270.1
» http://dx.doi.org/10.1175/2009EI270.1 - KESHAVARZ, M. R.; VAZIFEDOUST, M.; ALIZADEH, M. A. Drought monitoring using a Soil Wetness Deficit Index (SWDI) derived from MODIS satellite data. Agricultural Water Management, v. 132, p. 37-45, 2014. http://dx.doi.org/10.1016/j.agwat.2013.10.004
» http://dx.doi.org/10.1016/j.agwat.2013.10.004 - LEWIS, S. L.; BRANDO, P. M.; PHILLIPS, O. L.; VAN DER HEIJDEN, M. F.; NEPSTAD, D. The 2010 Amazon drought. Science, v. 331, n. 6017, p. 554, 2011. PMid:21292971. http://dx.doi.org/10.1126/science.1200807
» http://dx.doi.org/10.1126/science.1200807 - LI, H.; ROBOCK, A.; WILD, M. Evaluation of IPCC AR4 Soil Moisture Simulations for the Second Half of the Twentieth Century. Journal of Geophysical Research, v. 112, p. D06106, 2007. http://dx.doi.org/10.1029/2006JD007455
» http://dx.doi.org/10.1029/2006JD007455 - LINDOSO, D. P.; ROCHA, J. D.; DEBORTOLI, N.; PARENTE, I. C. I.; EIRÓ, F.; BURSZTYN, M.; RODRIGUES FILHO, S. Agricultura familiar e mudanças climáticas: avaliando a vulnerabilidade à seca no Semi-Árido Nordestino. In: MOTTA, R. S.; HARGRAVE, J.; LUEDEMANN, G.; GUTIERREZ, M. B. S. Mudança do clima no Brasil: aspectos econômicos, sociais e regulatórios. Brasília: IPEA, 2011. p. 277-300.
- MARENGO, J. A. Escassez de água: cada gota é preciosa: falta de chuva evidencia insegurança hídrica no país. Senado analisa soluções. Em Discussão!: Os principais Debates do Senado Federal, v. 5, n. 23, p. 33, dez. 2014a.
- MARENGO, J. A. O futuro clima do Brasil. Revista USP, n. 103, p. 25-32, 2014b.
- MARENGO, J. A. A crise de agua do Sudeste do Brasil em 2014-15: extremos e risco climático. In: COLÓQUIO BRASILEIRO DE MATEMÁTICA, 30., Rio de Janeiro. Anais... Rio de Janeiro: IMPA, 2015. Vídeo. Available from: <http://strato.impa.br/videos/2015-coloquio/especial/coloquio_especial_28072015_jose_marengo.mp4>. Access on: 6 nov. 2016.
» http://strato.impa.br/videos/2015-coloquio/especial/coloquio_especial_28072015_jose_marengo.mp4 - MARENGO, J. A.; ALVES, L. M. Crise hídrica em São Paulo em 2014: seca e desmatamento. Geousp – Espaço e Tempo, v. 19, n. 3, p. 485-494, 2016. http://dx.doi.org/10.11606/issn.2179-0892.geousp.2015.100879
» http://dx.doi.org/10.11606/issn.2179-0892.geousp.2015.100879 - MARENGO, J. A.; ALVES, L.; SOARES, W.; RODRIGUEZ, D.; CAMARGO, H.; RIVEROS, M. P.; PABLO, A. D. Two contrasting severe seasonal extremes in tropical South America in 2012: flood in Amazonia and drought in Northeast Brazil. Journal of Climate, v. 26, p. 9137-9154, 2013a.
- MARENGO, J. A.; BORMA, L. S.; RODRIGUEZ, D. A.; PINHO, P.; SOARES, W. R.; ALVES, L. M. Recent extremes of drought and flooding in Amazonia: vulnerabilities and human adaptation. American Journal of Climate Change, v. 2, n. 2, p. 87-96, 2013b. http://dx.doi.org/10.4236/ajcc.2013.22009
» http://dx.doi.org/10.4236/ajcc.2013.22009 - MARENGO, J. A.; ARAGÃO, L. E. O. C.; COX, P. M.; BETTS, R.; COSTA, D.; KAYE, N.; SMITH, L. T.; ALVES, L. M.; REIS, V. Impacts of climate extremes in Brazil: the development of a web platform for understanding long-term sustainability of ecosystems and human health in Amazonia (PULSE-Brazil). Bulletin of the American Meteorological Society, v. 100, p. 1341-1346, 2016. http://dx.doi.org/10.1175/BAMS-D-14-00177.1
» http://dx.doi.org/10.1175/BAMS-D-14-00177.1 - MARENGO, J. A.; CHOU, S. C.; KAY, G; ALVES, L. M.; PESQUERO, J.; SOARES, W.; SANTOS, D. C.; LYRA, A. A.; SUEIRO, G.; BETTS, R.; CHAGAS, D. J.; GOMES, J. L.; BUSTAMANTE, J. F.; TAVARES, P. Development of regional future climate change scenarios in South America using the Eta CPTEC/HadCM3 climate change projections: climatology and regional analyses for the Amazon, São Francisco and the Parana River basins. Climate Dynamics, v. 23, n. 9, p. 1829-1848, 2012. http://dx.doi.org/10.1007/s00382-011-1155-5
» http://dx.doi.org/10.1007/s00382-011-1155-5 - MARENGO, J. A.; JONES, R.; ALVES, L. M.; VALVERDE, M. C. Future change of temperature and precipitation extremes in South America as derived from the PRECIS regional climate modeling system. International Journal of Climatology, v. 29, n. 15, p. 2241-2255, 2009. http://dx.doi.org/10.1002/joc.1863
» http://dx.doi.org/10.1002/joc.1863 - MARENGO, J. A.; NOBRE, C.; TOMASELLA, J.; OYAMA, M.; SAMPAIO DE OLIVEIRA, G.; DE OLIVEIRA, R.; CAMARGO, H.; ALVES, L. M.; BROWN, I. F. The drought of Amazonia in 2005. Journal of Climate, v. 21, n. 3, p. 495-516, 2008. http://dx.doi.org/10.1175/2007JCLI1600.1
» http://dx.doi.org/10.1175/2007JCLI1600.1 - MOSS, R. H.; EDMONDS, J. A.; HIBBARD, K. A.; MANNING, M. R.; ROSE, S. K.; VAN VUUREN, D. P.; CARTER, T. R.; EMORI, S.; KAINUMA, M.; KRAM, T.; MEEHL, G. A.; MITCHELL, J. F.; NAKICENOVIC, N.; RIAHI, K.; SMITH, S. J.; STOUFFER, R. J.; THOMSON, A. M.; WEYANT, J. P.; WILBANKS, T. J. The next generation of scenarios for climate change research and assessment. Nature, v. 463, n. 7282, p. 747-756, 2010. PMid:20148028. http://dx.doi.org/10.1038/nature08823
» http://dx.doi.org/10.1038/nature08823 - MUNICH RE, TOPICS-GEO 2014: Naturkatastrophen 2014 Analysen, Bewertungen, Positionen. Munich: Munich Re, 2015. 67 p.
- NOBRE, C.; MARENGO, J. A.; SELUCHI, M. E.; CUARTAS, A.; ALVES, L. M.; CAMARGO, H. The record drought and water crises of summer 2014 in Southeastern Brazil. Bulletin of the American Meteorogical Society, 2016. No prelo.
- O GLOBO. Seca afeta 46 milhões e crise é pior no Nordeste. Salvador: Correio, 2015. Available from: <http://www.correio24horas.com.br/detalhe/noticia/seca-afeta-46-milhoes-e-crise-e-pior-no-nordeste/?cHash=77472f02af270d76c841d9914a59683f>. Access on: 6 nov. 2016.
» http://www.correio24horas.com.br/detalhe/noticia/seca-afeta-46-milhoes-e-crise-e-pior-no-nordeste/?cHash=77472f02af270d76c841d9914a59683f - PALMER, W. C. Meteorological drought. Research Paper, v. 45, p. 1-58, 1965.
- PALMER, W. C. Keeping track of crop moisture conditions, nationwide: the new Crop Moisture Index. Weatherwise, v. 21, n. 4, p. 156-161, 1968. http://dx.doi.org/10.1080/00431672.1968.9932814
» http://dx.doi.org/10.1080/00431672.1968.9932814 - REBOITA, M. S.; OLIVEIRA, D. M.; FREITAS, C. H.; OLIVEIRA, G. M.; PEREIRA, R. A. A. Anomalias dos padrões sinóticos da atmosfera na América do Sul nos meses de janeiros de 2014 e 2015. Revista Brasileira de Energias Renováveis, v. 4, p. 1-12, 2015.
- ROSSATO, L.; ALVALA, R. C. S.; TOMASELLA, J. Variação espaço-temporal da umidade do solo no Brasil: analise das condições médias para o período de 1971-1990. Revista Brasileira de Meteorologia, v. 19, n. 2, p. 113-122, 2004.
- SALES, D. C.; COSTA, A. A.; SILVA, E. M.; VASCONCELOS JÚNIOR, F. C.; CAVALCANTE, A. M. B.; MEDEIROS, S. S.; MARIN, A. M. P.; GUIMARÃES, S. O.; ARAÚJO JUNIOR, L. M.; PEREIRA, J. M. R. Projeções de mudanças na precipitação e temperatura no Nordeste Brasileiro utilizando a técnica de downscaling dinâmico. Revista Brasileira de Meteorologia, v. 30, n. 4, p. 297-308, 2015. http://dx.doi.org/10.1590/0102-778620140075
» http://dx.doi.org/10.1590/0102-778620140075 - SOUZA, S. S.; TOMASELLA, J.; GRACIA, M. G.; MENEZES, P. C. P.; AMORIN, M. C.; PINTO, C. A. M. O Programa de Monitoramento Climático em Tempo Real na área de atuação da SUDENE: PROCLIMA. Boletim da Revista Brasileira de Meteorologia, v. 25, n. 1, p. 15-24, 2001.
- SRIDHAR, V.; HUBBARD, K. G.; YOU, J.; HUNT, E. D. Development of the soil moisture index to quantify agricultural drought and its “User Friendliness” in severity-area-duration assessment. Journal of Hydrometeorology, v. 9, n. 4, p. 660-676, 2008. http://dx.doi.org/10.1175/2007JHM892.1
» http://dx.doi.org/10.1175/2007JHM892.1 - TAYLOR, K. E.; STOUFFER, R. J.; MEEHL, G. A. An overview of CMIP5 and the experiment design. Bulletin of the American Meteorological Society, v. 93, n. 4, p. 485-498, 2012. http://dx.doi.org/10.1175/BAMS-D-11-00094.1
» http://dx.doi.org/10.1175/BAMS-D-11-00094.1 - THORNTHWAITE, C. W.; MATHER, J. R. The water balance. New Jersey: Drexel Institute of Technology, 1955. 104 p.
- TOMASELLA, J.; HODNETT, M.; ROSSATO, L. Pedo-transfer functions for soil water retention in brazilian soils. Soil Science Society of America Journal, v. 64, n. 1, p. 327-338, 2000. http://dx.doi.org/10.2136/sssaj2000.641327x
» http://dx.doi.org/10.2136/sssaj2000.641327x - TORRES, R. R. Análise de incertezas em projeções de mudanças climáticas na América do Sul. 2014. 271 f. Tese (doutorado em meteorologia)-Instituto Nacional de Pesquisas Espaciais, São José dos Campos, 2014.
- WMO - WORLD METEOROLOGICAL ORGANIZATION; GWP - GLOBAL WATER PARTNERSHIP. Handbook of drought indicators and indices: Integrated Drought Management Programme (IDMP). Geneva: WMO, 2016. Available from: <http://www.droughtmanagement.info/literature/GWP_Handbook_of_Drought_Indicators_and_Indices_2016.pdf>. Access on: 22 apr. 2016.
- ZHANG, H.; MCGREGOR, J. L.; HENDERSON-SELLERS, A.; KATZFEY, J. J. Impacts of land surface model complexity on a regional simulation of a typical synoptic event. Journal of Hydrometeorology, v. 5, n. 1, p. 190-198, 2004. http://dx.doi.org/10.1175/1525-7541(2004)005<0180:IOLSMC>2.0.CO;2
» http://dx.doi.org/10.1175/1525-7541(2004)005<0180:IOLSMC>2.0.CO;2
Publication Dates
-
Publication in this collection
2017
History
-
Received
03 Nov 2016 -
Reviewed
03 Mar 2017 -
Accepted
11 Apr 2017


