ABSTRACT
Envelope curves are important tools for preliminary evaluation of design floods, for sizing hydraulic structures and for checking the design peak discharge in old dams, to verify their hydrological safety. These curves, associated with a mathematical equation, determine the upper line that involves the maximum values of the floods associated with the respective basin areas. Envelope curves can be global or regional; maybe relative to maximum recorded floods or certain return periods. This paper presents a review of the various envelope curves developed in the world and, in addition, applies them to the hydrological conditions of the watersheds in Ceará. Three envelope curves widely used in the literature were tested. Based on the estimation of new regional parameters for Ceará, envelope curves for floods with Tr equal to 1.000 and 10.000 years were constructed for the State. For developing the envelope curves, 43 hydrological dams’ projects, designed by hydrological techniques adopted by state water resources institutions, were investigated.
Keywords:
Envelope curves; Peak discharges; Francou-Rodier; Creager; Castellarin; Dam safety
RESUMO
As curvas envoltórias constituem-se em ferramentas de grande importância para o dimensionamento expedito de cheias de projetos de estruturas hidráulicas, assim como parâmetro de checagem da cheia de projeto de vertedores de barragens já construídas, para a verificação de sua segurança hidrológica. As envoltórias são curvas, associadas a uma equação matemática, que determinam a linha superior que envolve os valores máximos das cheias associados às respectivas áreas das bacias hidrográficas. As envoltórias podem ser, quanto ao espaço, de âmbito mundial ou regional; e quanto a cheias, podem ser relativas aos máximos observados ou a determinados períodos de retorno. Este artigo apresenta uma revisão de diversas envoltórias desenvolvidas no mundo e, adicionalmente, aplica-as às condições hidrológicas de bacias hidrográficas do Ceará. Foram testadas três curvas envoltórias amplamente utilizadas na literatura. A partir da estimativa de novos parâmetros regionais para o Ceará, são construídas envoltórias de cheias milenares e decamilenares para o Estado. Para a construção das envoltórias foram pesquisados 43 projetos hidrológicos de barragens dimensionadas por modernas técnicas hidrológicas, adotadas pelas instituições de recursos hídricos estaduais.
Palavras-chave:
Curvas envoltórias; Cheias máximas; Francou-Rodier; Creager; Castellarin; Segurança de barragens
INTRODUCTION
The Brazilian Policy for Dam Safety (PNSB), established by Law 12.334/2010 (BRASIL, 2010BRASIL. Lei nº 12.334, de 20 de setembro de 2010. Estabelece a Política Nacional de segurança de barragens. Diário Oficial [da] República Federativa do Brasil, Brasília, DF. Disponível em: <http://www.planalto.gov.br/ccivil_03/_Ato2007-2010/2010/Lei/L12334.htm>. Acesso em: 15 nov. 2016.
http://www.planalto.gov.br/ccivil_03/_At...
), has as one of its main goals to ensure the observance of dam safety standards to reduce the possibility of accidents and their consequences. The Law defines some tools, as the ‘Dam Safety Plan’ (Article 6, II) stands out and has an obligatory implementation to assist the management of dam safety.
This Plan provides a ‘Periodic Review of Dam Safety’, which has the purposes a periodic review, by the entrepreneur, of the safety and operation of the dam, analysis of hydraulic and hydrological characteristics for the structural stability and operational suitability of the various facilities, according to design criteria and available information available at the time of each review. Its goals are not merely to verify the general state of the dam and design criteria, but to propose corrective and improvement actions, to reduce any risks presented by the structure.
Regarding hydrological aspects, these risks may be high for some dams, especially the older ones. In Ceará, for example, it is estimated that there are around 30,000 dams (MENESCAL et al., 2004MENESCAL, R.; MIRANDA, A.; PITOMBEIRA, E. As barragens e as enchentes. In: SIMPÓSIO BRASILEIRO DE DESASTRES NATURAIS, 1., 2004, Florianópolis. Anais... Florianópolis: UFSC, 2004.), which were designed and constructed more than half a century ago, using data and following criteria presented at that time. This situation could represent potential threats to the lives and properties of downstream populations.
In this context, it is observed the great utility of the flood envelope curves, which graphically synthesize the available knowledge about the specific maximum flows in each region (COELHO FILHO et al., 2011COELHO FILHO, J. A. P.; NAGHETTINI, M.; PINTO, E. J. A. Curvas Envoltórias probabilísticas para a estimação de cheias de projeto. Revista Brasileira de Recursos Hídricos, v. 16, n. 1, p. 83-96, 2011. http://dx.doi.org/10.21168/rbrh.v16n1.p83-96.
http://dx.doi.org/10.21168/rbrh.v16n1.p8...
).
These curves have been widely used in various regions of the world. This paper tests the applicability of classic envelopes curves to the hydrological conditions of Ceará. In addition, 1,000- and 10,000-year return period floods are developed specifically for the watersheds of Ceará.
Furthermore, these curves can be used for dam safety assessment, by doing the verification of design floods of older spillways located in basins of similar characteristics. They also can be used to do an expedited estimation of maximum flows for new basins. In both cases, these curves act as a reference value for maximum flows.
ENVELOPE CURVES
Jarvis (1925)JARVIS, C. S. Flood flow characteristics. Transactions of the American Society of Civil Engineers, v. 88, p. 985-1032, 1925. was a pioneer in the determination of envelopes curves when formulating the maximum flood envelope curve for the United States from the analysis of 888 fluviometric stations. Later, Crippen and Bue (1977)CRIPPEN, J. R.; BUE, C. D. Maximum flood flows in the conterminous. Washington: USGPO, 1977. (Geological Survey Water Supply Paper 1887). and Crippen (1982)CRIPPEN, J. R. Envelope curves for extreme flood events. Journal of the Hydraulics Division, v. 108, n. 10, p. 1208-1212, 1982. improved these curves by using data for the creation of other 17 curves and analyzing a total of 883 stations. Decades later, Vogel et al. (2001)VOGEL, R. M.; ZAFIRAKOU-KOULOURIS, A.; MATALAS, N. C. Frequency of record-breaking floods in the United States. Water Resources Research, v. 37, n. 6, p. 1723-1731, 2001. http://dx.doi.org/10.1029/2001WR900019.
http://dx.doi.org/10.1029/2001WR900019...
found out that the curves obtained by these authors were still valid for 740 monitoring stations from 1988 to 1994.
Creager et al. (1945)CREAGER, W. P.; JUSTIN, J. D.; HINDS, J. Engineering for dams. New York: John Wiley and Sons, 1945. (General Design, 1). formulated another mathematical equation for the calculation of the envelope curves. This equation was obtained based on data from 760 stations, including 730 located in the United States and some others located in different countries. Since then, this equation, better known as ‘Creager’, has been widely used in many parts of the world (KADOYA, 1992KADOYA, M. Study on record flood peaks in Japan. Proceedings of the Japan Academy, Series B, v. 68, n. 8, p. 133-138, 1992.; OHNISHI et al., 2004OHNISHI, R.; KATO, T.; IMAIZUMI, M.; TANJI, H. A study to determine an equation of curve for regional flood peaks by maximum rainfall data. Paddy Water Environment, v. 2, n. 2, p. 83-90, 2004. http://dx.doi.org/10.1007/s10333-004-0043-6.
http://dx.doi.org/10.1007/s10333-004-004...
).
Francou and Rodier (1967)FRANCOU, J.; RODIER, J. A. Essai de classification des crues maximales observes dans le monde. Cahiers ORSTOM, Série Hydrologie, v. 4, n. 3, p. 19-46, 1967. also developed an equation, widely used in several countries.
Enzel et al. (1993)ENZEL, Y.; ELY, L. L.; HOUSE, P. K.; BAKER, V. R.; WEBB, R. H. Paleoflood evidence for a natural upper bound to flood magnitudes in the Colorado river basin. Water Resources Research, v. 29, n. 7, p. 2287-2297, 1993. http://dx.doi.org/10.1029/93WR00411.
http://dx.doi.org/10.1029/93WR00411...
used Paleohydrology tools to estimate the maximum flows of rivers in Arizona and Utah over hundreds and thousands of years. Even with the increase in the observation period, the flows found did not exceed the maximum value of the discharges estimated by the curves generated from the historical data effectively measured for those basins. This fact, according to the authors, would confirm the hypothesis of the existence of a maximum physical value for floods.
Castellarin et al. (2005)CASTELLARIN, A.; VOGEL, R. M.; MATALAS, N. C. Probabilistic behavior of a regional envelope curve. Water Resources Research, v. 41, n. 6, 1-13, 2005. proposed a new methodology for the calculation of these curves, which was later improved by Castellarin (2007)CASTELLARIN, A. Probabilistic envelope curves for design flood estimation at ungauged sites. Water Resources Research, v. 43, n. 4, p. 1-12, 2007.. The authors, besides creating a new type of curve, proposed the calculation of the probability of equality or exceedance for the maximum event values.
Several other studies have evaluated the envelope curves as an estimator of maximum floods. Biondić et al. (2007)BIONDIĆ, D.; BARBALIĆ, D.; PETRAŠ, J. Creager’s and Francou-Rodier’s envelopes of extreme floods in the Danube river basin in Croatia. In: KICK-OFF WORKSHOP ON IAHS DECADE OF PREDICTION IN UNGAUGED BASINS, 2007, Brasilia. Anais… Brasília: IAHS Press, 2007. p. 221-228. analyzed the maximum flows of the Danube River in Croatia and compared the results using Creager et al. (1945)CREAGER, W. P.; JUSTIN, J. D.; HINDS, J. Engineering for dams. New York: John Wiley and Sons, 1945. (General Design, 1). and Francou and Rodier (1967)FRANCOU, J.; RODIER, J. A. Essai de classification des crues maximales observes dans le monde. Cahiers ORSTOM, Série Hydrologie, v. 4, n. 3, p. 19-46, 1967. methodologies. They found the first methodology as the one with higher values, except for very small or very large basins. Campos-Aranda (2011)CAMPOS-ARANDA, D. F. Estimación de envolventes de diseño por subregiones hidrológicas. Tecnología y Ciencias del Agua, v. 2, n. 4, p. 175-194. 2011. made a similar analysis in Mexico, using the two methodologies mentioned as well as the Lowry’s methodology, which was presented by Ramírez-Orozco et al. (2005)RAMÍREZ-OROZCO, A. I.; GÓMEZ-MARTÍNEZ, J. F.; CAMPOS-ARANDA, D. F. Actualización de las envolventes regionales de gastos máximos para la república mexicana. Tecnología y Ciencias del Agua, v. 20, n. 1, p. 99-108, 2005.. He concluded that the applicability of the curves is a function of the basin size.
In the same country, Ramírez-Orozco et al. (2005)RAMÍREZ-OROZCO, A. I.; GÓMEZ-MARTÍNEZ, J. F.; CAMPOS-ARANDA, D. F. Actualización de las envolventes regionales de gastos máximos para la república mexicana. Tecnología y Ciencias del Agua, v. 20, n. 1, p. 99-108, 2005. have done some comparative studies among of Creager’s et al. (1945)CREAGER, W. P.; JUSTIN, J. D.; HINDS, J. Engineering for dams. New York: John Wiley and Sons, 1945. (General Design, 1)., Lowry’s (RAMÍREZ-OROZCO; GÓMEZ-MARTÍNEZ; CAMPOS-ARANDA, 2005RAMÍREZ-OROZCO, A. I.; GÓMEZ-MARTÍNEZ, J. F.; CAMPOS-ARANDA, D. F. Actualización de las envolventes regionales de gastos máximos para la república mexicana. Tecnología y Ciencias del Agua, v. 20, n. 1, p. 99-108, 2005.) and Matthai’s (1969)MATTHAI, H. F. Floods of June 1965 in South Platte River basin, Colorado. Washington: USGPO, 1969., Crippen’s (1982)CRIPPEN, J. R. Envelope curves for extreme flood events. Journal of the Hydraulics Division, v. 108, n. 10, p. 1208-1212, 1982. and Francou and Rodier’s (1967)FRANCOU, J.; RODIER, J. A. Essai de classification des crues maximales observes dans le monde. Cahiers ORSTOM, Série Hydrologie, v. 4, n. 3, p. 19-46, 1967. methodologies to determine the curves for the 37 hydrological regions, as well as the 13 administrative regions of Mexico. The data used were obtained from 628 stations with series of rains until the year 2000.
In Turkey, Bayazit and Önöz (2004)BAYAZIT, M.; ÖNÖZ, B. Envelope curves for maximum floods in Turkey. Teknik Dergi, v. 15, n. 1, p. 3125-3130, 2004. used data from a study conducted by the DSI (State Hydraulic Work Administration) to obtain eight envelope curves applicable to the estimation of maximum floods in the country and compared their results with the ones developed in China and the United States. A similar study was conducted by Pegram and Parak (2004)PEGRAM, G.; PARAK, M. A review of the regional maximum flood and rational formula using geomorphological information and observed floods. Water S.A., v. 30, n. 3, p. 377-392, 2004. http://dx.doi.org/10.4314/wsa.v30i3.5087.
http://dx.doi.org/10.4314/wsa.v30i3.5087...
in South Africa. In Germany, Guse et al. (2010)GUSE, B.; HOFHERR, T.; MERZ, B. Introducing empirical and probabilistic regional envelope curves into a mixed bounded distribution function. Hydrology and Earth System Sciences, v. 14, n. 12, p. 2465-2478, 2010. http://dx.doi.org/10.5194/hess-14-2465-2010.
http://dx.doi.org/10.5194/hess-14-2465-2...
used the same methodology as well as the knowledge of the GEV (Generalized Extreme Value) probability distribution to obtain Maximum values of floods. In Pakistan, Ahsan et al. (2016)AHSAN, H.; MABI, G.; BOOTA, M. W.; ABBAS, T. Development of envelope curve for Indus and Jhelum River basin in Pakistan and estimation of upper bound using envelope curve. Journal of Himalayan Earth Sciences, v. 49, n. 1, p. 98-109, 2016. applied the envelope curves for the Indus and Jhelum rivers, proving the applicability of this methodology as a tool for estimating and comparing parameters for those values found in the Danube River.
In Brazil, it is emphasized the contribution of Sousa and Pinto (2001)SOUSA, L. N.; PINTO, N. L. S. Segurança ao galgamento de barragens do Nordeste. In: SEMINÁRIO NACIONAL DE GRANDES BARRAGENS, 24., 2001, Fortaleza. Anais... Fortaleza: CBDB, 2001. p. 693-699., who applied Francou and Rodier’s curve (1967) for floods of 23 reservoirs in the State of Ceará. Coelho Filho et al. (2011)COELHO FILHO, J. A. P.; NAGHETTINI, M.; PINTO, E. J. A. Curvas Envoltórias probabilísticas para a estimação de cheias de projeto. Revista Brasileira de Recursos Hídricos, v. 16, n. 1, p. 83-96, 2011. http://dx.doi.org/10.21168/rbrh.v16n1.p83-96.
http://dx.doi.org/10.21168/rbrh.v16n1.p8...
used envelope curves to determine the maximum floods and their probabilities of exceedance in unmonitored basins in the state of Minas Gerais, applying the methodology of Castellarin et al. (2005)CASTELLARIN, A.; VOGEL, R. M.; MATALAS, N. C. Probabilistic behavior of a regional envelope curve. Water Resources Research, v. 41, n. 6, 1-13, 2005. and Castellarin (2007)CASTELLARIN, A. Probabilistic envelope curves for design flood estimation at ungauged sites. Water Resources Research, v. 43, n. 4, p. 1-12, 2007.. Recently, Marcellini et al. (2015)MARCELLINI, S. S.; LIMA, G.; NEILL, C. R. Curvas envoltórias de Creager e as vazões de cheia no Brasil: análise comparativa. In: SIMPÓSIO BRASILEIRO DE RECURSOS HÍDRICOS: SEGURANÇA HÍDRICA E DESENVOLVIMENTO SUSTENTÁVEL: DESAFIOS DO CONHECIMENTO E DA GESTÃO, 21., 2015, Brasília. Anais... Porto Alegre: ABRH, 2015. p. 1-7. used series of floods recorded in the main hydrographic basins in Brazil from 1931 to 2012, collected in 131 stations, to estimate the curves developed by Creager et al. (1945)CREAGER, W. P.; JUSTIN, J. D.; HINDS, J. Engineering for dams. New York: John Wiley and Sons, 1945. (General Design, 1)..
The envelope curve equations
The following are the most used envelope curves: Creager, Francou-Rodier, Castellarin, Lowry, Matthai e Crippen.
Creager’s curve
Creager’s curve (CREAGER et al., 1945CREAGER, W. P.; JUSTIN, J. D.; HINDS, J. Engineering for dams. New York: John Wiley and Sons, 1945. (General Design, 1).) is frequently used in hydrologic evaluations (RAMÍREZ-OROZCO et al., 2005RAMÍREZ-OROZCO, A. I.; GÓMEZ-MARTÍNEZ, J. F.; CAMPOS-ARANDA, D. F. Actualización de las envolventes regionales de gastos máximos para la república mexicana. Tecnología y Ciencias del Agua, v. 20, n. 1, p. 99-108, 2005.). This curve is obtained by Equation 1.
where:
q is the maximum flow rate in m3/s, Cc is the Creager’s regional coefficient and A the drainage area.
The proposed values for the regional coefficients (Cc) vary from 100 (MIJARES, 1992MIJARES, F. J. A. Fundamentos de hidrologia de superfície. México: Grupo Noriega Editores, 1992.) to 200 (CREAGER et al., 1945CREAGER, W. P.; JUSTIN, J. D.; HINDS, J. Engineering for dams. New York: John Wiley and Sons, 1945. (General Design, 1).).
Francou-Rodier’s curve
The envelope of Francou and Rodier (1967)FRANCOU, J.; RODIER, J. A. Essai de classification des crues maximales observes dans le monde. Cahiers ORSTOM, Série Hydrologie, v. 4, n. 3, p. 19-46, 1967. is commonly used in Europe and Africa (RAMÍREZ-OROZCO et al., 2005RAMÍREZ-OROZCO, A. I.; GÓMEZ-MARTÍNEZ, J. F.; CAMPOS-ARANDA, D. F. Actualización de las envolventes regionales de gastos máximos para la república mexicana. Tecnología y Ciencias del Agua, v. 20, n. 1, p. 99-108, 2005.) and can be expressed according to Equation 2.
where:
Q is the maximum flow rate in m3/s, = 106 m3/s, A the drainage area in km2, = 108 km2 and k the Francou-Rodier’s regional coefficient, expressed by:
According to Sousa and Pinto (2001)SOUSA, L. N.; PINTO, N. L. S. Segurança ao galgamento de barragens do Nordeste. In: SEMINÁRIO NACIONAL DE GRANDES BARRAGENS, 24., 2001, Fortaleza. Anais... Fortaleza: CBDB, 2001. p. 693-699., Francou-Rodier’s coefficient varies from 0 to 6, being in Brazil commonly used the value of 4.8. According to Papp (2001)PAPP, F. The extremeness of extreme: extraordinary floods. Wallingford: IAHS Publication, 2001. p. 375-378. (IAHS Publication, 271). values from 6 to 7 are found for events considered extreme on a global scale.
Castellarin’s curve
The curve proposed by Castellarin et al. (2005)CASTELLARIN, A.; VOGEL, R. M.; MATALAS, N. C. Probabilistic behavior of a regional envelope curve. Water Resources Research, v. 41, n. 6, 1-13, 2005. is represented by Equation 4.
where:
is the maximum flow rate for a given fluviometric station (in m3/s), a and b are regional constants of the regression and A the drainage area.
The regional constants a and b are obtained by assuming the homogeneity of the studied region, regarding the flood-index method. The value of a is given by Equation 5:
where:
is the maximum flow rate observed on site j (among M fluviometric stations in the homogeneous region) and the drainage area.
The value of b is obtained by calculating the flood-index (DALRYMPLE, 1960DALRYMPLE, T. Flood-frequency analyses. In Manual of hydrology: flood-flow techniques. Washington: USGPO, 1960. Part. 3.), given by Equation 6.
where:
A is the drainage area, b and C are constants, with b equals to the angular coefficient of Equation 4.
Lowry’s curve
This type of envelope curve is widely used in Latin America (RAMÍREZ-OROZCO et al., 2005RAMÍREZ-OROZCO, A. I.; GÓMEZ-MARTÍNEZ, J. F.; CAMPOS-ARANDA, D. F. Actualización de las envolventes regionales de gastos máximos para la república mexicana. Tecnología y Ciencias del Agua, v. 20, n. 1, p. 99-108, 2005.) and, according to Mijares (1992)MIJARES, F. J. A. Fundamentos de hidrologia de superfície. México: Grupo Noriega Editores, 1992., it is also one of the most used in México. It is obtained by Equation 7:
where:
q is the maximum flow rate, is the Lowry’s regional coefficient and A the drainage area.
According to Mijares (1992)MIJARES, F. J. A. Fundamentos de hidrologia de superfície. México: Grupo Noriega Editores, 1992., the Lowry’s coefficient value used in the entire world is 3,500.
Matthai’s curve
Matthai (1969)MATTHAI, H. F. Floods of June 1965 in South Platte River basin, Colorado. Washington: USGPO, 1969. used only a basic envelope equation, which relates the drainage areas to the maximum flow rate (Equation 8):
where:
q is the maximum flow rate, A is the drainage area and α and β regional parameters
Crippen’s curve
The methodology proposed by Crippen (1982)CRIPPEN, J. R. Envelope curves for extreme flood events. Journal of the Hydraulics Division, v. 108, n. 10, p. 1208-1212, 1982. is based on the curve given by Equation 9:
where:
q is the maximum flow rate, A the drainage area and the regional coefficients empirically determined.
MATERIALS AND METHODS
Used data
For the construction of the envelope curves, 43 hydrological projects from dams located in Ceará were used. The dams analyzed were built in the 1990s, funded by the Urban Development and Water Resources Management Program (PROURB) and the Water Resources Management and Integration Program (PROGERIRH). The financial resources came from the World Bank and these programs had the main goal of filling the so-called “water voids” of the state of Ceará.
Unlike the previous projects, those carried out in that period began to adopt the SCS unit and maximum rainfall estimated methods from a probability distribution. These projects were all evaluated by the Dams Safety Panel, created by the State Water Resources Secretariat and formed by a group of renowned experts in the areas of Hydrology, Hydraulics and Geotechnics, which would guarantee its quality.
For this report, the chapters referring to the hydrological studies of each dam project were consulted, from where the values of the drainage areas and affluent maximum flow rates were obtained. The floods considered for this study were those from the 1,000- and 10,000-year return period.
The standard methodology applied in the determination of the floods for these projects consists of: (1) statistical study of the intense rains and (2) determination of the affluent hydrograph produced by the 1,000 and 10,000-year return period rains, associated with the synthetic hyetograph of the alternate blocks. This methodology, described in Campos (2009)CAMPOS, J.N.B. Lições em modelos e simulação hidrológica. Fortaleza: ASTEF/EXPRESSÃO GRÁFICA, 2009., is still practiced in the State of Ceará, in projects of the Water Resources Secretariat.
It should be noted that the application of rainfall-runoff models, with rains of a given period of return (Tr) do not necessarily generate a flow of the same return period. However, the methodology applied in Ceará and in other parts of the world, starts from the premise that the hyetograph of alternate blocks does not produce floods with Tr lower than the Tr of precipitation. The quest for a synthetic hyetograph that turns a thousand-year-old rain into a millennial flood is still a challenge for researchers in hydrology.
All the data of the reservoirs used are summarized in Table 1 (name, location, drainage area, 1,000- and 10,000-year return period flow rates). It is observed the absence of the maximum flow rate in some reservoirs for a given Tr. Thus, the analyses referring to the 1,000- and 10,000-year return period floods are based on 41 and 36 reservoirs, respectively.
Selected reservoirs in the State of Ceará and their respective drainage areas and 1,000-year and 10,000-year return periods affluent flow rates.
The selected reservoirs have areas ranging from 41.38 km2 to 44,800.00 km2 (Castanhão). It is also observed that, for Tr = 1,000 years the design discharges vary from 64.50 m3/s (Catu dam) to 11,182.00 m3/s (Castanhão dam). Similarly, for Tr = 10,000-year return period for the tributary flow rates vary from 381,78 m3/s (João Guerra dam) to 17,350.00 m3/s (Castanhão dam).
The curves’ quantiles
In general, the envelope curves are developed from historical records of floods observed at fluviometric stations, synthesizing the available knowledge regarding maximum flows per unit area at that station. In this case, depending on the length of the series used, the envelope curves may have their upper limits exceeded. According to Enzel et al. (1993)ENZEL, Y.; ELY, L. L.; HOUSE, P. K.; BAKER, V. R.; WEBB, R. H. Paleoflood evidence for a natural upper bound to flood magnitudes in the Colorado river basin. Water Resources Research, v. 29, n. 7, p. 2287-2297, 1993. http://dx.doi.org/10.1029/93WR00411.
http://dx.doi.org/10.1029/93WR00411...
, this maximum value, with the increasing increase of the area and the observed period, tends to stabilize.
Determining the probability of exceedance to the envelope curves is a complex task and one of the goals by Castellarin et al. (2005)CASTELLARIN, A.; VOGEL, R. M.; MATALAS, N. C. Probabilistic behavior of a regional envelope curve. Water Resources Research, v. 41, n. 6, 1-13, 2005. and Castellarin (2007)CASTELLARIN, A. Probabilistic envelope curves for design flood estimation at ungauged sites. Water Resources Research, v. 43, n. 4, p. 1-12, 2007.. Sousa and Pinto (2001)SOUSA, L. N.; PINTO, N. L. S. Segurança ao galgamento de barragens do Nordeste. In: SEMINÁRIO NACIONAL DE GRANDES BARRAGENS, 24., 2001, Fortaleza. Anais... Fortaleza: CBDB, 2001. p. 693-699. and Coelho Filho et al. (2011)COELHO FILHO, J. A. P.; NAGHETTINI, M.; PINTO, E. J. A. Curvas Envoltórias probabilísticas para a estimação de cheias de projeto. Revista Brasileira de Recursos Hídricos, v. 16, n. 1, p. 83-96, 2011. http://dx.doi.org/10.21168/rbrh.v16n1.p83-96.
http://dx.doi.org/10.21168/rbrh.v16n1.p8...
came up with the regional envelope curves associated with return periods for the state of Ceará and the upper São Francisco river basin in the state of Minas Gerais. The present paper is developed in the same research line. Envelope curves are built associated with 1,000- and 10,000-year return period, Tr adopted for dam projects in Ceará, from the 1990s.
Envelope curve selection
The three envelope curves most frequently applied in the literature - Creager, Francou-Rodier and Castellarin - were selected and applied in this study. These curves have different calculation methodologies and take into account different parameters.
Regional coefficients
The application of the envelope curves methodology takes into account regional coefficients. For the Creager’s and Francou-Rodier’s, the literature points out some values. For the Castellarin’s there are no pre-established values, since the determination of these values is an intrinsic step in the application of this methodology.
Once these are regional coefficients, some of these values may not present satisfactory results for Ceará. Thus, the application of the curves in this study has as an initial step the verification of the validity for some regional coefficients proposed in the literature. In the case of non-conformity, new values are determined for them.
Comparative analysis of the selected envelope curves
A comparative analysis of the methodologies employed is carried out in order to obtain the one that presents the best results. This analysis, besides identifying the curve that best fits the state, allows us to know the relationship as well as the intervals of applicability for the three types of curves used.
RESULTS AND DISCUSSION
The three envelope curves - Creager, Francou-Rodier and Castellarin - were applied to data from 43 reservoirs located in the state of Ceará.
Creager’s curve
The Creager’s curve can be obtained from Equation 4, which relates parameters of maximum flow rates to the drainage areas and some coefficients, that vary according to the region under analysis. The results obtained in the study for 1,000- and 10,000-years return period flow rates are shown below.
Application of regional coefficients (Cc) proposed in the literature
The regional coefficients (Cc) values suggested in the literature - 100 and 200 - were used to calculate the flood by Creager’s for a return period of 1,000 and 10,000 years.
Figure 1 shows the curves obtained for the Creager type, using the regional coefficient 100 and 200 for maximum floods with Tr = 1,000 years. It is observed that the cloud of points, corresponding to the Ceará reservoirs, presents some clearance in relation to the envelope curves. This suggests that these coefficients, although widely found in the literature, are not the most adequate for Ceará, and overestimate the project flood values.

Creager’s curve for 1,000-year return period flow rates and regional coefficients equal to 100 and 200.
The Figure 2 presents, in an analogous way, the analysis of these regional coefficients for the floods in reservoirs in Ceará for Tr = 10,000 years. It is observed that the coefficient equals to 100 can’t be used for the construction of the envelope curve for a return period of 10,000 years in this state, since there is a point above the curve. Similarly, for the same coefficient equals to 200, it is still observed a clearance between the curve and the plotted points, which shows an overestimation for the maximum flood values. This also suggests that the regional coefficient values Ceará is an amount between 100 and 200, if considered 10,000-year return period floods.

Creager’s curve for 10,000-year return period flow rates and regional coefficients equal to 100 and 200.
Determination of regional coefficients (Cc) for the State of Ceará
The new regional coefficient values (Cc) for Ceará are obtained through the direct application of the curve equation, replacing the project flow rate values and drainage areas of areas each reservoir.
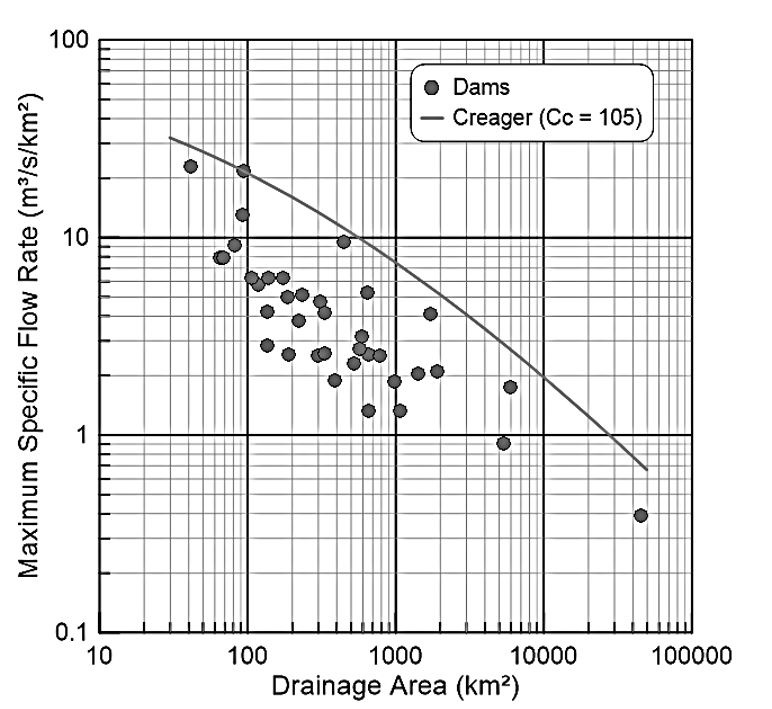
Table 2 presents all the results obtained for this analysis. It is observed that the coefficients found ranged from 4.0 to 68.6 for the 1,000-year return period floods and from 14.9 to 104.8 for 10,000-year return period floods. Therefore, to better adjust the curve these values were increased obtaining then the coefficient Cc equals to 69 (Tr = 1,000 years) and 105 (Tr = 10,000 years) (Figures 3 and 4).
Regional coefficient values for Creager’s (Cc), Francou-Rodier’s (k) and Castellarin’s (a) envelope curves.

Creager’s curve for 1,000-year return period flow rates and regional coefficient equal to 69.

Creager’s curve for 10,000-year return period flow rates and regional coefficient equal to 105.
Francou-Rodier’s curve
The Francou-Rodier’s curve is given by Equation 2, which relates the maximum flood values, Francou-Rodier’s regional coefficient and drainage areas under study.
Application of the regional coefficient (k) proposed in the literature
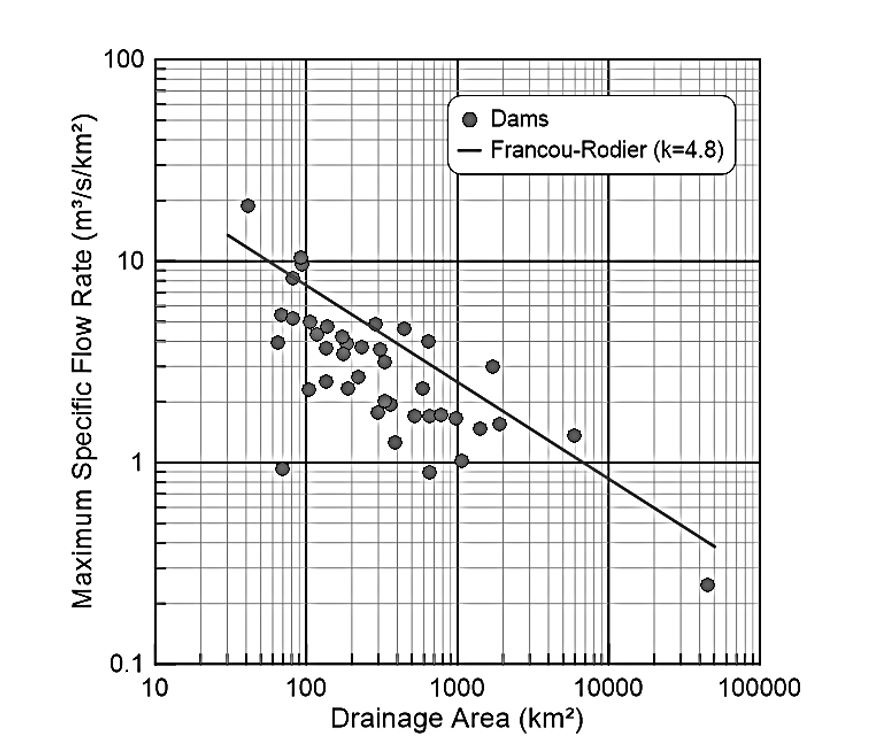
Although Sousa and Pinto (2001)SOUSA, L. N.; PINTO, N. L. S. Segurança ao galgamento de barragens do Nordeste. In: SEMINÁRIO NACIONAL DE GRANDES BARRAGENS, 24., 2001, Fortaleza. Anais... Fortaleza: CBDB, 2001. p. 693-699. have used the coefficient k equals to 4.8 for Francou-Rodier's curve in the state of Ceará, the present study did not find satisfactory results with this regional coefficient.
It can be observed from Figures 5 and 6 that several maximum flow rate points are above the curve. Then, they are not envelopes, since the floods would be underestimated. Therefore, it is necessary to estimate the values for the regional coefficients (k) suitable for Ceará.

Francou-Rodier’s curve for 1,000-year return period flow rates and regional coefficient equal to 4.8.

Francou-Rodier’s curve for 10,000-year return period flow rates and regional coefficient equal to 4.8.
Determination of the new regional coefficients (k) for the State of Ceará
The new regional coefficient values (k) are obtained with the direct application of Francou-Rodier’s equation, by replacing the values of design flows and drainage areas for each reservoir. The results are shown in Table 2.
The values of k for the various reservoirs vary from 3.19 to 5.20 for Tr = 1,000 years and from 4.09 to 5.56 for Tr = 10,000 years. Again, for the curves work as an “envelope”, the values slightly above the maximums found for k, that is, 5.3 (Tr = 1,000 years) and 5.6 (Tr = 10,000 years) were adopted (Figures 7 and 8).

Francou-Rodier’s curve for 1,000-year return period flow rates and regional coefficient equal to 5.3.

Francou-Rodier’s curve for 10,000-year return period flow rates and regional coefficient equal to 5.6.
Castellarin’s curve
The Castellarin’s curve relates maximum flow rates and drainage areas to coefficients a and b.
Determination of the coefficient b
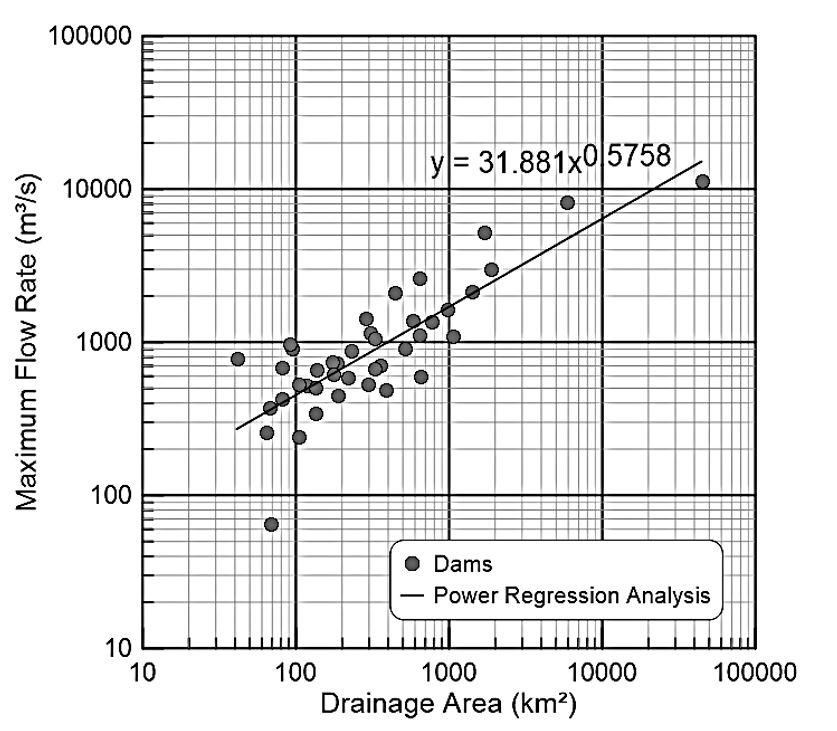
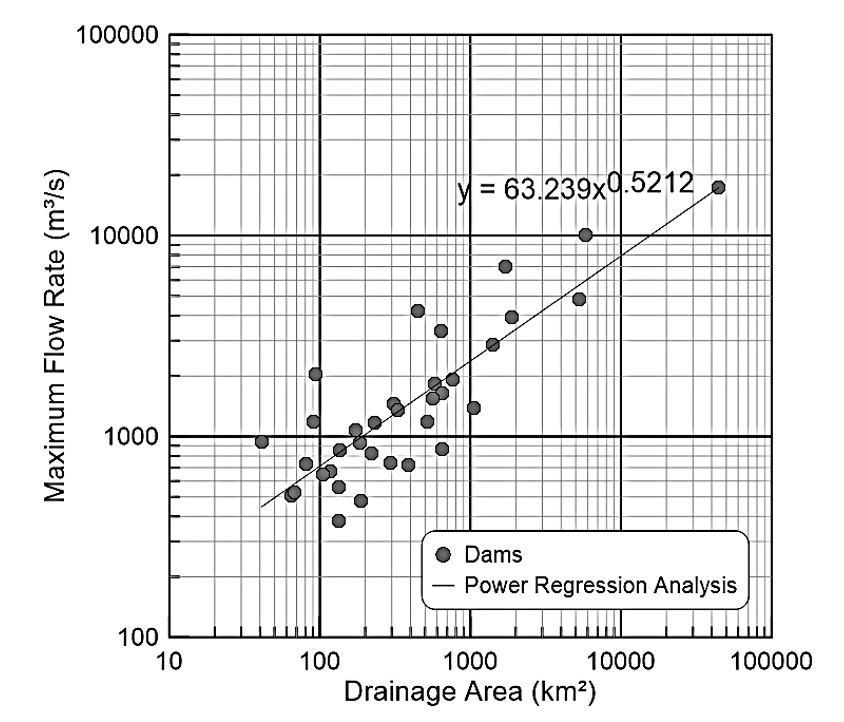
The Castellarin’s coefficient b is obtained by applying the nonlinear power regression type curve to the maximum flows rates and drainage areas for each basin. The power regression equation (Equation 10) is then compared to the Castellarin’s equation (Equation 11), as follows:
Thus, Castellarin’s coefficients b are –0.4242 for Tr = 1,000 years (Figure 9) and –0.4788 for Tr = 10,000 years (Figure 10).


Determination of coefficient a
The values obtained for the coefficient ‘b’ are used for all reservoirs and applied in Equation 12.
The values obtained for the coefficient a are also presented in Table 2. The values of the coefficients used in the calculation of the curves must be the largest values found for each return period. Thus, for the 1,000-year return period flood, the value of the coefficient a is equal to 4.51 and, for the 10,000-year return period, this coefficient is equal to 5.25.
Figures 11 and 12 show Castellarin’s curve for the maximum flows with return periods of 1,000 and 10,000 years, respectively. The application of the methodology generates regional coefficient values suitable for the region studied.


Comparative analysis for Creager’s, Francou-Rodier’s and Castellarin’s curves
The following three envelope curves are then presented for the estimation of the three different return period values studied. Although they are quite similar in their results, small differences can be identified for different scales of drainage areas.
In the case of 1,000-year return period floods (Figure 13), the three curves show very similar results for drainage area with values up to 200 km2. Beyond this value, the curves begin to distance themselves and the best results are those showed by Francou-Rodier’s curve, with its coefficient adjusted to Ceará (k = 5.3). The Castellarin’s curve is the most distant from the cloud of points, especially for basins with areas above 1,100 km2.

Creager’s, Francou-Rodier’s and Castellarin’s curves comparative analysis for 1,000-year return period flow rates.
Similarly, it can be observed that for the 10,000-year return period floods (Figure 14), the three curves present similar results in basins with areas up to 400 km2. Once again, the Francou-Rodier’s curve shows the best results, regardless of the basin area. The Castellarin’s curve continues to present higher values than the others, however not as accented as in Tr = 1,000 years.

Creager’s, Francou-Rodier’s and Castellarin’s curves comparative analysis for 10,000-year return period flow rates.
Therefore, it is recommended the Francou-Rodier’s envelope curve to represent the behavior of the 1,000- and 10,000-year return period floods for the State of Ceará, according to Equations 13 and 14.
CONCLUSION
This paper applies the methodology of Creager, Francou-Rodier and Castellarin envelope curves to 43 reservoirs in the State of Ceará, with drainage areas ranging from 41.4 km2 to 44.800,0 km2. New regional coefficients are estimated, since those cited in the literature do not fit the maximum flows for the region studied.
When comparing the three enveloping curves for Ceará, it is observed that, in general, they have fairly similar behavior. However, it is concluded that the Francou-Rodier’s, corrected with the new regional coefficients for Ceará, is the one that presents the best results, independently of the drainage area and the return period adopted.
The present study also highlights the excellent results obtained and indicates the methodology of the envelope curves as an excellent tool for verifying the hydrological risk of spillway dams in Ceará, most of them built in the first quartiles of the 20th century. This tool, which is easy to apply, can also be used to estimate the project flow of future dam works in the State.
REFERENCES
- AHSAN, H.; MABI, G.; BOOTA, M. W.; ABBAS, T. Development of envelope curve for Indus and Jhelum River basin in Pakistan and estimation of upper bound using envelope curve. Journal of Himalayan Earth Sciences, v. 49, n. 1, p. 98-109, 2016.
- BAYAZIT, M.; ÖNÖZ, B. Envelope curves for maximum floods in Turkey. Teknik Dergi, v. 15, n. 1, p. 3125-3130, 2004.
- BIONDIĆ, D.; BARBALIĆ, D.; PETRAŠ, J. Creager’s and Francou-Rodier’s envelopes of extreme floods in the Danube river basin in Croatia. In: KICK-OFF WORKSHOP ON IAHS DECADE OF PREDICTION IN UNGAUGED BASINS, 2007, Brasilia. Anais… Brasília: IAHS Press, 2007. p. 221-228.
- BRASIL. Lei nº 12.334, de 20 de setembro de 2010. Estabelece a Política Nacional de segurança de barragens. Diário Oficial [da] República Federativa do Brasil, Brasília, DF. Disponível em: <http://www.planalto.gov.br/ccivil_03/_Ato2007-2010/2010/Lei/L12334.htm>. Acesso em: 15 nov. 2016.
» http://www.planalto.gov.br/ccivil_03/_Ato2007-2010/2010/Lei/L12334.htm - CAMPOS, J.N.B. Lições em modelos e simulação hidrológica. Fortaleza: ASTEF/EXPRESSÃO GRÁFICA, 2009.
- CAMPOS-ARANDA, D. F. Estimación de envolventes de diseño por subregiones hidrológicas. Tecnología y Ciencias del Agua, v. 2, n. 4, p. 175-194. 2011.
- CASTELLARIN, A. Probabilistic envelope curves for design flood estimation at ungauged sites. Water Resources Research, v. 43, n. 4, p. 1-12, 2007.
- CASTELLARIN, A.; VOGEL, R. M.; MATALAS, N. C. Probabilistic behavior of a regional envelope curve. Water Resources Research, v. 41, n. 6, 1-13, 2005.
- COELHO FILHO, J. A. P.; NAGHETTINI, M.; PINTO, E. J. A. Curvas Envoltórias probabilísticas para a estimação de cheias de projeto. Revista Brasileira de Recursos Hídricos, v. 16, n. 1, p. 83-96, 2011. http://dx.doi.org/10.21168/rbrh.v16n1.p83-96
» http://dx.doi.org/10.21168/rbrh.v16n1.p83-96 - CREAGER, W. P.; JUSTIN, J. D.; HINDS, J. Engineering for dams. New York: John Wiley and Sons, 1945. (General Design, 1).
- CRIPPEN, J. R. Envelope curves for extreme flood events. Journal of the Hydraulics Division, v. 108, n. 10, p. 1208-1212, 1982.
- CRIPPEN, J. R.; BUE, C. D. Maximum flood flows in the conterminous. Washington: USGPO, 1977. (Geological Survey Water Supply Paper 1887).
- DALRYMPLE, T. Flood-frequency analyses. In Manual of hydrology: flood-flow techniques. Washington: USGPO, 1960. Part. 3.
- ENZEL, Y.; ELY, L. L.; HOUSE, P. K.; BAKER, V. R.; WEBB, R. H. Paleoflood evidence for a natural upper bound to flood magnitudes in the Colorado river basin. Water Resources Research, v. 29, n. 7, p. 2287-2297, 1993. http://dx.doi.org/10.1029/93WR00411
» http://dx.doi.org/10.1029/93WR00411 - FRANCOU, J.; RODIER, J. A. Essai de classification des crues maximales observes dans le monde. Cahiers ORSTOM, Série Hydrologie, v. 4, n. 3, p. 19-46, 1967.
- GUSE, B.; HOFHERR, T.; MERZ, B. Introducing empirical and probabilistic regional envelope curves into a mixed bounded distribution function. Hydrology and Earth System Sciences, v. 14, n. 12, p. 2465-2478, 2010. http://dx.doi.org/10.5194/hess-14-2465-2010
» http://dx.doi.org/10.5194/hess-14-2465-2010 - JARVIS, C. S. Flood flow characteristics. Transactions of the American Society of Civil Engineers, v. 88, p. 985-1032, 1925.
- KADOYA, M. Study on record flood peaks in Japan. Proceedings of the Japan Academy, Series B, v. 68, n. 8, p. 133-138, 1992.
- MARCELLINI, S. S.; LIMA, G.; NEILL, C. R. Curvas envoltórias de Creager e as vazões de cheia no Brasil: análise comparativa. In: SIMPÓSIO BRASILEIRO DE RECURSOS HÍDRICOS: SEGURANÇA HÍDRICA E DESENVOLVIMENTO SUSTENTÁVEL: DESAFIOS DO CONHECIMENTO E DA GESTÃO, 21., 2015, Brasília. Anais... Porto Alegre: ABRH, 2015. p. 1-7.
- MATTHAI, H. F. Floods of June 1965 in South Platte River basin, Colorado. Washington: USGPO, 1969.
- MENESCAL, R.; MIRANDA, A.; PITOMBEIRA, E. As barragens e as enchentes. In: SIMPÓSIO BRASILEIRO DE DESASTRES NATURAIS, 1., 2004, Florianópolis. Anais... Florianópolis: UFSC, 2004.
- MIJARES, F. J. A. Fundamentos de hidrologia de superfície. México: Grupo Noriega Editores, 1992.
- OHNISHI, R.; KATO, T.; IMAIZUMI, M.; TANJI, H. A study to determine an equation of curve for regional flood peaks by maximum rainfall data. Paddy Water Environment, v. 2, n. 2, p. 83-90, 2004. http://dx.doi.org/10.1007/s10333-004-0043-6
» http://dx.doi.org/10.1007/s10333-004-0043-6 - PAPP, F. The extremeness of extreme: extraordinary floods. Wallingford: IAHS Publication, 2001. p. 375-378. (IAHS Publication, 271).
- PEGRAM, G.; PARAK, M. A review of the regional maximum flood and rational formula using geomorphological information and observed floods. Water S.A., v. 30, n. 3, p. 377-392, 2004. http://dx.doi.org/10.4314/wsa.v30i3.5087
» http://dx.doi.org/10.4314/wsa.v30i3.5087 - RAMÍREZ-OROZCO, A. I.; GÓMEZ-MARTÍNEZ, J. F.; CAMPOS-ARANDA, D. F. Actualización de las envolventes regionales de gastos máximos para la república mexicana. Tecnología y Ciencias del Agua, v. 20, n. 1, p. 99-108, 2005.
- SOUSA, L. N.; PINTO, N. L. S. Segurança ao galgamento de barragens do Nordeste. In: SEMINÁRIO NACIONAL DE GRANDES BARRAGENS, 24., 2001, Fortaleza. Anais... Fortaleza: CBDB, 2001. p. 693-699.
- SRH - SECRETARIA DOS RECURSOS HÍDRICOS. Base documental de conhecimento em recursos hídricos. 2016. Available from: <http://www.ged.srh.ce.gov.br>. Access on: 01 set. 2016.
» http://www.ged.srh.ce.gov.br - VOGEL, R. M.; ZAFIRAKOU-KOULOURIS, A.; MATALAS, N. C. Frequency of record-breaking floods in the United States. Water Resources Research, v. 37, n. 6, p. 1723-1731, 2001. http://dx.doi.org/10.1029/2001WR900019
» http://dx.doi.org/10.1029/2001WR900019
Publication Dates
-
Publication in this collection
2017
History
-
Received
13 Dec 2016 -
Reviewed
01 Feb 2017 -
Accepted
08 Feb 2017