
ABSTRACT
Acquisition and analysis of hydrological series are essential activities for hydrological studies in watersheds. However, they require time and are usually complex and susceptible to human errors. In order to minimize these problems, computational tools are often used for hydrological analysis, although there are few of them in Brazil. This technical note aims to provide a structured document with information on the motivation, development, conception, main functionalities, and applications of the System of Hydrological Data Acquisition and Analysis (SYHDA). SYHDA is a software intended for acquisition and analysis of hydrological data (rainfall and streamflow) and was fully idealized to enable the user to deal with the country’s leading hydrology databases. It has several modules that include analysis by descriptive statistics and graphical tools, seasonality analysis of streamflows, non-parametric tests, and at-site and regional probabilistic modeling. SYHDA has been used in numerous scientific studies, which give grounds to affirm that it demonstrates a great potential to be used in both everyday and complex activities demanded by the scientific and technical community of hydrology and related areas.
Keywords:
Hydrology; Hydrological series; Rainfall; Streamflow; Probabilistic modeling
RESUMO
A aquisição e a análise de séries hidrológicas são tarefas indispensáveis para estudos hidrológicos em bacias hidrográficas, no entanto, demandam tempo e normalmente apresentam complexidade e estão susceptíveis a erros humanos. A fim de minimizar estes problemas, frequentemente são empregadas ferramentas computacionais de análises hidrológicas, no entanto, existem poucas destas no Brasil. Esta nota técnica visa disponibilizar um documento estruturado com informações sobre a motivação, desenvolvimento, concepção, principais funcionalidades e aplicações do System of Hydrological Data Acquisition and Analysis (SYHDA). O SYHDA é um software de aquisição e análise de dados hidrológicos de chuva e vazão totalmente idealizado para permitir ao usuário trabalhar com os principais bancos de dados do país aplicados à hidrologia. Possui diversos módulos que contemplam análise por estatísticas descritivas e ferramentas gráficas, análise de sazonalidade de vazões, testes não paramétricos e modelagem probabilística local e regional. O SYHDA já foi empregado em inúmeros estudos científicos, os quais dão embasamento para afirmar que o software demonstra grande potencial para ser utilizado em atividades tanto cotidianas quanto complexas demandadas pela comunidade científica e técnica de hidrologia e de áreas afins.
Palavras-chave:
Hidrologia; Séries hidrológicas; Chuva; Vazão; Modelagem probabilística
INTRODUCTION
Engineering and water resources management are very dependent on hydrological series. However, the processing of these series is complex, commonly dependent on numerical methods for resolution, and susceptible to errors when done manually. These aspects frequently make difficult the elaboration of projects that depend on the analysis and study of hydrological series.
In this context, computational environments specifically developed for handling and analyzing hydrological series are of extreme importance not only for users with little or no knowledge in programming languages but also for the accomplishment of laborious and repetitive activities. Some available platforms for the analysis of hydrological series are: HIDRO, SisCAH, ALEA, SEAF, and Hydrognomon.
HIDRO – Sistema de Informações Hidrológicas (National Water Agency of Brazil, ANA) (ANA; SIH, 2002 ANA – Agência Nacional das Águas; SIH – Superintendência de Informações Hidrológicas. Hidro: sistema de informações hidrológicas. Brasília: ANA; 2002. ) enables users to manipulate hydrological databases provided by the HidroWeb platform; SisCAH – Sistema Computacional para Análise Hidrológica ( UFV, 2008 UFV – Universidade Federal de Viçosa. Programas desenvolvidos pelo grupo de pesquisa em recursos hídricos da UFV. Viçosa: UFV, 2008. Available from: <http://www.ufv.br/dea/gprh>. Access on: 03 ago. 2017.
http://www.ufv.br/dea/gprh ...
) has tools for regulation of streamflows, and tests of probability distributions and stationarity in streamflow series; ALEA – Análise de Frequência Local de Eventos Anuais ( UFMG, 2012 UFMG – Universidade Federal de Minas Gerais. Downloads. Belo Horizonte: Departamento de Engenharia Hidráulica e Recursos Hídricos, 2012. Available from: <http://www.ehr.ufmg.br/downloads>. Access on: 06 maio 2018.
http://www.ehr.ufmg.br/downloads ...
) allows estimating parameters of the main probability distributions used in the frequency analysis of hydrological events; SEAF – Sistema Especialista para Análise Local de Frequência ( CÂNDIDO, 2003 CÂNDIDO, M. O. SEAF – Um protótipo de um sistema especialista para análise de frequência local de eventos hidrológicos máximos anuais. 2003. 194 f. Dissertação (Mestrado em Saneamento) - Universidade Federal de Minas Gerais, Belo Horizonte, 2003. ) assists in choosing probability distributions suitable for the modeling of annual maximum hydrological events; Hydrognomon ( KOZANIS et al., 2010 KOZANIS, S.; CHRISTOFIDES, A.; MAMASSIS, N.; EFSTRATIADIS, A.; KOUTSOYIANNIS, D. Hydrognomon - open source software for the analysis of hydrological data. European Geosciences Union General Assembly. Geophysical Research Abstracts, v. 12, p. 12419, 2010. ) makes it available tools for aggregation and regularization of time intervals, consistency and visualization tests, construction of Intensity-Duration-Frequency curves, and statistical modeling.
SYHDA - System of Hydrological Data Acquisition and Analysis allows for a whole range of functionalities that are not inbuilt in other platforms, such as: i) analysis based on calendar or hydrological year; ii) use of databases from different sources; iii) analysis of different hydrological variables; iv) consideration of temporal scale restrictions; and v) availability of multi-parameter probability density functions, robust goodness-of-fit tests, and regional analyses based on the L-Moments technique. SYHDA seeks to overcome some of these limitations. It was designed to offer agility and accuracy to scientific research and/or projects in the field of hydrological engineering.
The computational routines implemented in SYHDA enable to: i) import rainfall and streamflow data in the Hidroweb/ANA database file format, rainfall data in the INMet (Brazilian National Institute of Meteorology) database file format, and rainfall and streamflow data from a given gauging station in a XLSX file extension (*.xlsx); ii) structure series at different time steps; iii) define failure thresholds for the structuration of hydrological series; iv) use calendar year or hydrological year for the organization and analysis of series; v) conduct complex statistical analyses addressing both local and regional approaches; vi) apply robust goodness-of-fit tests, non-parametric tests, seasonal analysis tests for streamflows and measures for regional frequency analysis. SYHDA was conceived as a tool to support the preparation of temporal databases necessary for hydrological simulation in the Lavras Simulation of Hydrology (LASH) model, as well as the analysis of its output results. In addition, such platform was designed to be used independently.
This article aims to provide a technical note containing several inter-structured topics about SYHDA, such as motivation, development, conception, main functionalities, and applications of the software. The idea is to present to the scientific and technical community a tool based on several state-of-the-art methodologies and that has the potential to be applied day-by-day by professionals working in hydrology and related areas.
THE SYHDA SOFTWARE
Development of SYHDA
SYHDA, developed by members of the Research Group on Hydrology and Hydrological Modeling in Watersheds/CNPq of the Federal University of Pelotas, stands out as one of the main modules of the hydrological model LASH. LASH is a deterministic and semi-conceptual rainfall-runoff model developed by researchers from the Federal University of Lavras in partnership with the Purdue University (USA) and currently with the participation of researchers from the Federal University of Pelotas. This hydrological model has been successfully applied in several watersheds ( BESKOW et al., 2011 BESKOW, S.; MELLO, C. R.; NORTON, L. D.; SILVA, A. M. Performance of a distributed semi-conceptual hydrological model under tropical watershed conditions. Catena, v. 86, n. 3, p. 160-171, 2011. http://dx.doi.org/10.1016/j.catena.2011.03.010.
http://dx.doi.org/10.1016/j.catena.2011...
; VIOLA et al., 2013 VIOLA, M. R.; MELLO, C. R.; BESKOW, S.; NORTON, L. D. Applicability of the LASH Model for Hydrological Simulation of the Grande River Basin, Brazil. Journal of Hydrologic Engineering , v. 18, n. 12, p. 1639-1652, 2013. http://dx.doi.org/10.1061/(ASCE)HE.1943-5584.0000735.
http://dx.doi.org/10.1061/(ASCE)HE.1943...
; BESKOW et al., 2013 BESKOW, S.; CORRÊA, L. L.; MAHL, M.; SIMÕES, M. C.; CALDEIRA, T. L.; NUNES, G. S.; LUCAS, E. H.; FARIA, L. C.; MELLO, C. R. Desenvolvimento de um sistema computacional de aquisição e análise de dados hidrológicos. In: SIMPÓSIO BRASILEIRO DE RECURSOS HÍDRICOS, 20., 2013, Bento Gonçalves, Rio Grande do Sul. Anais... Porto Alegre: ABRH, 2013. CD-ROM. ; VIOLA et al., 2014 VIOLA, M. R.; MELLO, C. R.; BESKOW, S.; NORTON, L. D. Impacts of land-use changes on the hydrology of the Grande river basin headwaters, Southeastern, Brazil. Water Resources Management , v. 28, n. 13, p. 4537-4550, 2014. http://dx.doi.org/10.1007/s11269-014-0749-1.
http://dx.doi.org/10.1007/s11269-014-07...
; BESKOW et al., 2016b BESKOW, S.; TIMM, L. C.; TAVARES, V. E. Q.; CALDEIRA, T. L.; AQUINO, L. S. Potential of the LASH model for water resources management in data-scarce basins: a case study of Fragata River Basin, Southern Brazil. Hydrological Sciences Journal, v. 61, n. 14, p. 2567-2578, 2016b. http://dx.doi.org/10.1080/02626667.2015.1133912.
http://dx.doi.org/10.1080/02626667.2015...
; CALDEIRA et al., 2019 CALDEIRA, T. L.; MELLO, C. R.; BESKOW, S.; TIMM, L. C.; VIOLA, M. R. LASH hydrological model: an analysis focused on spatial discretization. Catena, v. 173, p. 183-193, 2019. http://dx.doi.org/10.1016/j.catena.2018.10.009.
http://dx.doi.org/10.1016/j.catena.2018...
).
The software SYHDA has been fully developed in the Delphi® 7 programming environment, which is an Integrated Development Environment (IDE) for Windows platform. In addition, the Firebird® database, the set of databank connection component ZeosLib®, and the IBexpress® database manager system were also used. The ZeosLib component was used to provide a single connection between the developed software and the information stored in the database, excluding the need for the user to install some auxiliary driver.
No minimum configuration is required for SYHDA installation and operation, but it is recommended to use a 2.2 GHz or higher processor and RAM of at least 2 GB so that it can process routines normally. The software was developed for Windows platforms, thus requiring that the computer is running this operating system, without version restriction. It is necessary to install the Firebird database system version 2.5, otherwise, several tools of the SYHDA will be compromised since they use information contained in the databank developed within this database manager system.
Acquisition of hydrological data
The data acquisition step is the user’s first contact with SYHDA, in which the hydrological data (rainfall or streamflow) are imported into the software. Computational routines were implemented in order to allow understanding the database structures of Hidroweb/ANA and INMet, as well as of spreadsheets (XLSX file extension) containing monitoring data at daily or sub-daily intervals. Figure 1 illustrates the initial interface of SYHDA and some options for importing manually rainfall and streamflow data.
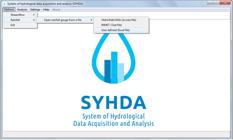
SYHDA initial interface and illustration of some possibilities for importation of hydrological data.
Structuration of hydrological series
After importing hydrological data, the hydrological series structuration step allows meeting user’s interests and objectives. SYHDA was programmed to organize hydrological series based on calendar and hydrological year, both of which usually used in day-to-day hydrological engineering. The calendar year option is applied as default if the user does not configure the hydrological year (in Settings). The hydrological year is commonly used in annual series analyses to minimize independence problems of the series, as discussed in Naghettini (2017) NAGHETTINI, M. Fundamentals of statistical hydrology. Springer International Publishing, 2017. http://dx.doi.org/10.1007/978-3-319-43561-9.
http://dx.doi.org/10.1007/978-3-319-435...
. It is important to mention that SYHDA deals with the two consistency flags contained in Hidroweb/ANA files (raw data and consisted data). Initially, SYHDA takes into account only consisted data (consistency level = 2) to organize the corresponding hydrological series. However, when there are time periods in a series with no consisted data, SYHDA makes use of the raw data (consistency level = 1) to elaborate the corresponding hydrological series.
Once the file containing data of interest is imported, SYHDA runs with the default structure that makes it possible for the user to understand the failure behavior in the original data and to set the failure acceptance criterion according to the purpose of the study. This possibility of defining a failure criterion in SYHDA is greatly important since hydrologists commonly deal with short hydrological series, as also highlighted by Beskow et al. (2016a BESKOW, S.; MELLO, C. R.; VARGAS, M. M.; CORRÊA, L. L.; CALDEIRA, T. L.; DURÃES, M. F.; AGUIAR, M. S. Artificial intelligence techniques coupled with seasonality measures for hydrological regionalization of Q90 under Brazilian conditions. Journal of Hydrology, v. 541, p. 1406-1419, 2016a. http://dx.doi.org/10.1016/j.jhydrol.2016.08.046.
http://dx.doi.org/10.1016/j.jhydrol.201...
, b BESKOW, S.; TIMM, L. C.; TAVARES, V. E. Q.; CALDEIRA, T. L.; AQUINO, L. S. Potential of the LASH model for water resources management in data-scarce basins: a case study of Fragata River Basin, Southern Brazil. Hydrological Sciences Journal, v. 61, n. 14, p. 2567-2578, 2016b. http://dx.doi.org/10.1080/02626667.2015.1133912.
http://dx.doi.org/10.1080/02626667.2015...
), therefore, they usually need to use them even with failures. In this context, a functionality that allows the software to understand the failures in the data and allows the user to choose the configuration can be considered useful. For this purpose, SYHDA requires information about the threshold of missing days that will be accepted for the hydrological series, considering the time step selected by the user.
After this initial configuration, the user can choose to structure hydrological series of maximum, minimum, and average streamflow, total rainfall or maximum daily rainfall. In order to take advantage of the information existing in the Hidroweb/ANA databases, SYHDA uses monthly statistics in the first columns of the file to organize maximum, minimum and mean streamflow series when the time step is annual or monthly. On the other hand, when time step is daily, weekly or fortnightly, SYHDA makes use of daily records to organize the series.
Computational routines were developed such that SYHDA can structure the aforementioned series at different time steps, i.e., daily, weekly, fortnightly, monthly, and yearly. Given the choice of time step and failure threshold, the other functionalities support the visualization and export of the hydrological series in order to fulfill the user’s interest. The functionality Series allows the export (in XLSX file format) of hydrological series according to the time step defined in Rainfall or Streamflow , when applicable.
The functionality Series settings provides visualization modes for export of hydrological series resulting from the time step settings defined by the user. For each time step (Daily, Weekly, Fortnightly , Monthly, and Yearly), SYHDA makes available an interface with specific options. For the original rainfall data, SYHDA automatically organizes (Series settings) a series of total rainfall and other of annual maximum daily rainfall, following failure threshold and the established time step. In the example of Figure 2 for daily rainfall data, time step was defined as monthly, so the user can choose the month of the rainfall series that needs to be evaluated.
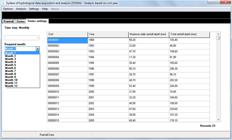
Interface illustrating the processing of hydrological series for January from daily rainfall data of the station registered at ANA under the code 02951010.
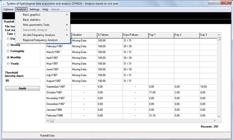
When the original data consist of streamflow values, the option Series settings automatically structures minimum, average, and maximum streamflow series for the time step of interest. In addition to organizing series of average and maximum streamflows, SYHDA may also set series of minimum streamflows associated with different durations (1, 3, 5, 7 days, etc.), thus providing an essential support for water resources management regarding the studies based on reference streamflows (e.g. Q7,10). It should be pointed out that the data visualization modes in Series settings are directly related to the defined failure threshold and time step. In addition, after defining the visualization mode for a hydrological series, it can be converted into a XLSX format, exported and used for various purposes in hydrological engineering and other related areas.
Once the hydrological series (Rainfall or Streamflow ) has been structured following the time step and failure threshold of interest, the user has a wide range of graphical and statistical analysis options made available by SYHDA, which will be described in the sequence.
Hydrological analyses
The general option Analysis has functionality modules that allow for basic hydrological analyses and robust tests related to probabilistic distributions, as well as other specific tests. These functionalities consist of ( Figure 3 ): i) Basic graphics; ii) Basic statistics; iii) Non-parametric tests; iv) Seasonality analysis; v) At-site frequency analysis; and vi) Regional frequency analysis .
Two tools for graphical analysis are available in Basic Graphics: Flow-duration curve (All the period or Split the period into two) and Histogram.
In Flow-duration curve (All the period), which is an option available for streamflow series, there are three possibilities: i) Analysis ( Figure 4 a) – visualization of streamflows frequency based on the previously selected time step and on the definition of a specific period of years (Data Filter/ Year Range), in addition to the possibility of exporting the results (XLSX format); ii) Graphic ( Figure 4 b) – visualization of the graphic related to the processed data, having as option to display streamflows according to the logarithmic scale (Logarithm Scale ); and iii) Table ( Figure 4 c) – calculation of one or more reference streamflows from the flow-duration curve for the structured hydrological series. For the option Split the period into two , the flow-duration curve processing is performed in two periods according to the suggestions of Laaha and Blöschl (2006) LAAHA, G.; BLÖSCHL, G. Seasonality indices for regionalizing low flows. Hydrological Processes, v. 20, n. 18, p. 3851-3878, 2006. http://dx.doi.org/10.1002/hyp.6161.
http://dx.doi.org/10.1002/hyp.6161 ...
. This option has the processing similar to that performed for All the period option, but the months of the year of the first period must be indicated in order to define the division of data for processing.

Application of SYHDA to determine the flow-duration curve from streamflow data of the station registered at ANA under code 88850000, considering the daily time step and complete period, with emphasis on the functionalities Analysis (a), Graphic (b), and Table (c).
In Histogram ( Figure 5 ), for a streamflow or rainfall series, SYHDA enables to determine the frequency histogram (Absolute frequency or Relative frequency) for different time steps (weekly, fortnightly, monthly, and annual) and the cumulative relative frequency histogram (Cumulative relative frequency). If the user needs, the software allows visualizing (Show adjusted parameters) the parameters considered in the histogram construction. The methodology described by Naghettini (2017) NAGHETTINI, M. Fundamentals of statistical hydrology. Springer International Publishing, 2017. http://dx.doi.org/10.1007/978-3-319-43561-9.
http://dx.doi.org/10.1007/978-3-319-435...
was taken as the basis for implementing the algorithms for histogram and flow-duration curve.

Illustration of the processing in SYHDA for generating the relative frequency histogram considering the average monthly streamflow series of April structured from hydrological data of the station registered at ANA under the code 88850000.
In Basic statistics ( Figure 6 ), the user can check the harmonic mean, geometric mean, arithmetic mean, median, mean deviation, variance, standard deviation, minimum and maximum values, and coefficients of variation, skewness, and kurtosis of the previously defined hydrological series for the chosen time step and failure threshold. SYHDA allows indicating the number of decimal places ( Precision) of the values that will be displayed, as well as calculating them for a specific annual time interval (Data Filter/Year Range ). Depending on the defined time step, statistics can be calculated for each week, fortnight, or month. Thus, the user can redefine what extract from this hydrological series directly on the main interface and quickly obtain the descriptive statistics corresponding to the periods of interest.

SYHDA interface for calculating basic statistics of the monthly streamflow series of June for the period from 1964 to 2013, structured from hydrological data of the station registered at ANA under the code 88850000.
Regarding the Non-parametric Tests, SYHDA includes Stationarity , Independence, and Homogeneity tests, which use the tests of Spearman (1904) SPEARMAN, C. The proof and measurement of association between two things. The American Journal of Psychology, v. 15, n. 1, p. 72-101, 1904. http://dx.doi.org/10.2307/1412159. PMid:3322052.
http://dx.doi.org/10.2307/1412159 ...
, Wald and Wolfowitz (1943) WALD, A.; WOLFOWITZ, J. An exact test for randomness in the non-parametric case based on serial correlation. Annals of Mathematical Statistics, v. 14, n. 4, p. 378-388, 1943. http://dx.doi.org/10.1214/aoms/1177731358.
http://dx.doi.org/10.1214/aoms/11777313...
, and Mann and Whitney (1947) MANN, H. B.; WHITNEY, D. R. On the test of whether one of two random variables is stochastically larger than the other. Annals of Mathematical Statistics, v. 18, n. 1, p. 50-60, 1947. http://dx.doi.org/10.1214/aoms/1177730491.
http://dx.doi.org/10.1214/aoms/11777304...
, respectively. Figure 7 depicts the interface for the stationarity test applied to a streamflow series, structured on a monthly time step basis. SYHDA makes available such tests for minimum, average, or maximum streamflows, or even for maximum daily and total rainfall, requiring the choice of the statistical significance level and time step of interest for applying them.

Interface of the Spearman’s non-parametric stationarity test applied to the average monthly streamflow of March (5% significance level), structured from hydrological data of the station registered at ANA under the code 88850000.
Routines for calculating seasonality measures (Seasonality Analysis module) were implemented in SYHDA, namely: Seasonality Ratio (SR), Seasonality Index (SI), and Seasonality Histogram (SH) proposed by Laaha and Blöschl (2006) LAAHA, G.; BLÖSCHL, G. Seasonality indices for regionalizing low flows. Hydrological Processes, v. 20, n. 18, p. 3851-3878, 2006. http://dx.doi.org/10.1002/hyp.6161.
http://dx.doi.org/10.1002/hyp.6161 ...
, Burn et al. (1997) BURN, D. H.; ZRINJI, Z.; KOWALCHUK, M. Regionalization of catchments for regional flood frequency analysis. Journal of Hydrologic Engineering, v. 2, n. 2, p. 76-82, 1997. http://dx.doi.org/10.1061/(ASCE)1084-0699(1997)2:2(76).
http://dx.doi.org/10.1061/(ASCE)1084-06...
, and Laaha (2002) LAAHA, G. Modeling summer and winter droughts as a basis for estimating river low flows. In: 4th International Conference Held in Cape Town, FRIEND 2002 - Regional Hydrology: Bridging the Gap between Research and Practice, 4., 2002, South Africa. Proceedings… South Africa: IAHS. p. 289-295, 2002. , respectively. This version allows performing these seasonality measures only for streamflow series. However, the daily time step has to be chosen to enable the calculation module for the seasonality measures ( Figures 8 a, b, c). Also, for SR, it is necessary to generate a flow-duration curve in two periods, while for SI and SH, all the period needs to be used for its determination. In this module, the user can choose the quantiles of interest from the flow-duration curve for analysis (e.g. Q 90) for all seasonality measures.

Interface for calculation of seasonality measures and visualization of results for SR (a), SI (b), and SH (c) considering the daily streamflow series structured from hydrological data of the station registered at ANA under the code 88850000.
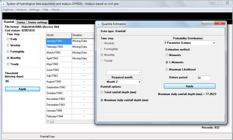
The at-site probabilistic modeling tool of SYHDA (At-site frequency analysis ) enables the fit and goodness-of-fit verification of theoretical probability distributions used in hydrology. The module Fit of Theoretical Models ( Figure 9 ) has algorithms responsible for fitting the theoretical probability distributions Normal, 2 and 3 Parameter Log-Normal, Gumbel (maximum and minimum data), Exponential, 2 Parameter Gamma, Generalized Pareto , Generalized Extreme Value (GEV), Generalized Logistic, Kappa, Pearson Type 3 , Weibull, and Wakeby. For the estimation of parameters of these probability distributions, the user can choose Method of Moments , Method of L-Moments, or Maximum Likelihood Method . The availability of methods for parameter estimation varies according to the probability distribution of interest. In Figure 10 , readers can observe one of the possibilities found by SYHDA users for probabilistic modeling. In addition, the software allows manipulating the information so that the user can quickly identify, through the application of the goodness-of-fit tests implemented in SYHDA, which probability distribution best fits the observed hydrological series. In relation to the empirical probability distribution of a hydrological series, the user can choose different plotting position formulas (Weibull, Gringorten, Blom, Hazem, and Cunnane), which were established in the literature according to criteria defined by Gumbel (1958) GUMBEL, E. J. Statistics of extremes. New York: Columbia University Press, 1958. 375 p. and reported in Ullmann (1961) ULLMANN, J.E. A review of: “Statistics of Extremes” By Emil J. Gumbel Columbia University Press New York, 1958 375 pp. Engineering Economist: A Journal Devoted to the Problems of Capital Investment, v. 7, n. 1, p. 36-38, 1961. . In Show graphic, SYHDA is able to generate the graphic of theoretical and empirical probabilities. In order to verify the goodness-of-fit of probability distributions to observed hydrological series, the option Run goodness-of-fit tests ( Figure 11 ) allows the application of the traditional tests Kolmogorov-Smirnov ( KOLMOGOROV, 1956 KOLMOGOROV, A. N. Grundbegriffe der wahrscheinlichkeitrechnung. Ergbnisse der Mathematik, 1933. 2nd ed. New York: Chelsea Publishing Company, 1956. English translation: Foundations of the theory of probability. ; SMIRNOV, 1948 SMIRNOV, N. Table for estimating the goodness-of-fit of empirical distributions. Annals of Mathematical Statistics, v. 19, n. 2, p. 279-281, 1948. http://dx.doi.org/10.1214/aoms/1177730256.
http://dx.doi.org/10.1214/aoms/11777302...
) and Chi-Square ( PEARSON, 1900 PEARSON, K. On the criterion that a given system of deviations from the probable in the case of a correlated system of variables is such that it can be reasonably supposed to have arisen from random sampling. Philosophical Magazine, v. 50, p. 157-175, 1900. ), as well as more robust tests such as Filliben ( FILLIBEN, 1975 FILLIBEN, J. J. The probability plot correlation coefficient test for normality. Technometrics, v. 17, n. 1, p. 111-117, 1975. http://dx.doi.org/10.1080/00401706.1975.10489279.
http://dx.doi.org/10.1080/00401706.1975...
) and Anderson-Darling ( ANDERSON; DARLING, 1954 ANDERSON, T. W.; DARLING, D. A. A test of goodness of fit. Journal of the American Statistical Association, v. 49, n. 268, p. 756-769, 1954. http://dx.doi.org/10.1080/01621459.1954.10501232.
http://dx.doi.org/10.1080/01621459.1954...
). The option Show details ( Figure 11 ) presents some intermediate calculations and definitions of the processing of goodness-of-fit tests, emphasizing the importance of routines implemented in SYHDA, which make it possible for the user to visualize from preliminary processing to the final results.

Hydrological functionalities available in the module at-site probabilistic modeling of SYHDA.

Illustration of the processing related to Kappa probability distribution, with parameter estimation using the L-Moments method and calculation of theoretical and empirical probabilities for the series of annual maximum daily rainfall structured from hydrological data of the station registered at ANA under the code 02951010.

Display of the Kolmogorov-Smirnov, Chi-Square, Filliben, and Anderson-Darling tests to verify the goodness-of-fit of Kappa probability distribution to the series of annual maximum daily rainfall structured from hydrological data of the station registered at ANA under the code 02951010.
The functionalities Quantile estimation and L-moments calculation are also included in the module At-site frequency analysis . Both are used internally by the at-site probabilistic modeling routines with the purpose of providing for hydrologists a quick quantile estimation for different hydrological series and return periods ( Figure 12 ). It is worth mentioning that, for this option (Quantile estimation), it is not necessary to go back to other interfaces to organize series and fit the models since everything is done directly.
Quantile calculation for different return periods through the 2-parameter Gama probability distribution with parameters estimated by the L-Moments method, considering the series of annual maximum daily rainfall structured from hydrological data of the station registered at ANA under the code 02951010.
Hosking and Wallis (1997) HOSKING, J. R. M.; WALLIS, J. R. Regional frequency analysis: an approach based on L-moments. Cambridge: Cambridge University Press, 1997. 224 p. http://dx.doi.org/10.1017/CBO9780511529443.
http://dx.doi.org/10.1017/CBO9780511529...
codified a methodology for regional frequency analysis of hydrological variables in Fortran-77 language routines ( HOSKING, 2005 HOSKING, J. R. M. Fortran routines for use with the method of L-moments. Version 3.04. IBM Research, 2005. 33 p. Available from: <http://lib.stat.cmu.edu/general/lmoments>. Access on: 05 sept. 2018.
http://lib.stat.cmu.edu/general/lmoment...
). The steps proposed by Hosking and Wallis (1997) HOSKING, J. R. M.; WALLIS, J. R. Regional frequency analysis: an approach based on L-moments. Cambridge: Cambridge University Press, 1997. 224 p. http://dx.doi.org/10.1017/CBO9780511529443.
http://dx.doi.org/10.1017/CBO9780511529...
were implemented in the current version of SYHDA ( Figure 13 ), namely: regional heterogeneity measure (H), discordancy measure (D), estimation of regional frequency distribution, and goodness-of-fit measure (Z). SYHDA performs the regional heterogeneity test H ( HOSKING; WALLIS, 1997 HOSKING, J. R. M.; WALLIS, J. R. Regional frequency analysis: an approach based on L-moments. Cambridge: Cambridge University Press, 1997. 224 p. http://dx.doi.org/10.1017/CBO9780511529443.
http://dx.doi.org/10.1017/CBO9780511529...
) from a set of hydrological series and offers interfaces for: i) selecting the type of hydrological series (Data option); ii) selecting the time step (Time step) and the failure threshold (missing days) for series structuration; iii) generating the series to be analyzed (minimum, average or maximum streamflow, or maximum daily or total rainfall series); and iv) loading (Load files) in Fourth Step the hydrological data corresponding to the streamflow or rainfall gauging stations of interest.

For a group of hydrological series, the discordancy measure D ( HOSKING; WALLIS, 1997 HOSKING, J. R. M.; WALLIS, J. R. Regional frequency analysis: an approach based on L-moments. Cambridge: Cambridge University Press, 1997. 224 p. http://dx.doi.org/10.1017/CBO9780511529443.
http://dx.doi.org/10.1017/CBO9780511529...
) seeks to identify the samples whose statistical descriptors are very discrepant from the average descriptors of the group. The discordancy measure D is expressed as a statistic of three ratios for L-Moments, i.e. CV-L (or τ), L-Skewness (or τ3), and L-Kurtosis (or τ4) ( NAGHETTINI, 2017 NAGHETTINI, M. Fundamentals of statistical hydrology. Springer International Publishing, 2017. http://dx.doi.org/10.1007/978-3-319-43561-9.
http://dx.doi.org/10.1007/978-3-319-435...
). Hosking and Wallis (1997) HOSKING, J. R. M.; WALLIS, J. R. Regional frequency analysis: an approach based on L-moments. Cambridge: Cambridge University Press, 1997. 224 p. http://dx.doi.org/10.1017/CBO9780511529443.
http://dx.doi.org/10.1017/CBO9780511529...
recommended, in addition to traditional data consistency techniques, the application of the discordancy measure D, which is performed together with the regional heterogeneity measure H. The results are displayed according to recommendations of critical values for D, proposed by Hosking and Wallis (1997) HOSKING, J. R. M.; WALLIS, J. R. Regional frequency analysis: an approach based on L-moments. Cambridge: Cambridge University Press, 1997. 224 p. http://dx.doi.org/10.1017/CBO9780511529443.
http://dx.doi.org/10.1017/CBO9780511529...
. From the application of the previous steps and considering that the hydrologically homogeneous regions have been defined, they can have the parameters fitted for a single regional probability distribution. The fitting is carried out in accordance with the L-Moments method, which equals the population L-Moments of the distribution under analysis to the sample L-Moments.
The goodness-of-fit measure Z ( HOSKING; WALLIS, 1997 HOSKING, J. R. M.; WALLIS, J. R. Regional frequency analysis: an approach based on L-moments. Cambridge: Cambridge University Press, 1997. 224 p. http://dx.doi.org/10.1017/CBO9780511529443.
http://dx.doi.org/10.1017/CBO9780511529...
) quantifies the goodness-of-fit of a probability distribution to the set of hydrological series of interest. In SYHDA, the results of Z measure application, as well as those of other measures, are arranged in the interface of the Regional Frequency Analysis module ( Figure 13 ).
Applications of SYHDA, considerations and future developments
During SYHDA development, various members of the research group tested the algorithms related to database acquisition, series structuration, and hydrological analysis, as well as evaluated its performance. Currently, several studies developed in the academic field have used SYHDA.
The first study was conducted by Beskow et al. (2013) BESKOW, S.; CORRÊA, L. L.; MAHL, M.; SIMÕES, M. C.; CALDEIRA, T. L.; NUNES, G. S.; LUCAS, E. H.; FARIA, L. C.; MELLO, C. R. Desenvolvimento de um sistema computacional de aquisição e análise de dados hidrológicos. In: SIMPÓSIO BRASILEIRO DE RECURSOS HÍDRICOS, 20., 2013, Bento Gonçalves, Rio Grande do Sul. Anais... Porto Alegre: ABRH, 2013. CD-ROM. , who intended to present an initial version of SYHDA to the community. The authors discussed the idealization of the software and the implementation of its basic functionalities, evaluated its performance and accuracy in processing a streamflow series and determined its statistics, frequency histogram, and flow-duration curve. Considering the achieved results, Beskow et al. (2013) BESKOW, S.; CORRÊA, L. L.; MAHL, M.; SIMÕES, M. C.; CALDEIRA, T. L.; NUNES, G. S.; LUCAS, E. H.; FARIA, L. C.; MELLO, C. R. Desenvolvimento de um sistema computacional de aquisição e análise de dados hidrológicos. In: SIMPÓSIO BRASILEIRO DE RECURSOS HÍDRICOS, 20., 2013, Bento Gonçalves, Rio Grande do Sul. Anais... Porto Alegre: ABRH, 2013. CD-ROM. verified that SYHDA was already a tool with a great potential to be used by technicians in the field of hydrology mainly due to its agility in the development of everyday tasks.
With the advances in the software development, Beskow et al. (2014) BESKOW, S.; MELLO, C. R.; FARIA, L. C.; SIMÕES, M. C.; CALDEIRA, T. L.; NUNES, G. S. Índices de sazonalidade para regionalização hidrológica de vazões de estiagem no Rio Grande do Sul. Revista Brasileira de Engenheira Agrícola e Ambiental, v. 17, n. 7, p. 748-754, 2014. http://dx.doi.org/10.1590/S1415-43662014000700012.
http://dx.doi.org/10.1590/S1415-4366201...
used SYHDA to organize and handle 108 daily average streamflows series, generate flow-duration curves considering one and two annual periods, obtain the reference streamflows (Q 90), and compute different seasonality measures. The authors aimed to study the variability of seasonality measures associated with drought streamflows in the state of Rio Grande do Sul with the aid of SYHDA, given the number of series analyzed and the complexity involved.
After the implementation of the probabilistic modeling module in SYHDA, some researchers ( BESKOW et al., 2015 BESKOW, S.; CALDEIRA, T. L.; MELLO, C. R.; FARIA, L. C.; GUEDES, H. A. S. Multiparameter probability distributions for heavy rainfall modeling in extreme southern Brazil. Journal of Hydrology: Regional Studies, v. 4, p. 123-133, 2015. ; CALDEIRA et al., 2015 CALDEIRA, T. L.; BESKOW, S.; MELLO, C. R.; FARIA, L. C.; SOUZA, M. R.; GUEDES, H. A. S. Modelagem probabilística de eventos de precipitação extrema no estado do Rio Grande do Sul. Revista Brasileira de Engenharia Agrícola e Ambiental , v. 19, n. 3, p. 197-203, 2015. http://dx.doi.org/10.1590/1807-1929/agriambi.v19n3p197-203.
http://dx.doi.org/10.1590/1807-1929/agr...
) have reported results obtained with the aid of it for studies concerning statistical hydrology. These studies were feasible especially due to the use of SYHDA, which was extensively tested in its most diverse development phases. The software presented agility since the stages of organization of daily rainfall series and structuration of annual maximum daily rainfall series are quite laborious and time consuming, especially when performed several times. In addition, the intrinsic mathematical complexity in the probabilistic modeling of hydrological variables, primarily in the study developed by Beskow et al. (2015) BESKOW, S.; CALDEIRA, T. L.; MELLO, C. R.; FARIA, L. C.; GUEDES, H. A. S. Multiparameter probability distributions for heavy rainfall modeling in extreme southern Brazil. Journal of Hydrology: Regional Studies, v. 4, p. 123-133, 2015. , is no longer a limiting factor for a large-scale application of state-of-the-art methodologies.
Following the research conducted by Beskow et al. (2014) BESKOW, S.; MELLO, C. R.; FARIA, L. C.; SIMÕES, M. C.; CALDEIRA, T. L.; NUNES, G. S. Índices de sazonalidade para regionalização hidrológica de vazões de estiagem no Rio Grande do Sul. Revista Brasileira de Engenheira Agrícola e Ambiental, v. 17, n. 7, p. 748-754, 2014. http://dx.doi.org/10.1590/S1415-43662014000700012.
http://dx.doi.org/10.1590/S1415-4366201...
, Beskow et al. (2016a) BESKOW, S.; MELLO, C. R.; VARGAS, M. M.; CORRÊA, L. L.; CALDEIRA, T. L.; DURÃES, M. F.; AGUIAR, M. S. Artificial intelligence techniques coupled with seasonality measures for hydrological regionalization of Q90 under Brazilian conditions. Journal of Hydrology, v. 541, p. 1406-1419, 2016a. http://dx.doi.org/10.1016/j.jhydrol.2016.08.046.
http://dx.doi.org/10.1016/j.jhydrol.201...
assessed different Artificial Intelligence techniques for determining hydrologically homogeneous regions for the regionalization of Q90 in the state of Rio Grande do Sul. In that study, the authors applied SYHDA to evaluate the homogeneity of regions in accordance with the regional heterogeneity test (H) and discordancy measure (D) proposed by Hosking and Wallis (1997) HOSKING, J. R. M.; WALLIS, J. R. Regional frequency analysis: an approach based on L-moments. Cambridge: Cambridge University Press, 1997. 224 p. http://dx.doi.org/10.1017/CBO9780511529443.
http://dx.doi.org/10.1017/CBO9780511529...
. This stage was only possible after implementing such tests in SYHDA, which would not probably be applied manually. It is worthwhile to mention that the authors do not know other specific softwares that make available these tests along with functionalities for acquisition and analysis of hydrological data.
In the studies of Cassalho et al. (2017) CASSALHO, F.; BESKOW, S.; VARGAS, M. M.; MOURA, M. M.; ÁVILA, L. F.; MELLO, C. R. Hydrological regionalization of maximum stream flows using an approach based on L-moments. Revista Brasileira de Recursos Hídricos, v. 22, 2017. , Cassalho et al. (2018a) CASSALHO, F.; BESKOW, S.; MELLO, C. R.; MOURA, M. M.; KERSTNER, L.; ÁVILA, L. F. At-site flood frequency analysis coupled with multiparameter probability distributions. Water Resources Management, v. 32, n. 1, p. 285-300, 2018a. http://dx.doi.org/10.1007/s11269-017-1810-7.
http://dx.doi.org/10.1007/s11269-017-18...
, and Cassalho et al. (2018b) CASSALHO, F.; BESKOW, S.; MELLO, C. R.; MOURA, M. M. Regional Flood Frequency Analysis using L-moments for geographically defined regions: an assessment Brazil. Journal of Flood Risk Management, p. e12453, 2018b. http://dx.doi.org/10.1111/jfr3.12453.
http://dx.doi.org/10.1111/jfr3.12453 ...
, SYHDA was widely used and evaluated considering at-site and regional modeling of maximum annual streamflows in watersheds located in Rio Grande do Sul by means of approaches based on the L-Moments method. Cassalho et al. (2017) CASSALHO, F.; BESKOW, S.; VARGAS, M. M.; MOURA, M. M.; ÁVILA, L. F.; MELLO, C. R. Hydrological regionalization of maximum stream flows using an approach based on L-moments. Revista Brasileira de Recursos Hídricos, v. 22, 2017. developed a tool through a regional function based on traditional techniques adopted in Brazil, however, the authors appraised multi-parameter probability distributions in a complementary way to those traditionally used to estimate maximum annual streamflows and their return periods in watersheds in southern Rio Grande do Sul State. Cassalho et al. (2018a) CASSALHO, F.; BESKOW, S.; MELLO, C. R.; MOURA, M. M.; KERSTNER, L.; ÁVILA, L. F. At-site flood frequency analysis coupled with multiparameter probability distributions. Water Resources Management, v. 32, n. 1, p. 285-300, 2018a. http://dx.doi.org/10.1007/s11269-017-1810-7.
http://dx.doi.org/10.1007/s11269-017-18...
proposed a methodology for at-site flood frequency analysis taking into account watersheds of different regions in Rio Grande do Sul State. Cassalho et al. (2018b) CASSALHO, F.; BESKOW, S.; MELLO, C. R.; MOURA, M. M. Regional Flood Frequency Analysis using L-moments for geographically defined regions: an assessment Brazil. Journal of Flood Risk Management, p. e12453, 2018b. http://dx.doi.org/10.1111/jfr3.12453.
http://dx.doi.org/10.1111/jfr3.12453 ...
continued the previous study applying all the steps of the regional flood frequency analysis (RFFA) suggested by Hosking and Wallis (1997) HOSKING, J. R. M.; WALLIS, J. R. Regional frequency analysis: an approach based on L-moments. Cambridge: Cambridge University Press, 1997. 224 p. http://dx.doi.org/10.1017/CBO9780511529443.
http://dx.doi.org/10.1017/CBO9780511529...
, which are currently implemented in SYHDA, in the hydrographical regions delineated by ANA for the state of Rio Grande do Sul. The authors proposed an evaluation of the index-flood methodology based on L-moments for regionalization of maximum streamflows.
Considering the studies of Cassalho et al. (2017) CASSALHO, F.; BESKOW, S.; VARGAS, M. M.; MOURA, M. M.; ÁVILA, L. F.; MELLO, C. R. Hydrological regionalization of maximum stream flows using an approach based on L-moments. Revista Brasileira de Recursos Hídricos, v. 22, 2017. , Cassalho et al. (2018a) CASSALHO, F.; BESKOW, S.; MELLO, C. R.; MOURA, M. M.; KERSTNER, L.; ÁVILA, L. F. At-site flood frequency analysis coupled with multiparameter probability distributions. Water Resources Management, v. 32, n. 1, p. 285-300, 2018a. http://dx.doi.org/10.1007/s11269-017-1810-7.
http://dx.doi.org/10.1007/s11269-017-18...
, and Cassalho et al. (2018b) CASSALHO, F.; BESKOW, S.; MELLO, C. R.; MOURA, M. M. Regional Flood Frequency Analysis using L-moments for geographically defined regions: an assessment Brazil. Journal of Flood Risk Management, p. e12453, 2018b. http://dx.doi.org/10.1111/jfr3.12453.
http://dx.doi.org/10.1111/jfr3.12453 ...
, SYHDA supported the application of traditional and multi-parameter probability distributions according to at-site and regional approaches, simple and robust goodness-of-fit tests for at-site analysis, regional heterogeneity measure H, discordancy measure D, and regional goodness-of-fit test Z.
In addition, the existing functionalities in SYHDA allow a large number of simple and complex applications in hydrological engineering, thus complementing the functionalities found in other softwares available for hydrological analyses, such as HIDRO, SisCAH, ALEA, SEAF, and Hydrognomon.
Considering the different studies presented in this section, the large-scale applicability of SYHDA stands out, i.e., the possibility of carrying out laborious and complex analyses in a repetitive way for a large set of hydrological series. Furthermore, SYHDA has demonstrated potential not only for allowing the user to perform such tasks, but also for running them from ANA and INMet databases structured in SYHDA for the hydrological variable, time step, and failure threshold defined by the user.
Based on the discussions presented in this technical note, the authors highlight that SYHDA: i) has an intuitive user-interface that is easy to use when compared to tools that use programming languages by means of commands or scripts; ii) provides agility and reliability in importing, handling, and structuring hydrological series for different time steps and failure thresholds, considering the main national databases applied to hydrology; iii) allows the user quickly analyzing hydrological series by means of descriptive statistics and graphical tools, in addition to identifying whether they follow the basic premises for application in hydrological modeling; iv) has a seasonality analysis module with a great potential for using streamflow seasonality measures in studies of hydrological regionalization; v) makes available an at-site and regional probabilistic modeling module that promotes the use of multi-parameter distributions (e.g. GEV, Kappa, and Wakeby), more robust goodness-of-fit tests, and regional heterogeneity and discordancy tests, which are not frequently used in studies developed in Brazil; vi) presents a great potential to be used in both everyday and complex activities demanded by the scientific and technical community of hydrology and related areas.
The research group intends to keep improving and updating SYHDA by incoporating various functionalities, such as Mann-Kendall test ( MANN, 1945 MANN, H. B. Non-parametric test against trend. Econometrica, v. 13, n. 3, p. 245-259, 1945. http://dx.doi.org/10.2307/1907187.
http://dx.doi.org/10.2307/1907187 ...
; KENDALL, 1975 KENDALL, M. G. Rank correlation methods. 4th ed. London: Charles Griffin, 1975. ), procedures for filling gaps in hydrological series, techniques for representation and fitting of intensity-duration-frequency curves, and possibility of using a batch of files (hydrological series).
SYHDA download
A trial version will be available on the website of the Research Group on Hydrology and Hydrological Modeling in Watersheds/CNPq of the Federal University of Pelotas ( RESEARCH GROUP ON HYDROLOGY AND HYDROLOGICAL MODELING IN WATERSHEDS, 2018 RESEARCH GROUP ON HYDROLOGY AND HYDROLOGICAL MODELING IN WATERSHEDS. Hidrologia e modelagem hidrológica em bacias hidrográficas. Pelotas: UFPEL, 2018. Available from: <https://wp.ufpel.edu.br/hidrologiaemodelagemhidrologica/>. Access on: 17 jan. 2018.
https://wp.ufpel.edu.br/hidrologiaemode...
).
ACKNOWLEDGEMENTS
The authors wish to thank the Universidade Federal de Pelotas (UFPel) for scholarship to the first author, Conselho Nacional de Desenvolvimento Científico e Tecnológico (CNPq) for scholarships to the second (308645/2017-0) and fifth authors, and Fundação de Amparo à Pesquisa do Estado do Rio Grande do Sul (FAPERGS) for research grant (16/2551-0000 247-9) to the second author.
REFERENCES
- ANA – Agência Nacional das Águas; SIH – Superintendência de Informações Hidrológicas. Hidro: sistema de informações hidrológicas. Brasília: ANA; 2002.
- ANDERSON, T. W.; DARLING, D. A. A test of goodness of fit. Journal of the American Statistical Association, v. 49, n. 268, p. 756-769, 1954. http://dx.doi.org/10.1080/01621459.1954.10501232.
» http://dx.doi.org/10.1080/01621459.1954.10501232 - BESKOW, S.; CALDEIRA, T. L.; MELLO, C. R.; FARIA, L. C.; GUEDES, H. A. S. Multiparameter probability distributions for heavy rainfall modeling in extreme southern Brazil. Journal of Hydrology: Regional Studies, v. 4, p. 123-133, 2015.
- BESKOW, S.; CORRÊA, L. L.; MAHL, M.; SIMÕES, M. C.; CALDEIRA, T. L.; NUNES, G. S.; LUCAS, E. H.; FARIA, L. C.; MELLO, C. R. Desenvolvimento de um sistema computacional de aquisição e análise de dados hidrológicos. In: SIMPÓSIO BRASILEIRO DE RECURSOS HÍDRICOS, 20., 2013, Bento Gonçalves, Rio Grande do Sul. Anais... Porto Alegre: ABRH, 2013. CD-ROM.
- BESKOW, S.; MELLO, C. R.; FARIA, L. C.; SIMÕES, M. C.; CALDEIRA, T. L.; NUNES, G. S. Índices de sazonalidade para regionalização hidrológica de vazões de estiagem no Rio Grande do Sul. Revista Brasileira de Engenheira Agrícola e Ambiental, v. 17, n. 7, p. 748-754, 2014. http://dx.doi.org/10.1590/S1415-43662014000700012.
» http://dx.doi.org/10.1590/S1415-43662014000700012 - BESKOW, S.; MELLO, C. R.; NORTON, L. D.; SILVA, A. M. Performance of a distributed semi-conceptual hydrological model under tropical watershed conditions. Catena, v. 86, n. 3, p. 160-171, 2011. http://dx.doi.org/10.1016/j.catena.2011.03.010.
» http://dx.doi.org/10.1016/j.catena.2011.03.010 - BESKOW, S.; MELLO, C. R.; VARGAS, M. M.; CORRÊA, L. L.; CALDEIRA, T. L.; DURÃES, M. F.; AGUIAR, M. S. Artificial intelligence techniques coupled with seasonality measures for hydrological regionalization of Q90 under Brazilian conditions. Journal of Hydrology, v. 541, p. 1406-1419, 2016a. http://dx.doi.org/10.1016/j.jhydrol.2016.08.046.
» http://dx.doi.org/10.1016/j.jhydrol.2016.08.046 - BESKOW, S.; TIMM, L. C.; TAVARES, V. E. Q.; CALDEIRA, T. L.; AQUINO, L. S. Potential of the LASH model for water resources management in data-scarce basins: a case study of Fragata River Basin, Southern Brazil. Hydrological Sciences Journal, v. 61, n. 14, p. 2567-2578, 2016b. http://dx.doi.org/10.1080/02626667.2015.1133912.
» http://dx.doi.org/10.1080/02626667.2015.1133912 - BURN, D. H.; ZRINJI, Z.; KOWALCHUK, M. Regionalization of catchments for regional flood frequency analysis. Journal of Hydrologic Engineering, v. 2, n. 2, p. 76-82, 1997. http://dx.doi.org/10.1061/(ASCE)1084-0699(1997)2:2(76).
» http://dx.doi.org/10.1061/(ASCE)1084-0699(1997)2:2(76) - CALDEIRA, T. L.; BESKOW, S.; MELLO, C. R.; FARIA, L. C.; SOUZA, M. R.; GUEDES, H. A. S. Modelagem probabilística de eventos de precipitação extrema no estado do Rio Grande do Sul. Revista Brasileira de Engenharia Agrícola e Ambiental , v. 19, n. 3, p. 197-203, 2015. http://dx.doi.org/10.1590/1807-1929/agriambi.v19n3p197-203.
» http://dx.doi.org/10.1590/1807-1929/agriambi.v19n3p197-203 - CALDEIRA, T. L.; MELLO, C. R.; BESKOW, S.; TIMM, L. C.; VIOLA, M. R. LASH hydrological model: an analysis focused on spatial discretization. Catena, v. 173, p. 183-193, 2019. http://dx.doi.org/10.1016/j.catena.2018.10.009.
» http://dx.doi.org/10.1016/j.catena.2018.10.009 - CÂNDIDO, M. O. SEAF – Um protótipo de um sistema especialista para análise de frequência local de eventos hidrológicos máximos anuais 2003. 194 f. Dissertação (Mestrado em Saneamento) - Universidade Federal de Minas Gerais, Belo Horizonte, 2003.
- CASSALHO, F.; BESKOW, S.; MELLO, C. R.; MOURA, M. M.; KERSTNER, L.; ÁVILA, L. F. At-site flood frequency analysis coupled with multiparameter probability distributions. Water Resources Management, v. 32, n. 1, p. 285-300, 2018a. http://dx.doi.org/10.1007/s11269-017-1810-7.
» http://dx.doi.org/10.1007/s11269-017-1810-7 - CASSALHO, F.; BESKOW, S.; MELLO, C. R.; MOURA, M. M. Regional Flood Frequency Analysis using L-moments for geographically defined regions: an assessment Brazil. Journal of Flood Risk Management, p. e12453, 2018b. http://dx.doi.org/10.1111/jfr3.12453.
» http://dx.doi.org/10.1111/jfr3.12453 - CASSALHO, F.; BESKOW, S.; VARGAS, M. M.; MOURA, M. M.; ÁVILA, L. F.; MELLO, C. R. Hydrological regionalization of maximum stream flows using an approach based on L-moments. Revista Brasileira de Recursos Hídricos, v. 22, 2017.
- FILLIBEN, J. J. The probability plot correlation coefficient test for normality. Technometrics, v. 17, n. 1, p. 111-117, 1975. http://dx.doi.org/10.1080/00401706.1975.10489279.
» http://dx.doi.org/10.1080/00401706.1975.10489279 - GUMBEL, E. J. Statistics of extremes New York: Columbia University Press, 1958. 375 p.
- HOSKING, J. R. M. Fortran routines for use with the method of L-moments Version 3.04. IBM Research, 2005. 33 p. Available from: <http://lib.stat.cmu.edu/general/lmoments>. Access on: 05 sept. 2018.
» http://lib.stat.cmu.edu/general/lmoments - HOSKING, J. R. M.; WALLIS, J. R. Regional frequency analysis: an approach based on L-moments. Cambridge: Cambridge University Press, 1997. 224 p. http://dx.doi.org/10.1017/CBO9780511529443.
» http://dx.doi.org/10.1017/CBO9780511529443 - KENDALL, M. G. Rank correlation methods 4th ed. London: Charles Griffin, 1975.
- KOLMOGOROV, A. N. Grundbegriffe der wahrscheinlichkeitrechnung. Ergbnisse der Mathematik, 1933. 2nd ed. New York: Chelsea Publishing Company, 1956. English translation: Foundations of the theory of probability.
- KOZANIS, S.; CHRISTOFIDES, A.; MAMASSIS, N.; EFSTRATIADIS, A.; KOUTSOYIANNIS, D. Hydrognomon - open source software for the analysis of hydrological data. European Geosciences Union General Assembly. Geophysical Research Abstracts, v. 12, p. 12419, 2010.
- LAAHA, G. Modeling summer and winter droughts as a basis for estimating river low flows. In: 4th International Conference Held in Cape Town, FRIEND 2002 - Regional Hydrology: Bridging the Gap between Research and Practice, 4., 2002, South Africa. Proceedings… South Africa: IAHS. p. 289-295, 2002.
- LAAHA, G.; BLÖSCHL, G. Seasonality indices for regionalizing low flows. Hydrological Processes, v. 20, n. 18, p. 3851-3878, 2006. http://dx.doi.org/10.1002/hyp.6161.
» http://dx.doi.org/10.1002/hyp.6161 - MANN, H. B. Non-parametric test against trend. Econometrica, v. 13, n. 3, p. 245-259, 1945. http://dx.doi.org/10.2307/1907187.
» http://dx.doi.org/10.2307/1907187 - MANN, H. B.; WHITNEY, D. R. On the test of whether one of two random variables is stochastically larger than the other. Annals of Mathematical Statistics, v. 18, n. 1, p. 50-60, 1947. http://dx.doi.org/10.1214/aoms/1177730491.
» http://dx.doi.org/10.1214/aoms/1177730491 - NAGHETTINI, M. Fundamentals of statistical hydrology Springer International Publishing, 2017. http://dx.doi.org/10.1007/978-3-319-43561-9.
» http://dx.doi.org/10.1007/978-3-319-43561-9 - PEARSON, K. On the criterion that a given system of deviations from the probable in the case of a correlated system of variables is such that it can be reasonably supposed to have arisen from random sampling. Philosophical Magazine, v. 50, p. 157-175, 1900.
- RESEARCH GROUP ON HYDROLOGY AND HYDROLOGICAL MODELING IN WATERSHEDS. Hidrologia e modelagem hidrológica em bacias hidrográficas Pelotas: UFPEL, 2018. Available from: <https://wp.ufpel.edu.br/hidrologiaemodelagemhidrologica/>. Access on: 17 jan. 2018.
» https://wp.ufpel.edu.br/hidrologiaemodelagemhidrologica/ - SMIRNOV, N. Table for estimating the goodness-of-fit of empirical distributions. Annals of Mathematical Statistics, v. 19, n. 2, p. 279-281, 1948. http://dx.doi.org/10.1214/aoms/1177730256.
» http://dx.doi.org/10.1214/aoms/1177730256 - SPEARMAN, C. The proof and measurement of association between two things. The American Journal of Psychology, v. 15, n. 1, p. 72-101, 1904. http://dx.doi.org/10.2307/1412159. PMid:3322052.
» http://dx.doi.org/10.2307/1412159 - UFMG – Universidade Federal de Minas Gerais. Downloads Belo Horizonte: Departamento de Engenharia Hidráulica e Recursos Hídricos, 2012. Available from: <http://www.ehr.ufmg.br/downloads>. Access on: 06 maio 2018.
» http://www.ehr.ufmg.br/downloads - UFV – Universidade Federal de Viçosa. Programas desenvolvidos pelo grupo de pesquisa em recursos hídricos da UFV Viçosa: UFV, 2008. Available from: <http://www.ufv.br/dea/gprh>. Access on: 03 ago. 2017.
» http://www.ufv.br/dea/gprh - ULLMANN, J.E. A review of: “Statistics of Extremes” By Emil J. Gumbel Columbia University Press New York, 1958 375 pp. Engineering Economist: A Journal Devoted to the Problems of Capital Investment, v. 7, n. 1, p. 36-38, 1961.
- VIOLA, M. R.; MELLO, C. R.; BESKOW, S.; NORTON, L. D. Applicability of the LASH Model for Hydrological Simulation of the Grande River Basin, Brazil. Journal of Hydrologic Engineering , v. 18, n. 12, p. 1639-1652, 2013. http://dx.doi.org/10.1061/(ASCE)HE.1943-5584.0000735.
» http://dx.doi.org/10.1061/(ASCE)HE.1943-5584.0000735 - VIOLA, M. R.; MELLO, C. R.; BESKOW, S.; NORTON, L. D. Impacts of land-use changes on the hydrology of the Grande river basin headwaters, Southeastern, Brazil. Water Resources Management , v. 28, n. 13, p. 4537-4550, 2014. http://dx.doi.org/10.1007/s11269-014-0749-1.
» http://dx.doi.org/10.1007/s11269-014-0749-1 - WALD, A.; WOLFOWITZ, J. An exact test for randomness in the non-parametric case based on serial correlation. Annals of Mathematical Statistics, v. 14, n. 4, p. 378-388, 1943. http://dx.doi.org/10.1214/aoms/1177731358.
» http://dx.doi.org/10.1214/aoms/1177731358
Publication Dates
-
Publication in this collection
18 Feb 2019 -
Date of issue
2019
History
-
Received
05 Sept 2018 -
Reviewed
05 Nov 2018 -
Accepted
18 Dec 2018


