
ABSTRACT
Sediments are important to nutrient dynamics, especially due to phosphorus internal loading. Several studies have observed that internal loading could prevent water quality from improving in lakes, even when external phosphorus loading is significantly decreased. Therefore, there is an urgent need to assess the potential release of phosphorus contained in the sediment, and thus, its potential to impact water quality. In this study, the vertical and horizontal distributions of distinct phosphorus forms in the bottom sediments of artificial reservoirs, located at Forquilha watershed (Ceará, Brazil), were investigated through sequential chemical fractionation. The reservoirs Lagoa Cercada (R#1), Riacho do Algodão (R#2), Riacho Verde (R#3), Cachoeira (R#4), Chagas Manu (R#5), Quandu (R#6) and Balanças (R#7) were investigated. Reservoirs R#1 (most downstream reservoir of the watershed) and R#7 (most upstream reservoir of the watershed) had higher concentrations of total phosphorus (PT) and lower pH values, potentially exerting greater influence in phosphorus concentration in the water column. Reservoirs R#3 and R#4 presented a predominance of residual phosphorus (PRe), the least available fractions of phosphorus and thus, presented a lower potential for internal loading. Reservoirs R#5, R#1 and R#2 showed a tendency of decreasing total phosphorus (PT) as the sediment depth increased, probably indicating an increase of allochthonous phosphorus loading along time. Reservoir R#6 showed the predominance of PFeAl and PCa fractions on points A and B, respectively, showing that the characteristics of the sediments may vary in the same reservoir. Mobile (PM) and iron and aluminum-bound phosphorus (PFeAl) were the least and the most abundant fractions in most of the samples analyzed, respectively.
Keywords:
Water quality; Bottom sediment; Phosphorus availability; Eutrophication potential
RESUMO
Sedimentos são importantes para a dinâmica de nutrientes em reservatórios, especialmente devido à recarga interna de fósforo. Vários estudos observaram que a recarga interna pode impedir a melhoria da qualidade da água em lagos, mesmo quando a carga externa é reduzida. Assim, há uma necessidade urgente de avaliar o potencial de liberação de fósforo do sedimento e, portanto, seu potencial para impactar a qualidade da água. Neste estudo, as distribuições verticais e horizontais de diferentes frações de fósforo nos sedimentos de fundo de reservatórios artificiais, localizados na bacia de Forquilha (Ceará, Brasil), foram investigadas através de fracionamento químico sequencial. Os reservatórios da Lagoa Cercada (R#1), Riacho do Algodão (R#2), Riacho Verde (R#3), Cachoeira (R#4), Chagas Manu (R#5), Quandu (R#6) e Balanças (R#7) foram investigados. Os reservatórios R#1 (reservatório mais a jusante) e R#7 (reservatório mais a montante) apresentaram maiores concentrações de fósforo total (PT) e menores valores de pH, potencialmente exercendo um maior impacto na concentração de fósforo na coluna de água. Os reservatórios R#3 e R#4 apresentaram predomínio de frações de fósforo menos disponíveis (PCa) e, portanto, menor potencial de recarga interna. Os reservatórios R#5, R#1 e R#2 apresentaram uma tendência de diminuição do fósforo total (PT) à medida que a profundidade do sedimento aumentou, provavelmente indicando um aumento no fósforo alóctone recebido pelo reservatório ao longo do tempo. O reservatório R # 6 apresentou predominância das frações PFeAl e PCa nos pontos A e B, respectivamente, mostrando que as características do sedimento podem variar no mesmo reservatório. O fósforo móvel (PM) e o fósforo ligado a ferro e alumínio (PFeAl) foram as frações de menor e maior abundância na maioria das amostras analisadas, respectivamente.
Palavras-chave:
Qualidade da água; Sedimento de fundo; Disponibilidade de fósforo; Potencial de eutrofização
INTRODUCTION
In superficial water bodies, phosphorus (P) has been recognized as the limiting nutrient of primary productivity (Kaiserli et al., 2002Kaiserli, A., Voutsa, D., & Samara, C. (2002). Phosphorus fractionation in lake sediments - Lakes Volvi and Koronia, N. Greece. Chemosphere, 46(8), 1147-1155. PMid:11951980. http://dx.doi.org/10.1016/S0045-6535(01)00242-9.
http://dx.doi.org/10.1016/S0045-6535(01)...
). Besides the external loading of nutrients, caused mainly by human activities, the internal loading from the bottom sediment can markedly contribute to the increase of the lake´s trophic state. According to Søndergaard et al. (2003)Søndergaard, M., Jensen, J. P., & Jeppesen, E. (2003). Role of sediment and internal loading of phosphorus in shallow lakes. Hydrobiologia, 506-509(1-3), 135-145. http://dx.doi.org/10.1023/B:HYDR.0000008611.12704.dd.
http://dx.doi.org/10.1023/B:HYDR.0000008...
, sediment plays an important role in nutrient dynamics in shallow lakes. The authors observed that in reservoirs where the external contribution was low, the internal loading of phosphorus (P) prevented the improvement of water quality. In many situations, the concentration of only one fraction of P in the sediment was 100 times greater than the total concentration of P in the water. In some water bodies, a substantial internal loading may continue for decades as phosphorus can be released from sediments with depths as deep as 20 cm (Pettersson, 1998Pettersson, K. (1998). Mechanisms for internal loading of phosphorus in lakes. Hydrobiologia, 373, 21-25. http://dx.doi.org/10.1023/A:1017011420035.
http://dx.doi.org/10.1023/A:101701142003...
). Pettersson (1998)Pettersson, K. (1998). Mechanisms for internal loading of phosphorus in lakes. Hydrobiologia, 373, 21-25. http://dx.doi.org/10.1023/A:1017011420035.
http://dx.doi.org/10.1023/A:101701142003...
also found that the amounts of P present in sediments are several orders of magnitude higher than that in the water column. This means that, even if only a small amount of P in the sediment is released, there will be a significant effect on the P concentration in water.
Considering that surface reservoirs are the most important source of water for Northeastern Brazil, it is necessary to evaluate the potential of P release from the bottom sediment into the water column, and thus its impact on water quality. This investigation was carried out in the Forquilha river experimental watershed, located in Ceará state – Brazil. The aims of this study were:
-
To evaluate the potential of P loading from the bottom sediment to the water column at different locations within the reservoir and along the watershed through sequential chemical fractionation of P;
-
To determine the contribution of each P fraction to the total P present in the sediments;
-
To rank the seven reservoirs in the experimental watershed according to their P loading potential and attempt to identify trends to explain the findings.
MATERIAL AND METHODS
Study area
The study area is located in the experimental watershed of Forquilha River, municipality of Quixeramobim, central region of the state of Ceará, Brazil, part of the watershed of the Banabuiú River (Figure 1). The experimental watershed has an area of 221 km2, an average elevation of 315 m and more than 70 surface reservoirs with capacities ranging from 103 to 6.7 x 10⁶ m3. Most of these reservoirs dry out during the dry season (February to May). The climate in the watershed is semiarid; the vegetation is shrub-like, heavily degraded due to the widespread practice of fires for the preparation of areas for agricultural purposes. This region encompasses a geomorphological diversity representative of the crystalline area of the Brazilian semi-arid Northeast.
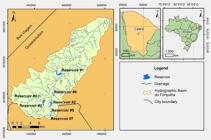
Study area: Experimental watershed of Forquilha in the semi-arid Northeast of Brazil (adapted from Sistema de Referencia Geocentrico para América del Sur, 2000Sistema de Referencia Geocentrico para América del Sur – SIRGAS (2000). Retrieved in 2018, December 01, from http://www.ibge.gov gov.br/sirgas.
http://www.ibge.gov ... ).
The population in Forquilha watershed is structured in 17 communities concentrated in small villages of 20 to 130 families. The main activity is extensive agriculture, especially beans and maize, and extensive livestock farming. Recently, irrigated horticulture and fruit production have been introduced in parts of the watershed thanks to the construction of tubular wells in the valley floodplain, allowing irrigation of areas between 0.5 and 5 hectares. The new farming system is attractive to farmers as they reach a higher level of income. However, the new agricultural system promotes higher consumption of fertilizers and agrochemicals, which has raised concerns in the community about the sustainability of this new agricultural practice and the impact on the environment and population health.
Due to six years of precipitation below the historical average, 129 of the 153 reservoirs monitored by the state`s water resources company, were below 30% of their total capacity in 2016 (Ceará, 2016Ceará. Companhia de Gestão dos Recursos Hídricos. (2016). Water quality monitoring network. Fortaleza: COGERH.). The watershed of Banabuiú, at the time of the experiment, presented only 2% of its maximum capacity. This situation was confirmed in a visit to the experimental watershed where most of the reservoirs were completely dry. In this study, seven reservoirs were chosen due to variables such as location, age and, especially, relevance to the population. The names and acronyms of the reservoirs are presented in Table 1.
Summary of sediment samples collected in stages one and two in seven reservoirs in Ceará state in 2016.
Sampling
Sampling was carried out in two ways, depending on the volume of water found in the reservoir. When the reservoir contained some water, sampling was done with a sediment trap. If the reservoir was completely dry, a block of sediment was removed manually. The sample collection was performed in duplicate within a distance of approximately 30 cm between the same sampling points. Samples were collected from the surface to the matrix rock and subsequently subdivided into layers of approximately 5 cm. Each subsample was then analyzed twice and the results from the four subsamples belonging to the same depth and sampling point were averaged. The subsamples were stored in polyethylene bags labeled with the time of sampling, depth, and geographical coordinates.
In the first sampling campaign (July 2016), samples were collected in 2 points at the Reservoir R#1, three points at Reservoir R#2, and three points at Reservoir R#3 (Table 1 and Figure 2). Duplicates and stratification of each sample yielded 51 samples in total. During the second campaign (September 2016), the same sampling procedure was used, yielding a total of 31 samples: two points at Reservoir R#4, two points at Reservoir R#5, two points at Reservoir R#6, and one point at Reservoir R#7 (Table 1 and Figure 2). The number of samples was defined by the size of the reservoir and accessibility to the sites. Reservoirs R#1, R#6, and R#7 were completely dry, Reservoir R#5 contained no water, but the sediment was wet at the time of sampling.

Sampling points of stages one and two in seven reservoirs in Ceará state, 2016 (Images: Google Earth, 2010Google Earth (February 19, 2010). Eye alt 19133 feet. SIO, NOAA, U.S. Navy, NGA, GEBCO. TerraMetrics 2012, DigitalGlobe 2012. Retrieved in 2018, December 01, from http://www.earth.google.com
http://www.earth.google.com... ).
Sample analysis
Samples were dried for 24 h at 110 °C and stored at 4 °C until analysis. The different P fractions were extracted according to Figure 3. To determine Total phosphorus (PT), samples were heated to 500 °C for 1 h followed by extraction with HCl (1N). For the Inorganic phosphorus (PI), chemical extraction was carried out to obtain mobile phosphorus (PM), iron and aluminum-bound phosphorus (PFeAl), calcium bound phosphorus (PCa) and residual phosphorus (PRe). Organic phosphorus (PO) was estimated by subtracting PI from PT. The method used for chemical P fractioning was based on Silva (1996)Silva, I. S. (1996). Distribuição vertical e fracionamento químico de fósforo em sedimentos do rio tietê (Região de Pirapora do Bom Jesus, São Paulo) (Dissertação de mestrado). Universidade de São Paulo, São Paulo.. The organic matter was evaluated by analyzing organic carbon. Chemicals used were of analytical grade and obtained from Dinâmica and Quimis (Brazil).

The sequence of extraction methods for the different P fractions bound to the sediment. Extraction and analyses were based on Silva (1996)Silva, I. S. (1996). Distribuição vertical e fracionamento químico de fósforo em sedimentos do rio tietê (Região de Pirapora do Bom Jesus, São Paulo) (Dissertação de mestrado). Universidade de São Paulo, São Paulo..
The Pearson product-moment correlation coefficient was used to measure the association between the fraction of P concentrations and other variables. Given paired measurements (X1,Y1), (X2,Y2),, (Xn,Yn), the Pearson product-moment correlation coefficient is a measure of association given by:
Where and are the sample mean of X1, X2, Xn and Y1, Y2, Yn, respectively. The correlation coefficient (a value between -1 and +1) tells you how strongly two variables are related to each other.
RESULTS AND DISCUSSION
To determine the potential of phosphorus (P) internal loading, sediment samples were collected in two campaigns and the P fractions were evaluated. Different P fractions display different behaviors regarding resolubilization potential (Silva, 1996Silva, I. S. (1996). Distribuição vertical e fracionamento químico de fósforo em sedimentos do rio tietê (Região de Pirapora do Bom Jesus, São Paulo) (Dissertação de mestrado). Universidade de São Paulo, São Paulo.). PM is weakly bound or easily dissolved, and the most immediately available form of P. This feature suggests that this should be the fraction most responsible for the internal loading (Olila et al., 1995Olila, O. G., Reddy, K. R., & Harris, W. G. (1995). Forms of distrubtion of inorganic phosphorus in sediments of two shallow eutrophic lakes in Florida. Hydrobiologia, 302(2), 147-161. http://dx.doi.org/10.1007/BF00027039.
http://dx.doi.org/10.1007/BF00027039...
). PFeAl, referred to by Gaspar (2009)Gaspar, F. L. (2009). Análise da concentração de fósforo em sedimentos dos rios Botafogo e Carrapicho, no sistema estuariano do canal de Santa Cruz, Itamaracá, PE (Dissertação de mestrado). Universidade Federal de Pernambuco, Recife. as non-apathetic inorganic P, is considered reactive and bioavailable only when anoxic conditions are prevalent in the aquatic environment, a condition normally found at the hypolimnion of eutrophic lakes. The PCa fraction (carbonates or apatite bound), classified by Silva (1996)Silva, I. S. (1996). Distribuição vertical e fracionamento químico de fósforo em sedimentos do rio tietê (Região de Pirapora do Bom Jesus, São Paulo) (Dissertação de mestrado). Universidade de São Paulo, São Paulo. as apathetic P, it is not considered easily available for internal loading except at very low pH conditions. Williams et al. (1976)Williams, J. D. H., Jaquet, J. M., & Thomas, R. L. (1976). Forms of phosphorusin surficial sediments of Lake Erie. Journal of the Fisheries Research Board of Canada, 33, 413-429. considered PCa mostly allogenic, originating from the erosion of sedimentary rocks.
Influence of pH conditions
Table 2 shows the pH average, standard deviation (SD) and coefficient of variation (CV) across the whole depth at each point. CV across each point´s depth was ≤ 15%, considered a low variability for soil samples, could be attributed to random errors such as sampling, analysis or handling, and represents no considerable variation of pH across different strata at the same point.
Point A at R#5 displayed a pH of 7.1±0.1 and point A at R#1 showed a pH of 4.8 ±0.5, respectively the highest and lowest pH value amongst the seven reservoirs (Table 2). R#1 presented sediment with acidic characteristics while the others presented values from slightly acidic to neutral. According to Ranno et al. (2007)Ranno, S. K., Silva, L. S., & Mallmann, F. J. K. (2007). Fracionamento do fósforo inorgânico em solos de várzea do Rio Grande Do Sul. Revista Brasileira de Agrociências, 13(1), 47-54., neutral and slightly acidic soils usually contain four fractions of phosphorus (PM, PFeAl, PCa, and PRe) in similar amounts while, in alkaline and limestone soils, the PCa fraction is often dominant. In this study, however, no correlation was found between pH and P fractions probably due to the low variability of sediment pH.
Reservoir R#1, the most acidic, presented the larger concentration of organic matter (152.68 ± 9.14 g.Kg-1). According to Ferreira Nunes (2013)Nunes, M. L. F. (2013). Distribuição e fracionamento dos fosforo sedimentos dos Rios Bacanga e Anil na Ilha do Maranhão (Dissertação de mestrado). Universidade Federal do Maranhão, São Luís., water bodies receiving large amounts of organic matter are normally the most acidic and present conditions that are not favorable to P adsorption by clay minerals. In this study, at the most acidic sediment (R#1), the predominant fraction was PFeAl (Figure 4). Machado et al. (1993)Machado, M. I. C. S., Brauner, J. L., & Vianna, A. C. T. (1993). Formas de fósforo na camada arável de solos do Rio Grande do Sul. Revista Brasileira de Ciência do Solo, Campinas, 17(3), 331-336. and Frink (1969)Frink, C. R. (1969). Fractionation of phosphorus in lake sediments: analytical evaluation. Soil Sci. Soc. Am. Proc., 33, 326-328. observed that sediments close to neutral pH, inorganic P was abundant, a trend that was observed in our study as well. PFeAl mobilization is strongly regulated by the redox potential and, an increase in pH may release P due to OH- substitution, which replaces iron-bound phosphate (Premazzi & Provini, 1985Premazzi, G., & Provini, A. (1985). Internal loading in lakes. A different approach to its evaluation. Hydrobiologia, 120, 23-33.).

Average of total phosphorus and its fractions in three reservoirs during the first sampling campaign. The different shadings denote different phosphorus fractions and values on top of the bar represent total phosphorus.
Only in reservoirs R#1 and R#6 sediments were deep enough to attempt a pH versus depth correlation test (Tables A and B at the Supplementary Material). Correlation coefficients showed no consistent trend in the four points evaluated (R#1 Point A = 0.18 and Point B = -0.98; R#6 Point A = -0.79 and Point B = 0.70). Furthermore, considering all points in reservoirs, no consistent correlation trend was found between pH and any fraction of phosphorus.
Vertical distribution of phosphorus on bottom sediment
In the first campaign, the concentration of P decreased as a function of depth (R ≥ -0.79), except for R#3 (Figure 4 and Table A at Supplementary Material). This phenomenon was also observed by Silva (1996)Silva, I. S. (1996). Distribuição vertical e fracionamento químico de fósforo em sedimentos do rio tietê (Região de Pirapora do Bom Jesus, São Paulo) (Dissertação de mestrado). Universidade de São Paulo, São Paulo.. A study by Paula Filho (2004)Paula Filho, F. J. (2004). Distribuição e partição geoquímica de fósforo em sedimentos estuarinos do Rio Jaguaribe/CE (Dissertação de mestrado). Universidade Federal do Ceará, Fortaleza. showed a tendency of higher concentrations of PT, PO, and PI in the upper layers indicating that, in recent years, the water body has significantly retained more P.
In reservoir R#1, PI was the most present in all 13 samples, varying from 49 to 100% (point A) and from 58 to 63% (point B) of the PT. R#1 was also the reservoir that presented the highest concentrations of PT. At point A of R#3, PI also prevailed while point B displayed a balanced concentration between PO and PI and at point C, a higher concentration of PO was observed. This PI concentration decrease and the subsequent PO increase trend from point A to point C was also observed at R#2 (Figure 4 and Table A Supplementary Material). According to Schaefer (2015)Schaefer, G. L. (2015). Retenção e liberação de fósforo em sedimento de fundo de açudes e córregos de pequenas bacias hidrográficas em um assentamento de reforma agrária (Dissertação de mestrado). Universidade Federal de Santa Maria, Santa Maria., in environments with a low influence of anthropic action, organic and inorganic forms are found in similar concentrations.
In R#1 and R#2, PFeAl was the most abundant form of PI (Figure 4 and Table A Supplementary Material), similar to what was found by other investigators (Salomons & Gerritse, 1981Salomons, W., & Gerritse, R. G. (1981). Some observations on the occurrence of phosphorus in recent sediments from western Europe. The Science of the Total Environment, 17, 37-49.; Silva, 1996Silva, I. S. (1996). Distribuição vertical e fracionamento químico de fósforo em sedimentos do rio tietê (Região de Pirapora do Bom Jesus, São Paulo) (Dissertação de mestrado). Universidade de São Paulo, São Paulo.; Paula Filho, 2004; Ranno et al., 2007Ranno, S. K., Silva, L. S., & Mallmann, F. J. K. (2007). Fracionamento do fósforo inorgânico em solos de várzea do Rio Grande Do Sul. Revista Brasileira de Agrociências, 13(1), 47-54.). This fact shows that most of the PI present in these reservoirs are dependent on anoxic conditions in the sediment/water interface to be released into the water column. Additionally, Salomons & Gerritse (1981)Salomons, W., & Gerritse, R. G. (1981). Some observations on the occurrence of phosphorus in recent sediments from western Europe. The Science of the Total Environment, 17, 37-49. demonstrated that whenever PFeAl was the main PI fraction found, most probably it was from allochthonous sources.
In R#3, PCa fraction is the predominant form of PI at points A and B with an average of 29 and 20% of PT, respectively. PCa concentration decreases to 11% of PI and PO was the dominant form at point C (Figure 4 and Table A Supplementary Material). According to Ranno et al. (2007)Ranno, S. K., Silva, L. S., & Mallmann, F. J. K. (2007). Fracionamento do fósforo inorgânico em solos de várzea do Rio Grande Do Sul. Revista Brasileira de Agrociências, 13(1), 47-54., PCa is generally considered the most likely form of P occurring in soils before chemical weathering. PCa was also considered by Williams et al. (1976)Williams, J. D. H., Jaquet, J. M., & Thomas, R. L. (1976). Forms of phosphorusin surficial sediments of Lake Erie. Journal of the Fisheries Research Board of Canada, 33, 413-429. as being of allogeneic or dendritic origin. Therefore, it appears that most of the sediment found in R#3 could be the product of recent erosion. The PM, which is readily available and easily released from the sediment to the water column, was only detected at low concentrations (0 to 6% of PT) in comparison to the other fractions. This was also found to be the case in a study by Ranno et al. (2007)Ranno, S. K., Silva, L. S., & Mallmann, F. J. K. (2007). Fracionamento do fósforo inorgânico em solos de várzea do Rio Grande Do Sul. Revista Brasileira de Agrociências, 13(1), 47-54., where PM concentrations were below the limit of detection of the analysis method used.
In the second sampling campaign (Figure 5 and Table B at Supplementary Material), 14 of the 21 samples (67%) showed a predominance of PI. In R#4, sampling point B of R# 5, and sampling point B of R#6, PI predominated, reaching up to 90% of PT. Point A of R#6 and R#7 had similar values of PI and PO, approximately 50% of the PT for each fraction. Only point A of R#5 displayed a predominance of PO. Concerning the PI composition, reservoir R#7 and point A of R#6 showed a predominance of PFeAl fraction. On the other hand, point B of R#6, PCa was the predominant fraction, showing that the characteristics of the sediment may vary throughout the same reservoir. Point A of R#5 had similar percentages of PFeAl, PCa, and PRe fractions while at point B, PRe was the largest fraction (50%). Sediments in R#5 contained P fractions less available to the water of both campaigns, probably due to its relatively new age (less than 6 years old).

Average of total phosphorus and its fractions in four reservoirs during the second sampling campaign. The different shadings denote different phosphorus fractions and values on top of the bar represent total phosphorus.
The least available P fraction (PRe) dominated at R#4 and in point B of R#5, a phenomenon not observed in the first sampling campaign. The PM was the fraction with the lowest concentrations in all samples in both sampling campaigns ((Figure 5 and Table B at Supplementary Material).
Longitudinal distribution of phosphorus on bottom sediment
According to Morris & Fan (2010)Morris, L. G., & Fan, J. (2010). Reservoir sedimentatin handbook: design and management of dams, reservoir, and watersheds for sustainable use (pp. 805). USA: McGraw Hill Professional., most sediments enter reservoirs as a consequence of rainfall erosion and subsequent transport by streams. For the analysis of the longitudinal distribution of P, only the concentration in the upper layer of the sediment (top 5 cm) of each reservoir was considered. This layer of sediment was the most affected by the recent transport of sediments. Source data for the analysis presented in this topic can be found in Table 3.
Summary of sediment characteristics of the upper layers (Top 5 cm) in the studied reservoirs.
Reservoirs R#1 and R#7 are the most downstream and upstream of the watershed, respectively. R#1 presented the highest concentrations of PT in the superficial sediment (940 ± 82.8 mg.kg-1), followed by the R#7 reservoir (815.8 mg.kg-1). Reservoirs R#4 and R#3 are also located upstream in the Forquilha watershed but in different sub-watersheds than R#7, thus none of them receive a contribution from the other reservoirs. Additionally, they have different construction ages (Table 3), which makes it difficult to compare their contributions to the other reservoirs.
Reservoirs R#7, R#5 and R#2 are in cascade (in this sequence), which allows them to transfer nutrients from the upstream to the downstream reservoir during rainy seasons (DE Lima; Severi, 2014Lima, A. E., & Severi, W. (2014). Estado trófico na cascata de reservatórios de um rio no semiárido brasileiro. Revista Brasileirade Ciencias Agrarias, 9(1), 124-133. http://dx.doi.org/10.5039/agraria.v9i1a2603.
http://dx.doi.org/10.5039/agraria.v9i1a2...
). In the case of this cascade system, neither the lowest concentrations of PT was found at the upstream reservoir (R#7) nor the highest at the downstream reservoir (R#2), opposite of what would be expected (Figure 6). This phenomenon could be attributed to the different ages of construction or to the difference between the reservoir volumes. In this study, reservoirs that were completely dry, such as the R#7, tended to present higher concentrations of PT in the sediment, most likely due to the precipitation of the dissolved P once present in the water column. R#5 is the most recently constructed reservoir and may not be old enough to have contributed to other reservoirs.

Sediments characteristics, phosphorus fractions and total phosphorus in the upper profile in the studied reservoirs.
As the sampling point moved away from R#1, R#2 and R#3 dams, the oldest reservoirs in this study (>10 years), a decrease of PI fraction was observed. The PI fraction is larger in the lacustrine zone, located near the dam, decreasing towards the riverine zone, probably because, in the lacustrine zone, the largest volumes of water are accumulated. Due to high ambient temperatures (annual average 27°C; National Centers for Environmental Information, 2017National Centers for Environmental Information Climate-Data.Org (2017). Global Climate Report - Annual 2017. USA, NCEI, from https://www.ncdc.noaa.gov/sotc/global/201713.
https://www.ncdc.noaa.gov/sotc/global/20...
) thermal stratification is common, resulting in chemical stratification in most reservoirs in Ceará (Freire et al., 2009Freire, R. H. F., Calijuri, M., & Santaella, S. (2009). Longitudinal patterns and variations in water quality in a reservoir in the semiarid region of NE Brazil: responses to hydrological and climatic changes. Acta Limnologica Brasiliensia, 21(2), 251-262.; Santos et al., 2017Santos, J. A., Marins, R. V., Aguiar, J. O., Challar, G., Silva, F. A. T. F., & Lacerda, L. D. (2017). Hydrochemistry and trophic state change in a large reservoir in the Brazilian northeast region under intense drought conditions. Journal of Limnology, 76(1), 41-51. http://dx.doi.org/10.4081/jlimnol.2016.1433.
http://dx.doi.org/10.4081/jlimnol.2016.1...
; Souza et al., 2006Souza, I. V. A., Souza, R. O., Paulino, & W. D. (2006) Análise da Estratificação Térmica e Química. In: Simpósio Brasileiro De Recursos Hídricos. (pp. 01-14) São Paulo: ABRH.). Thus, the hypolimnion near the dam constantly becomes anoxic, releasing the P contained in the sediment, mainly iron and aluminum-bound phosphorus (PFeAl). This may explain the sediment's highest concentrations of PT and the predominance of PFeAl in R#1 and R#2. Also, in reservoirs older than 10 years, PO concentrations represented 44 ± 22% of the PT. According to Santos et al. (2017)Santos, J. A., Marins, R. V., Aguiar, J. O., Challar, G., Silva, F. A. T. F., & Lacerda, L. D. (2017). Hydrochemistry and trophic state change in a large reservoir in the Brazilian northeast region under intense drought conditions. Journal of Limnology, 76(1), 41-51. http://dx.doi.org/10.4081/jlimnol.2016.1433.
http://dx.doi.org/10.4081/jlimnol.2016.1...
, the increased concentration of organic detritus at the bottom of the water column and the subsequent decomposition of this material consumes large amounts of oxygen and induces anoxia at the hypolimnion.
In the more recently-constructed reservoirs (<5 years; R#4 and R#5), probably, the sediment profile is not as well established as in the older reservoirs. Besides, smaller proportions of PO in relation to PT was observed and the PRe was the largest fraction of PI found, indicating that they still have the low potential of P internal recharge. As mentioned before, the study area has been suffering from a severe drought for approximately six years. It has to be considered that the more recently-built reservoirs were constructed during a period of drought. Therefore, it is probable that water contribution from the watershed into these reservoirs was not significant, and thus, low or no contribution of P may have occurred, explaining the low concentrations of PO in R#4 and R#5 and the low concentration of PT in R#4.
Due to the physical limitations of sampling at R#7, only one point was collected, making it unfeasible to analyze the sediment characteristics along the reservoir. Reservoir R#7 had the second-largest concentration of PT in the upper sediment, which may indicate that the nutrients that flowed to this reservoir remained in it and did not contribute to the others.
Where the sediment in the reservoirs was completely dry (R#1, R#6, and R#7), besides having the highest concentrations of PT in the upper layer of sediment (0 to 5 cm), the predominant fraction of P was PFeAl with a (33 ± 7% of PT). Only one point in R#6 (B) showed a dominance of the PCa fraction, considering the average concentration across the layers, (369.9 ± 113.2 mg.kg-1 or 48 ± 15% of PT), albeit with a high degree of variance (Table B at the supplementary files). The dry reservoirs presented the highest concentrations of PT at the superficial layer, from 677 to 940 mg.kg-1, while in the wet reservoirs PT concentrations ranged from 154 to 494 mg.kg-1.
The distribution of P at each reservoir was dependent on the sampling point elevation. In older reservoirs, the higher the elevation of the sampling points, the lower concentration of PT was found, indicating that a nutrient drag from the highest to the lowest point of the watershed may be occurring. As previously mentioned, it was not possible to perform a longitudinal analysis of the other four reservoirs, due to their recent construction and to the short distance between the sampling points.
Figure 7 presents a graphical representation of the P internal recharge potential, based on the average PFeAl concentration found at the upper layer of the sampling point(s) at each reservoir. Although the number of sampling points differs from one reservoir to another, which adds uncertainty to the results, it is the first attempt to translate the huge amount of qualitative and quantitative P data collected into a more comprehensible tool for reservoir managers. Since PFeAl is readily available under anoxic conditions and most reservoirs in Ceará state present this condition in the hypolimnion layer, this P fraction can be considered a good indicator for internal recharge. According to this method, the most downstream reservoir of the watershed (R#1) had the highest potential of P internal recharge, followed by the most upstream reservoir of the watershed (R#7). The newer reservoirs (R#4 and R#5) presented a lower potential for internal recharge, as it would be expected. Contrary to this trend, R#3, considered an old reservoir, displayed a low potential for internal recharge.

A graphical tool for understanding the phosphorus internal recharge potential in the studied reservoirs.
CONCLUSION
Bottom sediments of seven reservoirs in the semiarid Northeast region of Brazil were investigated regarding their phosphorus content and the distribution of the various fractions. Special attention was given to the phosphorous internal loading potential. The easily available PM fractions only accounted for a maximum of 6% of the total phosphorus in the sediment. PI predominated in most of the sediment samples, and the predominant PI fraction was PFeAl, which is considered easily reactive and available mainly in situations of low redox potential, a condition commonly found in the region. PO did not appear to have any relation with the other P forms or organic matter, and no trend was observed. In some reservoirs, the highest P concentrations were observed in the upper layers, indicating an increase in P accumulation in recent years and the potential for internal recharge. The trend of decreasing P as a function of depth was not present in all reservoirs studied. However, this may be attributed to the low depth of sediment collected in four of the seven reservoirs. It is important to note that the same fraction of P does not always dominate the longitudinal extent of the reservoir. The completely dry reservoirs appeared to have a greater concentration of P in the sediments than those with water stored. The dissolved P may have migrated to the sediment when water evaporated, increasing the P concentration in the sediment, but this hypothesis still needs to be proven with further research. Of the seven reservoirs investigated, R#1 had the greatest potential of internal P loading, whereas R#3 and R#4 were the ones with the lowest potential to impact water quality. The location within the watershed and the age of the reservoir may have also contributed to P concentration in the bottom sediment. R#1, located further downstream of the watershed and one of the oldest, presented higher concentrations of P than the other reservoirs. The elevation and location of the sampling point (lacustrine, transition or riverine zone) can also influence the concentrations and the predominant fraction of P.
Supplementary Material
Supplementary material accompanies this paper.
Table A: Concentration (mg.kg-1) of different forms of P of the first sampling campaign at each depth.
Table B: Concentration (mg.kg-1) of different forms of P of the second sampling campaign at each depth.
This material is available as part of the online article from http://www.scielo.br/RBRH
Acknowledgments
The authors would like to thank Fundação Cearense de Meteorologia e Recursos Hídricos (FUNCEME) for their support. This research was funded by FINEP [01.14.0130.00–1107/13 MCTI/FINEP/CT- HIDRO-01/2013], CNPq [304164/2017-8] and CAPES [PROEX].
REFERENCES
- Ceará. Companhia de Gestão dos Recursos Hídricos. (2016). Water quality monitoring network Fortaleza: COGERH.
- Freire, R. H. F., Calijuri, M., & Santaella, S. (2009). Longitudinal patterns and variations in water quality in a reservoir in the semiarid region of NE Brazil: responses to hydrological and climatic changes. Acta Limnologica Brasiliensia, 21(2), 251-262.
- Frink, C. R. (1969). Fractionation of phosphorus in lake sediments: analytical evaluation. Soil Sci. Soc. Am. Proc., 33, 326-328.
- Gaspar, F. L. (2009). Análise da concentração de fósforo em sedimentos dos rios Botafogo e Carrapicho, no sistema estuariano do canal de Santa Cruz, Itamaracá, PE (Dissertação de mestrado). Universidade Federal de Pernambuco, Recife.
- Google Earth (February 19, 2010). Eye alt 19133 feet. SIO, NOAA, U.S. Navy, NGA, GEBCO. TerraMetrics 2012, DigitalGlobe 2012. Retrieved in 2018, December 01, from http://www.earth.google.com
» http://www.earth.google.com - Kaiserli, A., Voutsa, D., & Samara, C. (2002). Phosphorus fractionation in lake sediments - Lakes Volvi and Koronia, N. Greece. Chemosphere, 46(8), 1147-1155. PMid:11951980. http://dx.doi.org/10.1016/S0045-6535(01)00242-9
» http://dx.doi.org/10.1016/S0045-6535(01)00242-9 - Lima, A. E., & Severi, W. (2014). Estado trófico na cascata de reservatórios de um rio no semiárido brasileiro. Revista Brasileirade Ciencias Agrarias, 9(1), 124-133. http://dx.doi.org/10.5039/agraria.v9i1a2603
» http://dx.doi.org/10.5039/agraria.v9i1a2603 - Machado, M. I. C. S., Brauner, J. L., & Vianna, A. C. T. (1993). Formas de fósforo na camada arável de solos do Rio Grande do Sul. Revista Brasileira de Ciência do Solo, Campinas, 17(3), 331-336.
- Morris, L. G., & Fan, J. (2010). Reservoir sedimentatin handbook: design and management of dams, reservoir, and watersheds for sustainable use (pp. 805). USA: McGraw Hill Professional.
- National Centers for Environmental Information Climate-Data.Org (2017). Global Climate Report - Annual 2017 USA, NCEI, from https://www.ncdc.noaa.gov/sotc/global/201713
» https://www.ncdc.noaa.gov/sotc/global/201713 - Nunes, M. L. F. (2013). Distribuição e fracionamento dos fosforo sedimentos dos Rios Bacanga e Anil na Ilha do Maranhão (Dissertação de mestrado). Universidade Federal do Maranhão, São Luís.
- Olila, O. G., Reddy, K. R., & Harris, W. G. (1995). Forms of distrubtion of inorganic phosphorus in sediments of two shallow eutrophic lakes in Florida. Hydrobiologia, 302(2), 147-161. http://dx.doi.org/10.1007/BF00027039
» http://dx.doi.org/10.1007/BF00027039 - Paula Filho, F. J. (2004). Distribuição e partição geoquímica de fósforo em sedimentos estuarinos do Rio Jaguaribe/CE (Dissertação de mestrado). Universidade Federal do Ceará, Fortaleza.
- Pettersson, K. (1998). Mechanisms for internal loading of phosphorus in lakes. Hydrobiologia, 373, 21-25. http://dx.doi.org/10.1023/A:1017011420035
» http://dx.doi.org/10.1023/A:1017011420035 - Premazzi, G., & Provini, A. (1985). Internal loading in lakes. A different approach to its evaluation. Hydrobiologia, 120, 23-33.
- Ranno, S. K., Silva, L. S., & Mallmann, F. J. K. (2007). Fracionamento do fósforo inorgânico em solos de várzea do Rio Grande Do Sul. Revista Brasileira de Agrociências, 13(1), 47-54.
- Salomons, W., & Gerritse, R. G. (1981). Some observations on the occurrence of phosphorus in recent sediments from western Europe. The Science of the Total Environment, 17, 37-49.
- Santos, J. A., Marins, R. V., Aguiar, J. O., Challar, G., Silva, F. A. T. F., & Lacerda, L. D. (2017). Hydrochemistry and trophic state change in a large reservoir in the Brazilian northeast region under intense drought conditions. Journal of Limnology, 76(1), 41-51. http://dx.doi.org/10.4081/jlimnol.2016.1433
» http://dx.doi.org/10.4081/jlimnol.2016.1433 - Schaefer, G. L. (2015). Retenção e liberação de fósforo em sedimento de fundo de açudes e córregos de pequenas bacias hidrográficas em um assentamento de reforma agrária (Dissertação de mestrado). Universidade Federal de Santa Maria, Santa Maria.
- Silva, I. S. (1996). Distribuição vertical e fracionamento químico de fósforo em sedimentos do rio tietê (Região de Pirapora do Bom Jesus, São Paulo) (Dissertação de mestrado). Universidade de São Paulo, São Paulo.
- Sistema de Referencia Geocentrico para América del Sur – SIRGAS (2000). Retrieved in 2018, December 01, from http://www.ibge.gov gov.br/sirgas.
» http://www.ibge.gov - Søndergaard, M., Jensen, J. P., & Jeppesen, E. (2003). Role of sediment and internal loading of phosphorus in shallow lakes. Hydrobiologia, 506-509(1-3), 135-145. http://dx.doi.org/10.1023/B:HYDR.0000008611.12704.dd
» http://dx.doi.org/10.1023/B:HYDR.0000008611.12704.dd - Souza, I. V. A., Souza, R. O., Paulino, & W. D. (2006) Análise da Estratificação Térmica e Química. In: Simpósio Brasileiro De Recursos Hídricos (pp. 01-14) São Paulo: ABRH.
- Williams, J. D. H., Jaquet, J. M., & Thomas, R. L. (1976). Forms of phosphorusin surficial sediments of Lake Erie. Journal of the Fisheries Research Board of Canada, 33, 413-429.
Publication Dates
-
Publication in this collection
17 Apr 2020 -
Date of issue
2020
History
-
Received
22 Feb 2018 -
Reviewed
15 July 2019 -
Accepted
14 Oct 2019


