
Abstract
Accurate quality classification is one of the requirements of the flower market, which is becoming increasing more sophisticated and demanding. However, there is a lack of information regarding how such classification is performed, and it is often conducted in a less empirical and more subjective way. Therefore, this work aimed to compare the efficiency of personal classification (in-person) and using digital images to determine the quality of anthurium cv. Tropical (Anthurium andraeanum Lind.). Three experiments were performed regarding the recording of the images and the display mode of the images and comparing three methods of classifying postharvest quality of anthurium. It was concluded that measurements of colorimetric parameters can be performed anywhere on the spathe, but the period in which the parameters are measured does affect. Evaluators differ in the thoroughness with which they assign grades, and there is no need for prior knowledge to assess quality using images. The L* parameter measured by the colorimeter presented higher correlation with the evaluation of postharvest quality of Anthurium andraeanum Lind. ‘Tropical’. Classification by images can be performed using different electronic devices, and in-person classification is more rigorous than classification conducted using digital images.
Keywords:
Anthurium andraeanum Lind. ‘Tropical’; colorimetry; quality standard; senescence scale; tropical flower
Resumo
A classificação precisa da qualidade é um dos requisitos do mercado de flores, que está se tornando cada vez mais sofisticado e exigente. No entanto, há uma falta de informações sobre como essa classificação é realizada, e muitas vezes é conduzida de maneira menos empírica e mais subjetiva. Portanto, este trabalho teve como objetivo comparar a eficiência da classificação pessoal (in-person) e usando imagens digitais para determinar a qualidade de flores de antúrio ‘Tropical’. Foram realizados três experimentos quanto ao registro das imagens e ao modo de exibição das imagens e comparando três métodos de classificação da qualidade pós-colheita do antúrio. Concluiu-se que as medidas dos parâmetros colorimétricos podem ser realizadas em qualquer lugar da espata, mas o período em que os parâmetros medidos são afetados pela senescência. Os avaliadores diferem na precisão com que atribuem notas e não há necessidade de conhecimento prévio para avaliar a qualidade usando imagens. O parâmetro L* medido pelo colorímetro apresentou maior correlação com a avaliação da qualidade pós-colheita de Anthurium andraeanum Lind. ‘Tropical’. A classificação por imagens pode ser realizada usando diferentes dispositivos eletrônicos, e a classificação in-person é mais rigorosa do que a classificação realizada com imagens digitais.
Palavras-chave:
Anthurium andraeanum Lind. ‘Tropical’; colorimetria; padrão de qualidade; escala de senescência; flor tropical
Introduction
Given the senescence characteristics of each species/variety, a quality standard can be created through a classification system; such classifications are typically performed manually and are subjective (Dias et al., 2010DIAS, G.M.; LINO, A.C.L.; SANCHES, J.; LIMA, F.A.B.; NASCIMENTO, T.S. The use of digital images in the classification of cutting flowers. Ornamental Horticulture, v.16, n.2, p.123-126, 2010. DOI: 10.14295/rbho.v16i2.552.; Stead et al., 2019STEAD, A.D.; GAY, A.; TAYLOR, J.; OUGHAM, H.C.; WAGSTAFF, C.; ROGERS, H.J. Hyperspectral imaging as a means to assess quality issues of cut flowers. Acta Horticulturae , v.1263, p.359-366, 2019.). For example, according to Veiling Holambra (2019)VEILING Holambra. 2019. Padrão de qualidade de Antúrio de corte. Available at: <Available at: http://www.veiling.com.br/padrao-qualidade > Accessed on: April 16th, 2020.
http://www.veiling.com.br/padrao-qualida...
, the classification of anthurium (Anthurium andraeanum Lind.) quality is based on the absence or presence of defects and their severity.
The lack of a classification system that is widely applied and allows the establishment of a fair price based on the quality of the flowers is problematic in regard to their sale (Lima Junior et al., 2015LIMA JÚNIOR, J.C.; NAKATANI, J.K.; M. NETO, L.C.; LIMA, L.A.C.V.; KALAI, R.B.; CAMARGO, R.B. A cadeia produtiva de flores e plantas ornamentais e suas dimensões. In: NEVES, M. F.; PINTO, M. J. A. (Orgs.). Mapeamento e quantificação da cadeia de flores e plantas ornamentais do Brasil. São Paulo: OCESP, 2015. 132p.). With the establishment of a classification system, flowers can be correctly categorized, a fair price can be established, and better agreement is possible between the assessment of producers and consumers (Loges et al., 2005).
The standardization and classification of cut flowers is essential not only for the growth and development of the Brazilian flower market but also for the support of the producers in this market, because the modernization of the sector requires that the products be adaptable to a variety of technologies that enable automated purchase and sale. This requires a standardization system that provides the final consumer with more information regarding quality, care required, handling, and durability among other aspects (Sebrae, 2015SEBRAE, Serviço Brasileiro de Apoio às Micro e Pequenas Empresas. Serviço Brasileiro de apoio às micro e pequenas empresas flores e plantas ornamentais do Brasil: Série de estudos mercadológicos. v.3. Brasília: SEBRAE, 2015.; Soleimanipour et al., 2019SOLEIMANIPOUR, A.; CHEGINI, G.R.; MASSAH, J.; ZARAFSHAN, P. A novel image processing framework to detect geometrical features of horticultural crops: case study of Anthurium flowers. Scientia Horticulturae , v.243, p.414-420, 2019. DOI: 10.1016/J.SCIENTA.2018.08.053).
The use of senescence scales is an alternative to the subjectivity of postharvest quality estimates, and this technique enables flowers of superior quality to be made available to the market and also provides a better estimate of longevity. The standardized scale facilitates the evaluation of senescence, and therefore allows improved programing of the cultivation and distribution of the flowers (Curti et al., 2012CURTI, G.L.; MARTIN, T.N.; FERRONATO, M.L.; BENIN, G. Ornamental sunflower: characterization, postharvest and senescence scale. Revista Ciências Agrárias, v.35, p.240-250, 2012.). These scales are based on categories representing the senescence stages of flower stems, which reflect their longevity (Curti et al., 2012; Pour et al., 2018).
One way of creating these scales is through the determination of flower quality by image analysis, which enables analysis in a nondestructive way because there is less contact with the inflorescences and no alteration of environmental conditions (Soleimanipour et al., 2019SOLEIMANIPOUR, A.; CHEGINI, G.R.; MASSAH, J.; ZARAFSHAN, P. A novel image processing framework to detect geometrical features of horticultural crops: case study of Anthurium flowers. Scientia Horticulturae , v.243, p.414-420, 2019. DOI: 10.1016/J.SCIENTA.2018.08.053).
Scales developed using image analysis have been used to assess the severity of diseases such as leaf blight and anthracnose in corn and the quality and viability of corn and soybean seeds (Beyaz et al., 2017BEYAZ, A.; ÖZKAYA, M.T.; İÇEN, D. Identification of some Spanish olive cultivars using image processing techniques. Scientia Horticulturae, v.225, p.286-292, 2017. DOI: 10.1016/j.scienta.2017.06.041; Trojan and Pria, 2018TROJAN, D.G.; PRIA, M.D. Validation of a diagrammatic scale to quantify the severity of corn leaf anthracnose. Summa Phytopathologica, v.44, n.1, p.56-64, 2018. DOI: 10.1590/0100-5405/172675; Baek et al., 2019BAEK, I.; KUSUMANINGRUM, D.; KANDPAL, L.M.; LOHUMI, S.; MO, C.; MOON, S.; KIM, M.S.; CHO, B. Rapid measurement of soybean seed viability using Kernel-Based multispectral image analysis. Sensors, v.19, n.2, p.271, 2019. DOI: 10.3390/s19020271). Therefore, the aim was to develop a grading scale to determine the quality of cut anthurium flowers for application both in-person and using digital images as well as to compare the efficiency of these applications. Therefore, this work aimed to compare the efficiency for application both in-person and using digital images to determine the quality of anthurium flowers ‘Tropical’.
Materials and Methods
Plant material and experimental conditions
Flower stems of Anthurium andraeanum Lind. ‘Tropical’ were collected with 50% of the spadix changing color, thus indicating their maturity (Elibox and Umaharan, 2014ELIBOX, W.; UMAHARAN, P. Morphophysiological parameters associated with vase life of cut flowers of Anthurium andraeanum. Acta Horticulturae, v.1047, p.99-108, 2014. https://doi.org/10.17660/actahortic.2014.1047.10
https://doi.org/10.17660/actahortic.2014...
; Uzzo et al., 2014UZZO, R.P.; TOMBOLATO, A.F.C.; NOMURA, E.S.; MORAES, G.D.; FRAZÃO, J.E.M.; PINHO, P.J.; CUQUEL, F.L. Antúrio. In: PAIVA, P.D.O.; ALMEIDA, E.F.A. Produção de flores de corte. v.2. Lavras: Editora UFLA, 2014. pp.54-103.).
The flower stems were harvested in a commercial production area and all were standardized to 0.50 m. The flowers were transported in boxes, each flower was placed in Floral Water Tubes at room temperature, and the experiments were performed 48 hours after the flowers were harvested. The base of the stem was inserted into a hole in a capped plastic container containing 600 mL of distilled water. The water was not changed during the experimental period. In total, 35, 14 and 35 flower stems were used in the three experimental trials, respectively. Each stem was placed in an individual container labeled with an identification code.
The containers with the anthurium flower stems were arranged in a room with a controlled temperature of 21 ºC and a relative humidity of 85% ± 5%. To gather data on the senescence of the flower and on the evaluation methods of postharvest quality of anthurium, three experiments were conducted.
Test 1. How best to obtain the digital images and characterize visual changes
The first experiment consisted of tests to evaluate how best to obtain the digital images (camera settings and studio conditions) and to characterize the most relevant visual changes that occur in the anthurium flower stems.
A professional Nikon D1500 camera was used (settings: 1/80, F5, ISSO 1000, autofocus) that allowed the recording of images that corresponded as closely as possible to the actual anthurium inflorescences. A miniature studio was assembled using mini LED reflectors, and the sides, top and the bottom of the studio were closed with a white matte fabric to avoid interference from the external environment when obtaining the images. The camera was installed on a tripod to ensure a consistent distance of 0.40 m to all flowers. The inflorescences of each flower stem, duly identified, were photographed daily in a frontal position to allow the entire spathe to be recorded in a single plane. Each inflorescence was photographed once daily, for a total of 35 photos per day; each image was duly identified and archived in a computer.
A fixed group of evaluators assigned scores to each inflorescence based on the scale developed by Dias-Tagliacozzo (2004)DIAS-TAGLIACOZZO, G.M. Anthurium post-harvest. Ornamental Horticulture , v.10, n.1/2, p.46-48, 2004.. The scale describes a set of features for each scoring category that represent the level of quality. This is a decreasing scale, such that the highest score corresponds to the best quality flowers and the lowest score corresponds to the worst quality flowers: Score 4, excellent overall appearance, turgid plants, glossy spathe and spadix; Score 3, good overall appearance, beginning to lose turgidity and spathe gloss; Score 2, regular overall appearance, a loss of turgidity indicated by an opaque spathe and a change of color in the flower stem at the insertion of the spathe; Score 1, poor overall appearance, no gloss to spathe and spadix, faded appearance, stem showing lines of necrosis; Score 0, discard, dark spadix with necrosed apex, wilted spathe, and yellow stem.
Test 2. In-person and digital images evaluation
The purpose of the second experiment was to analyze how the evaluators assigned scores to the flowers during the in-person evaluation and how they scored digital images of these same flowers. A fixed group of five trained evaluators was used; those who evaluated the flowers in-person also later evaluated the same flowers using digital images.
The inflorescence (spathe and spadix) of anthurium was the primary focus for the evaluation of postharvest quality in the second experiment, because the first experiment showed that the primary signs of senescence occurred first in the inflorescence and specifically in the spathe. When a change of color was observed at the site of insertion of the inflorescence, the spathe was already in an advanced stage of senescence, and necrosis lines were observed on the stems. Thus, the evaluators assigned scores on the visual quality of the flowers by focusing on the inflorescences.
For all the evaluations described below, 14 flower stems of A. andraeanum L. ‘Tropical’ were used.
The scores were based on the senescence scale for anthurium developed by Dias-Tagliacozzo (2004)DIAS-TAGLIACOZZO, G.M. Anthurium post-harvest. Ornamental Horticulture , v.10, n.1/2, p.46-48, 2004. with modifications: scores were assigned only using the inflorescence characteristics. Thus, the categories defined were as follows: Score 4, maximum quality of the inflorescence (turgid, glossy inflorescences with intense color); Score 3, beginning to lose gloss and turgidity and the color is fading; Score 2, more apparent loss of gloss and turgidity and changes in the spathe color; Score 1, marked loss of gloss and turgidity, changes in the spathe color and/or necrotic and the spadix has a necrotic apex; Score 0, the spathe and spadix are necrotic and there is separation of the inflorescence from the flower stem. The figure below provides examples of inflorescences representing the visual quality classification categories described (Figure 1).

Inflorescences of Anthurium andraeanum L. ‘Tropical’ representing the scores in the visual quality classification. Score 4, maximum quality of the inflorescence (turgid, glossy inflorescences with intense color); Score 3, beginning to lose gloss and turgidity and the color is fading; Score 2, more apparent loss of gloss and turgidity and changes in the spathe color; Score 1, marked loss of gloss and turgidity, changes in the spathe color and/or necrotic and the spadix has a necrotic apex; Score 0, the spathe and spadix are necrotic and there is separation of the inflorescence from the flower stem.
It is important to emphasize that scores of 3 or above indicate that the anthurium is of sufficient quality to be marketed (Dias-Tagliacozzo, 2004DIAS-TAGLIACOZZO, G.M. Anthurium post-harvest. Ornamental Horticulture , v.10, n.1/2, p.46-48, 2004.), whereas scores below 3 indicate flowers that need to be discarded. However, scores of 2, 1 and 0 were assigned in the study of the complete postharvest senescence process. Thus, scores were assigned daily until 50% of the flower stems reached the discard score (score 0) for their inflorescences, which resulted in a total evaluation period of 13 days.
In addition to the visual evaluation performed by the evaluators, the colorimetric quality of the spathes was determined using a Konica Minolta CR-300 Chroma Meter colorimeter with CIE L*a*b methodology (Konica Minolta Sensing Americas, Inc., Ramsey, NJ, USA), which determines the (dimensionless) color parameters of a sample: L* represents the lightness of a sample (in the present study, this corresponds to the gloss of the spathe), and a* and b* represent the chromaticity of the sample, where a* is the red/green coordinate (positive values indicate red, negative values indicate green), and b* is the yellow/blue coordinate (positive values indicate yellow; negative values indicate blue).
The colorimetric evaluation was performed for three regions of the spathe: upper, middle and lower; two points were measured in each region. This allowed the determination of regional differences in color characteristics of the spathe as well the identification of the best region of the spathe to use for measurements of color parameters in future tests.
An evaluation of the fresh mass of the flower was also performed during the experiment to complement and correlate with the changes that occurred during senescence. For this evaluation, the flower stems were weighed daily on a digital scale.
As in the first experiment, each inflorescence was photographed daily throughout the experimental period in the same studio and with the same camera settings in a frontal position to create an image of the flower in a single plane; each photograph was duly identified and archived in a computer.
At the end of the evaluation period, digital images of the inflorescences were selected to compose a sequence of 50 photographs that represented the changes observed in the inflorescence characteristics during senescence. This sequence of images was shown to each of the evaluators. This allowed a comparison of the score they assigned to the inflorescences in-person and the score they assigned to the digital images. In order to perform this comparison, the selected digital images were coded so that the scores assigned during the in-person evaluation, i.e., during the experiment, could be later matched to the scores assigned when the inflorescences were presented in a digital format.
The same sequence of 50 digital photos was also shown to a second group of people who did not participate in the in-person evaluations; this was the first contact they had with the characteristics that indicate inflorescence quality. Thus, it was possible to evaluate the thoroughness with which people with prior knowledge of postharvest quality evaluation and people without such prior knowledge classified the quality of anthurium inflorescences.
Test 3. Validation
To validate the results of the image analysis experiment, a third experiment was conducted using 35 flower stems of A. andraeanum and 13 evaluators, focusing on the in-person scoring by a fixed group of evaluators and on the monitoring of visual changes in the inflorescences using images obtained using the same specifications of the previous experiments.
After the evaluation period, a new group of 50 images was selected that were representative of the 5 scoring categories of the modified Dias-Tagliacozzo (2004)DIAS-TAGLIACOZZO, G.M. Anthurium post-harvest. Ornamental Horticulture , v.10, n.1/2, p.46-48, 2004. scale from the second experiment. This enabled the evaluators to assign scores to digital images.
To avoid any potential differences in resolution among different electronic devices (computer monitors, scorebook and mobile device), a single monitor was used to project the images for all the evaluators at the same time, and each evaluator individually assigned a score. The same images were also made available to each individual evaluator so that they could use their own electronic devices to analyze and score the images. Therefore, the inflorescences were evaluated by three visualization methods: in-person, during the experiment; “individual”, using digital images on different devices; and in group, using digital images presented on a single monitor for all evaluators simultaneously. This experiment aimed to evaluate the feasibility and quality of a visual evaluation using digital images.
Statistical analyses
The data generated by the colorimeter analyses, fresh mass measurements and visual quality scores assigned during the experiment and to the digital images were subjected to an F-test of the analysis of variance. When significant differences were detected by the F test, quantitative factors (evaluation days) were analyzed using a polynomial regression and/or the Scott-Knott test, whereas the qualitative factors (score category and evaluation mode) were analyzed in-person and in-group. In all cases, the significance level was p < 0.05. All data were analyzed using the statistical software SISVAR (Ferreira, 2014FERREIRA, D.F. Sisvar: a Guide for its Bootstrap procedures in multiple comparisons. Ciência e Agrotecnologia, v.38, p.109-112, 2014. DOI: 10.1590/S1413-70542014000200001.).
Results
Colorimetric measurements taken from the three regions of the spathe in the inflorescence (upper, middle and lower) did not significantly differ from one another for the parameters a*, C* (intensity of the color) and Hueº. However, for the parameters b* and L*, the lower region had higher values when compared with the upper and middle regions of the inflorescence (Figure 2, A and B).
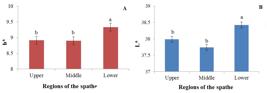
Measurements of parameters b* and L* (A and B, respectively) for the three areas of the anthurium spathe.
The three areas evaluated of the spathe of the anthurium inflorescences did not differ with regard to the parameters L*, a* and b* as a function of the evaluation period. However, the evaluation period had an effect on these colorimetric parameters (Figure 3 A-F).

Changes in the colorimetric parameters a*, C*, b*, Hueº, and L* (A, B, C, D and E, respectively) throughout the evaluation period. Fresh mass (g) throughout the evaluation period (F).
Measurements made with the colorimeter (Figures 3 A-E) and the monitoring of the fresh mass (Figure 3 F) of the flower stems throughout the experiment allowed confirmation of and correlation with the mean scores (Figure 4) assigned by the evaluators during the evaluation period based on the characteristics of each postharvest quality category.

Scores assigned in-person by the evaluators to anthurium inflorescences throughout the evaluation period. Score 4: Maximum quality of the inflorescence; Score 3: Beginning to lose gloss and turgidity and the color is fading; Score 2: More apparent loss of gloss and turgidity and the spathe is purplish; Score 1: Marked loss of gloss and turgidity, the spathe is purplish and/or necrotic and the spadix has a necrotic apex and Score 0: The spathe and spadix are necrotic and there is separation of the inflorescence from the flower stem.
In the second experiment, differences in the scores assigned separately by each of the five evaluators in-person revealed the subjectivity in judging the quality of the flowers (Figure 5).
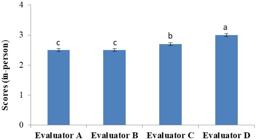
Mean score assigned by each evaluator in the in-person evaluation of the quality of anthurium inflorescences.
There was a significant difference between the scores of evaluators in-person and using images (Figure 6). Considering the scores of evaluators with and without prior knowledge of postharvest classification, it was not observed any significant difference. This result indicates that knowledge of the scale alone is sufficient to evaluate the postharvest quality of anthurium inflorescences.
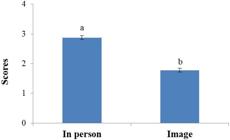
Quality scores of anthurium inflorescences assigned by evaluators in-person and using images.
In the third experiment, two different methods of digital image display were evaluated, individual (each evaluator was able to make classifications using his or her own electronic device such as a computer or mobile phone) or in group (using the same electronic device for all evaluators), to assess whether the resolution of different electronic devices had an effect on the evaluation. The results showed no significant difference between these methods, but both differed from the in-person evaluation method (Figure 7).

Quality scoring of anthurium inflorescences according to each Score (4, 3, 2, 1 and 0) and evaluation method (in-person, individual or in group). Score 4, 3, 2, 1 and 0 are represented by A, B, C, D and E, respectively. Score 4: Maximum quality of the inflorescence; Score 3: Beginning to lose gloss and turgidity and the color is fading; Score 2: More apparent loss of gloss and turgidity and the spathe is purplish; Score 1: Marked loss of gloss and turgidity, the spathe is purplish and/or necrotic and the spadix has a necrotic apex and Score 0: The spathe and spadix are necrotic and there is separation of the inflorescence from the flower stem.
The results showed that the region of the inflorescence in which the measurement is taken for the different colorimetric parameters does not affect their value, but the period during which such parameters are measured does affect their value.
Parameter a* represents the red scale; and the more positive the value is, the redder the sample. As anthurium “Tropical’ already has a characteristically reddish color, this value begins positive but declines throughout the evaluation period (Figure 3A). Similarly, the C* parameter (Figure 3B), which represents the intensity of the color (in this case, red), is also initially positive and shows a decrease starting nine days after harvest. This indicates a loss of quality, which is confirmed by the reduction in the mean scores assigned by the evaluators during this same time interval (Figure 4).
Discussion
The results from the measurements using colorimeter and fresh mass of the flower stems throughout the experiment allowed confirmation and correlation with the mean scores assigned by the evaluators during the evaluation period based on the characteristics of each postharvest quality category.
Over time, the evaluation of a* and C* decrease in postharvest period, and the anthurium spathe becomes more purplish, which is correlated with an increase in the b* parameter, which indicates the blueness of the sample. This change in color already indicates a more advanced stage of senescence, and it is also a change that is perceivable by the evaluators; this is consistent with the decrease in scores around the ninth evaluation day. This same parameter then shows a subsequent drop, because the color changes again at the end of the evaluation period when the spathe shows brown spots as a result of the necrotic process. The spathe color changes were the signs of senescence common to anthurium cultivars (Favero et al., 2020FAVERO, B.T.; LÜTKEN, H.; DOLE, J.M.; LIMA, G.P.P. Anthurium andraeanum senescence in response to 6-benzylaminopurine: Vase life and biochemical aspects. Postharvest Biology and Technology, v.161, 111084, 2020. DOI: 10.1016/j.postharvbio.2019.111084). Avila-Rostant et al. (2010)AVILA-ROSTANT, O.; LENNON, A.M.; UMAHARAN, P. Spathe color variation in Anthurium andraeanum Hort. and its relationship to vacuolar pH. Horticultural Science, v.45, p.1768-1772, 2010. observed similar results in red anthurium inflorescences, with very low b* values after 24 days postharvest.
Another factor that contributes to color changes is the loss of lightness, i.e., the spathe gloss, which is represented by the L* parameter and decreases from the first day of storage. At the beginning of the experiment, the inflorescences are at their peak quality, and another characteristic that is very evident and that characterizes this high quality is the spathe gloss, which corresponds to a high L* value (Figure 3E). The L* value ranges from 0 to 100; lower values indicate darker samples, and higher values indicate lighter and brighter samples. This is also a parameter that decreases throughout the evaluation period, indicating the loss of gloss that occurs due to senescence processes such as the appearance of necrotic spots and a loss of turgidity associated with the loss of fresh mass, as shown in Figure 3F. This parameter is more closely correlated with the assigned scores, which suggests that it is one of the most representative colorimetric parameters in the senescence process for anthurium and corresponds; it is also a characteristic that the evaluators can see in-person, i.e., the spathe gloss.
The characteristic red color of the spathe is maintained until the eighth day of storage according to the parameters a* and C*, and from the ninth day onward, there is a decline in these values indicating a loss of that characteristic hue; in other words, the red color becomes opaquer. That opacity is perceptible because it affects the gloss, a characteristic that is perceived by the evaluators and leads to a change in the visual quality classification.
Color preservation is an important factor that is used to establish the commercial value of plant products (Marsala et al., 2014MARSALA, J.; FERRAZ, M.V.; SILVA, S.H.M.G.; PEREIRA, D.M.G. Post-harvest of Anthurium andraeanum L. cv. Apalai foliage. Ornamental Horticulture , v.20, n.2, p.137-142, 2014. DOI: 10.14295/rbho.v20i2.544). The lychee fruit (Litchi chinensis Sonn.) has a red peel, and similar to the anthurium spathe, fruit darkening occurs after postharvest that hinders its commercialization. The darkening occurs due to the loss of water in the fruit during storage, leading to the rupture of cells and the contact of anthocyanin, the pigment responsible for the red color, with oxidative enzymes, which results in the production of brown compounds (Lima et al., 2010LIMA, Á. M.; CERQUEIRA, M. A.; SOUZA, B. W.; SANTOS, E. C. M.; TEIXEIRA, J. A.; MOREIRA, R. A.; VICENTE, A. A. New edible coatings composed of galactomannans and collagen blends to improve the postharvest quality of fruits- Influence on fruits gas transfer rate. Journal of Food Engineering, v.97, n.1, p.101-109, 2010. DOI: 10.1016/j.jfoodeng.2009.09.021).
In the initial days of evaluating the inflorescences, the individual evaluators assigned similar scores (Figure 4), because the flower stems were at their maximum quality, and the gloss, hue and turgidity characteristics were similar. As these characteristics began to change due to the senescence process, the assigned scores began to diverge among the evaluators. This may be due to the way in which each evaluator judges the quality according to changes in the inflorescence characteristics. At the end of the evaluation period, when the inflorescences were in a more advanced stage of senescence, the visual characteristics that indicate a decline in quality, such as the loss of gloss and turgidity, were common to all inflorescences, and the scores assigned by the evaluators were less divergent.
An evaluator may consider only one characteristic as the determinant of quality, whereas another evaluator may consider a set of characteristics. Thus, postharvest quality scores are assigned more subjectively and according to the thoroughness of each evaluator (Figure 5).
The scores assigned to the anthurium inflorescences ‘Tropical’ in-person differed significantly from those assigned by the same evaluators to the digital images representative of each category of postharvest quality (Figure 6). The mean scores assigned in-person indicated a higher level of quality compared with the mean scores assigned to images.
Considering the in-person analyzes, the evaluators are able to see greater detail in the inflorescences due to a closer, three-dimensional view. The digital images display a single plane with all the inflorescences are arranged in the same general configuration, which can favor or reflect poorly on particular attributes related to quality.
The absence of a difference in the comparison between the groups with and without postharvest knowledge suggests that no training is required to evaluate anthurium quality using digital images. Thus, anyone within the production and sale chain could use a quality classification system based on images, from the producer to the consumer.
The display of digital images on different electronic devices did not interfere with image scoring; however, scores of digital images differed from the scores assigned in-person as well as from each category of the scale used (Figures 7 A-E). In category 4, where the quality is highest, the score assigned in-person was higher, possibly due to the better visualization of the inflorescence as previously discussed. For the same reason, scores decreased in the other categories in comparison with the other methods, because there is a higher probability that the evaluator will see a defect with the three-dimensional view of the inflorescence that is possible using the in-person method. Thus, regions of the spathe where the color is starting to change and dried areas indicating a loss of gloss and turgidity are more easily identified in-person than in the digital images shown in a single plane.
Conclusions
The location area of the measurement does not affect the value of the colorimetric characteristics of Anthurium andraeanum ‘Tropical’, but the period in which the parameters are measured does affect these characteristics.
The Anthurium andraeanum ‘Tropical’ senescence scale was successfully developed.
The L* parameter measured by the colorimeter has the highest correlation with the evaluation of postharvest quality of Anthurium andraeanum ‘Tropical’.
The evaluators differed in the thoroughness of their quality evaluation primarily for the scores representing the highest quality.
There is no need for prior knowledge of postharvest quality when evaluating postharvest quality through digital images.
There is no difference in the quality scores when different types of electronic equipment are used.
Postharvest quality classification in-person is more accurate and efficient in comparison with digital images.
Acknowledgements
This study was supported in part by Coordenação de Aperfeiçoamento de Pessoal de Nível Superior - Brasil (CAPES), Fundação de Amparo a Pesquisa de Minas Gerais (FAPEMIG) and Conselho Nacional de Desenvolvimento Científico e Tecnológico (CNPq). The authors are thankful to all the evaluators that collaborated with this study.
References
- AVILA-ROSTANT, O.; LENNON, A.M.; UMAHARAN, P. Spathe color variation in Anthurium andraeanum Hort. and its relationship to vacuolar pH. Horticultural Science, v.45, p.1768-1772, 2010.
- BAEK, I.; KUSUMANINGRUM, D.; KANDPAL, L.M.; LOHUMI, S.; MO, C.; MOON, S.; KIM, M.S.; CHO, B. Rapid measurement of soybean seed viability using Kernel-Based multispectral image analysis. Sensors, v.19, n.2, p.271, 2019. DOI: 10.3390/s19020271
- BEYAZ, A.; ÖZKAYA, M.T.; İÇEN, D. Identification of some Spanish olive cultivars using image processing techniques. Scientia Horticulturae, v.225, p.286-292, 2017. DOI: 10.1016/j.scienta.2017.06.041
- CURTI, G.L.; MARTIN, T.N.; FERRONATO, M.L.; BENIN, G. Ornamental sunflower: characterization, postharvest and senescence scale. Revista Ciências Agrárias, v.35, p.240-250, 2012.
- DIAS, G.M.; LINO, A.C.L.; SANCHES, J.; LIMA, F.A.B.; NASCIMENTO, T.S. The use of digital images in the classification of cutting flowers. Ornamental Horticulture, v.16, n.2, p.123-126, 2010. DOI: 10.14295/rbho.v16i2.552.
- DIAS-TAGLIACOZZO, G.M. Anthurium post-harvest. Ornamental Horticulture , v.10, n.1/2, p.46-48, 2004.
- ELIBOX, W.; UMAHARAN, P. Morphophysiological parameters associated with vase life of cut flowers of Anthurium andraeanum Acta Horticulturae, v.1047, p.99-108, 2014. https://doi.org/10.17660/actahortic.2014.1047.10
» https://doi.org/10.17660/actahortic.2014.1047.10 - FAVERO, B.T.; LÜTKEN, H.; DOLE, J.M.; LIMA, G.P.P. Anthurium andraeanum senescence in response to 6-benzylaminopurine: Vase life and biochemical aspects. Postharvest Biology and Technology, v.161, 111084, 2020. DOI: 10.1016/j.postharvbio.2019.111084
- FERREIRA, D.F. Sisvar: a Guide for its Bootstrap procedures in multiple comparisons. Ciência e Agrotecnologia, v.38, p.109-112, 2014. DOI: 10.1590/S1413-70542014000200001.
- LIMA JÚNIOR, J.C.; NAKATANI, J.K.; M. NETO, L.C.; LIMA, L.A.C.V.; KALAI, R.B.; CAMARGO, R.B. A cadeia produtiva de flores e plantas ornamentais e suas dimensões. In: NEVES, M. F.; PINTO, M. J. A. (Orgs.). Mapeamento e quantificação da cadeia de flores e plantas ornamentais do Brasil. São Paulo: OCESP, 2015. 132p.
- LIMA, Á. M.; CERQUEIRA, M. A.; SOUZA, B. W.; SANTOS, E. C. M.; TEIXEIRA, J. A.; MOREIRA, R. A.; VICENTE, A. A. New edible coatings composed of galactomannans and collagen blends to improve the postharvest quality of fruits- Influence on fruits gas transfer rate. Journal of Food Engineering, v.97, n.1, p.101-109, 2010. DOI: 10.1016/j.jfoodeng.2009.09.021
- MARSALA, J.; FERRAZ, M.V.; SILVA, S.H.M.G.; PEREIRA, D.M.G. Post-harvest of Anthurium andraeanum L. cv. Apalai foliage. Ornamental Horticulture , v.20, n.2, p.137-142, 2014. DOI: 10.14295/rbho.v20i2.544
- POUR, A.S.; CHEGINI, G.; ZARAFSHAN, P.; MASSAH, J. Curvature-based pattern recognition for cultivar classification of Anthurium flowers. Postharvest Biology and Technology , v.139, p.67-74, 2016. DOI: 10.1016/j.postharvbio.2018.01.013
- SEBRAE, Serviço Brasileiro de Apoio às Micro e Pequenas Empresas. Serviço Brasileiro de apoio às micro e pequenas empresas flores e plantas ornamentais do Brasil: Série de estudos mercadológicos. v.3. Brasília: SEBRAE, 2015.
- SOLEIMANIPOUR, A.; CHEGINI, G.R.; MASSAH, J.; ZARAFSHAN, P. A novel image processing framework to detect geometrical features of horticultural crops: case study of Anthurium flowers. Scientia Horticulturae , v.243, p.414-420, 2019. DOI: 10.1016/J.SCIENTA.2018.08.053
- STEAD, A.D.; GAY, A.; TAYLOR, J.; OUGHAM, H.C.; WAGSTAFF, C.; ROGERS, H.J. Hyperspectral imaging as a means to assess quality issues of cut flowers. Acta Horticulturae , v.1263, p.359-366, 2019.
- TROJAN, D.G.; PRIA, M.D. Validation of a diagrammatic scale to quantify the severity of corn leaf anthracnose. Summa Phytopathologica, v.44, n.1, p.56-64, 2018. DOI: 10.1590/0100-5405/172675
- UZZO, R.P.; TOMBOLATO, A.F.C.; NOMURA, E.S.; MORAES, G.D.; FRAZÃO, J.E.M.; PINHO, P.J.; CUQUEL, F.L. Antúrio. In: PAIVA, P.D.O.; ALMEIDA, E.F.A. Produção de flores de corte. v.2. Lavras: Editora UFLA, 2014. pp.54-103.
- VEILING Holambra. 2019. Padrão de qualidade de Antúrio de corte. Available at: <Available at: http://www.veiling.com.br/padrao-qualidade > Accessed on: April 16th, 2020.
» http://www.veiling.com.br/padrao-qualidade
-
Area Editor: Gláucia Moraes Dias
Publication Dates
-
Publication in this collection
15 July 2020 -
Date of issue
Apr-Jun 2020
History
-
Received
18 Dec 2019 -
Accepted
14 Apr 2020 -
Published
06 May 2020


 *Means followed by the same letter in the row do not differ statistically by the Scott-Knott test (p < 0.05)


 *Means followed by the same letter in the row do not differ statistically by the Scott-Knott test (p < 0.05)
 *Means followed by the same letter in the row do not differ statistically by the Scott-Knott test (p < 0.05)
 *Means followed by the same letter in the row do not differ statistically by the Scott-Knott test (p < 0.05)