Abstract
The transport distance in a mining operation strongly influences a mine operation revenue and its operational cycle because it is a fundamental part of the total mining costs. Generally, the transport route is determined based on an engineer's practical knowledge, which does not consider any mechanism to optimize the possible routes to be taken. In an attempt to establish a methodology for calculating the path that results in minimum costs to transport the mined block to its destination, the Dijkstra methodology is applied to a tree graph analysis, where the mining blocks are analysed as nodes of the tree. The transport cost is reflected as the arc of the graphs, which can use the Euclidean distance or the transport time for the calculation of the minimum path. The result obtained from the Dijkstra algorithm provided a non-operational route; to overcome this problem, an adjustment was performed through non-parametric equations. In this manner, it was possible to determine the transport costs for each block of the model. The paths based on Euclidean distance and transport time showed a tendency to increase for deeper mining regions. Identifying areas of largest growth and correctly quantifying their values increase the efficiency of mining planning.
keywords:
fleet costs; Dijkstra; optimized path; transport time; transport distance
1. Introduction
Open pit mining operations are characterized by their large size, where ore and waste movements reach millions of tons. The costs associated with these operations are part of the mining costs and correspond to 10% to 50% of the operating costs (THOMPSON e VISSER, 2000THOMPSON, R J, VISSER, A T. The functional design of surface mine haul roads. The Journal of The South African Institute of Mining and Metallurgy, v. 100, n. 3, p. 169-180, 2000.). Another very important fact is that approximately 6% to 20% of the mining costs are a direct cost for ore transport (RUNGE, 1998RUNGE, Ian C. Mining economics and strategy. [S.l.]: SME, 1998.). One factor that directly influences transport costs is the accessibility for equipment, which has a significant impact on infrastructure and maintenance costs. Grades and long distances contribute to an increase in the cycle time and decrease the availability of discrete cycle transport equipment (RICHARDSON e NICHOLLS, 2011RICHARDSON, Mike, NICHOLLS, Peter. A business and labour history of Britain. [S.l.]: Palgrave MacMillan, 2011.).
Improving the cost estimation methodology is of extreme importance for mining operations because an increase in the operational efficiency can reduce the difference between the estimated and operational costs. The article Runge (RUNGE, 1998RUNGE, Ian C. Mining economics and strategy. [S.l.]: SME, 1998.) presents several operational dimensioning errors that led mining companies to bankruptcy. Richardson (RICHARDSON e NICHOLLS, 2011RICHARDSON, Mike, NICHOLLS, Peter. A business and labour history of Britain. [S.l.]: Palgrave MacMillan, 2011.) recounts in his book the study of Frederick Winslow Taylor, the father of Taylorism, concerning the impact of loading in a mining operation in twentieth-century England. Taylor's study attempted to measure the compatibility of the excavation units with the ore and coke carriers so that the movement of the equipment was the smallest possible. It is still a great challenge to accurately determine the arrangement of the equipment to obtain the lowest operational cost.
After the introduction of the time and movement control system initiated by Taylor (RICHARDSON e NICHOLLS, 2011RICHARDSON, Mike, NICHOLLS, Peter. A business and labour history of Britain. [S.l.]: Palgrave MacMillan, 2011.), the mining industry began to search for labor methods that reduce operating costs. In the 1970s, dispatch systems began to be implemented to direct the equipment to the most immediate tasks to meet production goals (MUNIRATHINARN e YINGLING, 1994MUNIRATHINARN, Mohan, YINGLING, Jon C. A review of computer-based truck dispatching strategies for surface mining operations. International Journal of Surface Mining, Reclamation and Environment, v. 8, n. 1, p. 1-15, 1994.). Due to the high cost of implementation and the few published results, automated dispatch systems were deprecated until the 1970s, when the article by Tyronne Mine and Chino Mine was published and the mining community began to use its applications (MUNIRATHINARN e YINGLING, 1994MUNIRATHINARN, Mohan, YINGLING, Jon C. A review of computer-based truck dispatching strategies for surface mining operations. International Journal of Surface Mining, Reclamation and Environment, v. 8, n. 1, p. 1-15, 1994.). Research of dispatch systems are based on the allocation system, entity behavior, cost minimization and production maximization (RODRIGUES e PINTO, 2012RODRIGUES, Lásara Fabrícia, PINTO, Luiz Ricardo. Análise comparativa de metodologias utilizadas no despacho de caminhões em minas a céu aberto. Rem: Revista Escola de Minas, v. 65, n. 3, p. 377-384, 2012. Disponível em: <http://www.scielo.br/scielo.php?script=sci_arttext&pid=S0370-44672012000300015&lng=pt&tlng=pt>.
http://www.scielo.br/scielo.php?script=s...
). Meanwhile, there have been studies of transport engineering attempting to determine the path of lowest operational cost since Dijkstra's first work (DIJKSTRA, 1959DIJKSTRA, E. W. A note on two problems in connexion with graphs. Numerische Mathematik, v. 1, n. 1, p. 269-271, 1959.) that developed a methodology to determine the lowest cost path in a network of nodes.
The mechanisms that estimate the equipment route can be divided into two methods: artisanal and mathematical. The artisanal methodology consists of the manual design of the trajectory that the equipment must follow while obeying the restrictions of inclination, grade, speed and level transition (COMMUNICATION, 2000COMMUNICATION, Ministry of. Geometric Design Standards for Roads & Highways Department. Government of the People's Republic of Bangladesh Ministry of Communications Roads and Railways Division, n. October, 2000.). This method provides the actual trajectory to be followed by the transport equipment; however, it is not able to select the best possible path in terms of cost. Currently, there is an effort to develop a methodology capable of determining the best path through a network of nodes using an exact or heuristic solution (JULA e colab., 2003JULA, Hossein et alii. Full-truck-load assignment and route planning in deterministic and stochastic environments. In: NSF DESIGN AND MANUFACTURING GRANTEES CONFERENCE, 1. p. 2957-2971, 2003.).
The mathematical solution does not present a smooth transition between curves, grade and operational curvature radius; the majority of the efforts are focused on developing routing, while the adjustment of operational conditions should be refined by heuristic mechanisms (BOGNA MRÓWCZYŃSKA, 2011BOGNA MRÓWCZYŃSKA. Optimal routes scheduling for municipal waste disposal garbage trucks using evolutionary algorithm. Transport Problems, v. 6, n. 4, 2011.). The routes will result from lines or curves between the nodes. However, because the distance and the arrangement between the nodes is not constant, it is not possible to determine a parametric equation to construct all the curves. To determine the curve between the nodes, the proposal is to use non-parametric equations (KANATANI, 1997KANATANI, Kenichi. Comments on "nonparametric segmentation of curves into various representations". IEEE Transactions on Pattern Analysis and Machine Intelligence, v. 19, n. 12, p. 1391-1392, 1997.).
The proposed methodology to determine the most accurate transport cost can be applied to determine the final pit, mining sequencing or mining operation. If it is applied to the final pit calculation, the decision on which block will be mined will consider the cost of the block's transport to the processing plant more precisely than the fixed cost methodology. The correct identification of the optimum path for the transport of each mining block will allow the estimation of the mining cost for the entire block model. The majority of the studies use only the spatial positioning of the block to estimate this cost (JULA e colab., 2003JULA, Hossein et alii. Full-truck-load assignment and route planning in deterministic and stochastic environments. In: NSF DESIGN AND MANUFACTURING GRANTEES CONFERENCE, 1. p. 2957-2971, 2003.). However, it is known that different paths, inclination and curvature may have similar distances (PEURIFOY e LEDBETTER, 1985PEURIFOY, Robert Leroy, LEDBETTER, William Burl. Construction planning, equipment, and methods. (4. ed.).. New York, NY: McGraw-Hill, 1985.), which may result in erroneous estimations. The study also intends to verify which of the two approaches is the most effective: using only the distance/position of the block or if the transport time variable is more suitable for such an estimate.
2. Material and method
2.1. Spatial Concepts
To represent the spatial problem capable of estimating the lowest cost to transport the mining block, it is necessary to consider the precedence, distance and cost models (Figure 1). The precedence model is responsible for informing which blocks will be extracted prior to mining a particular block, according to their spatial location. The distance model uses the coordinates of the centroid of the blocks to calculate the distance between the blocks. The cost model informs the cost associated with the positioning of the route between two nodes of the network; time and distance will be the variables input into this model. The cost model informs the distance or time spent by the equipment to move from point A to point B. When used simultaneously, these models will be able to provide information so that the mathematical model provides a logical solution capable of presenting a minimum cost result that is visually compatible with reality.
The use of this structure based on multiple models makes it possible to identify the path to be travelled because the distance model is capable of storing the spatial position between the blocks. The concept of path involves the definitions of the exit and destination points. The sum of the transport cost and distance will be the variables used to define the minimum cost path for each block intended for the processing plant.
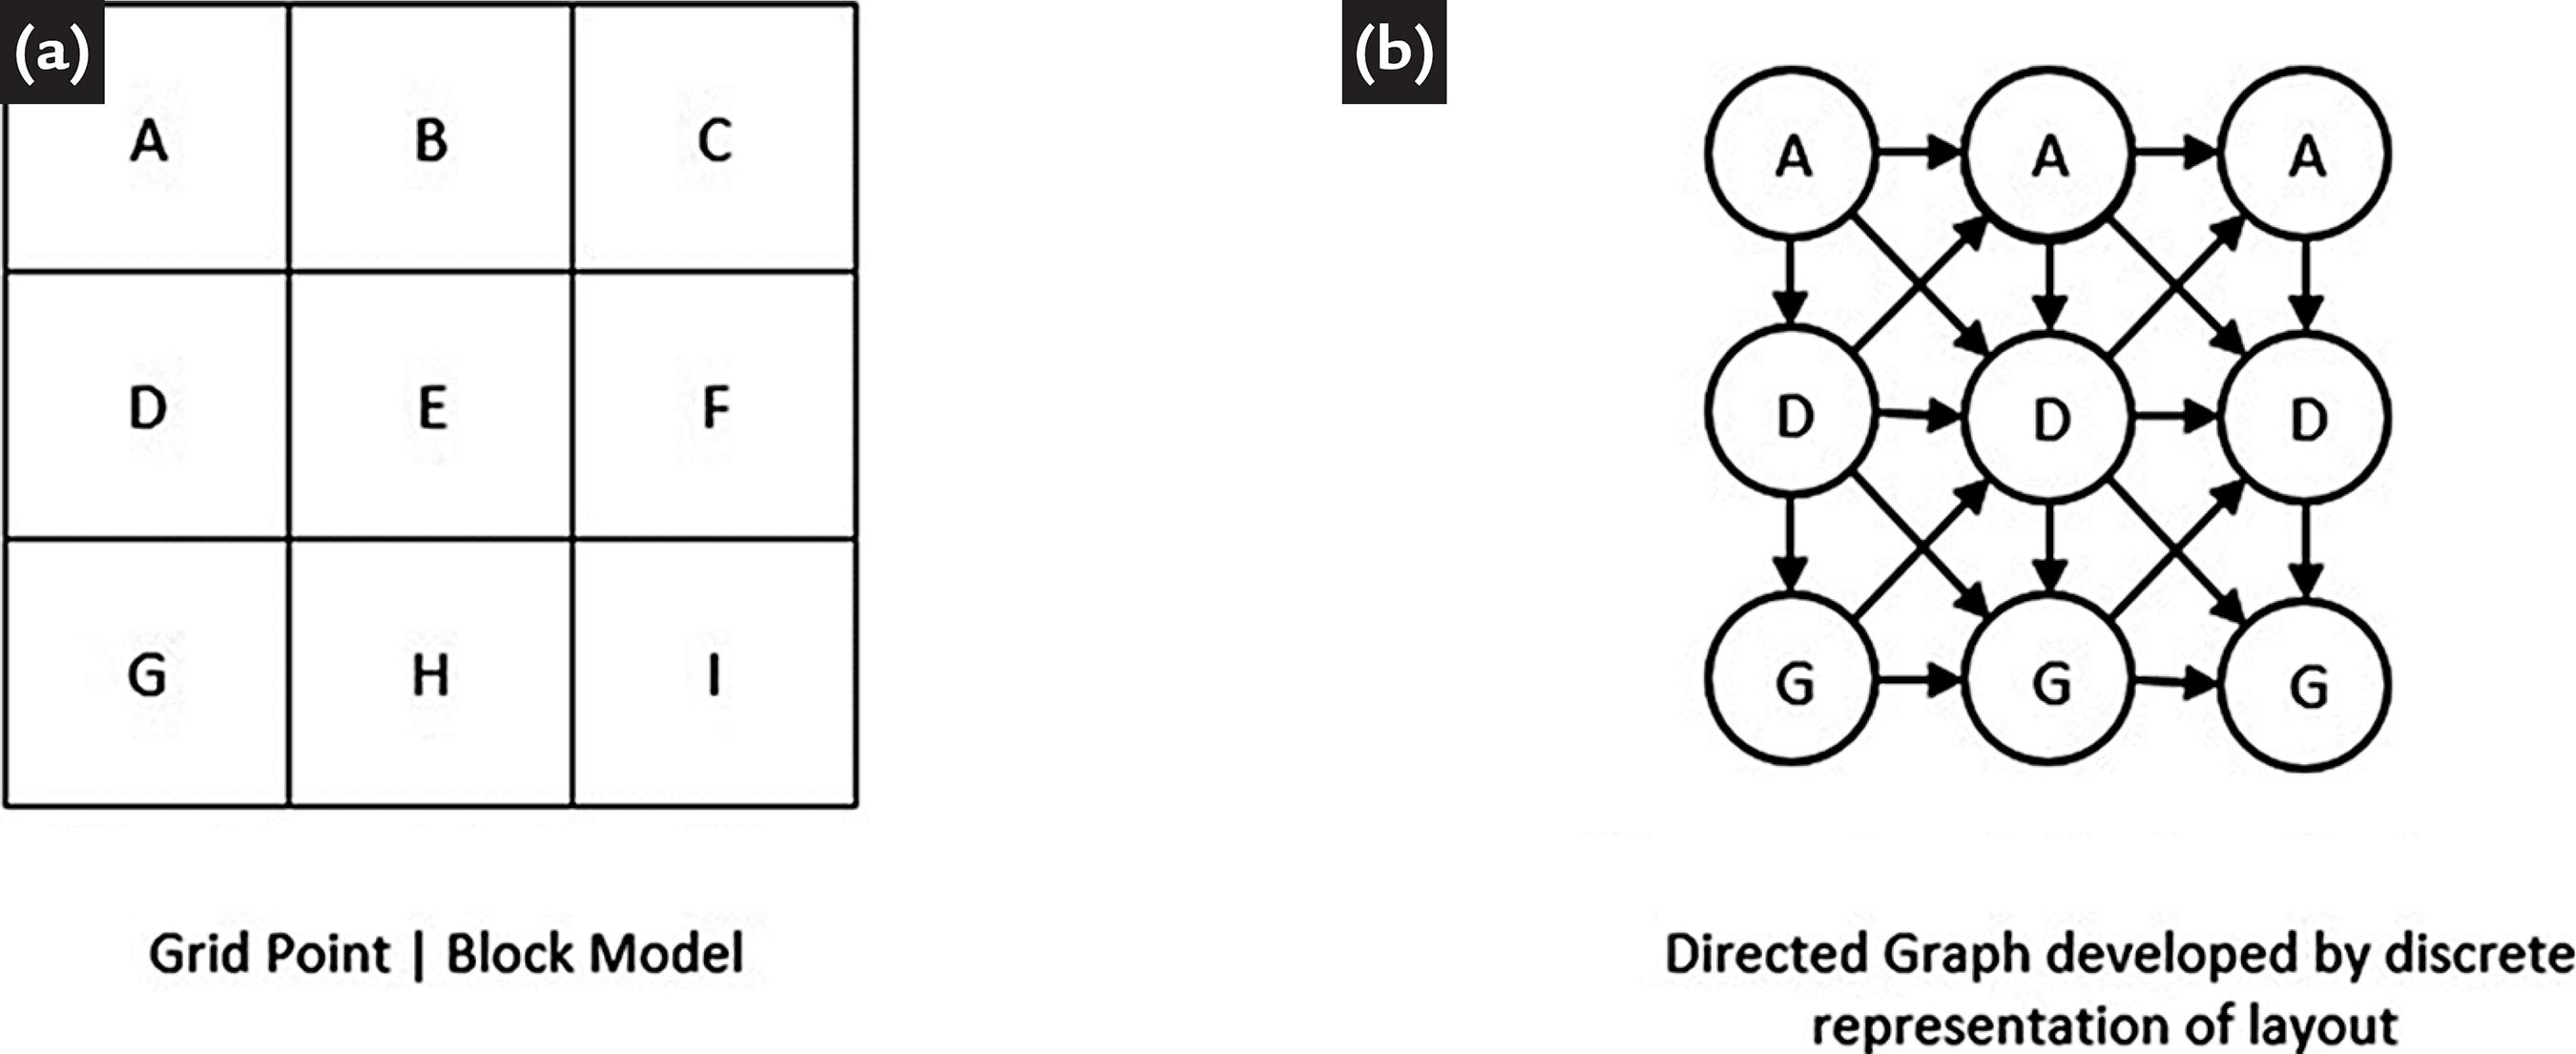
The precedence model is based on the block model. Each block represents a fraction of the mineral deposit and is represented by the centre of mass, as shown in Figure 2(a). This model can also be represented by a set of neighboring nodes, as shown in Figure 2(b), in which the center of mass of each block is represented by a node.
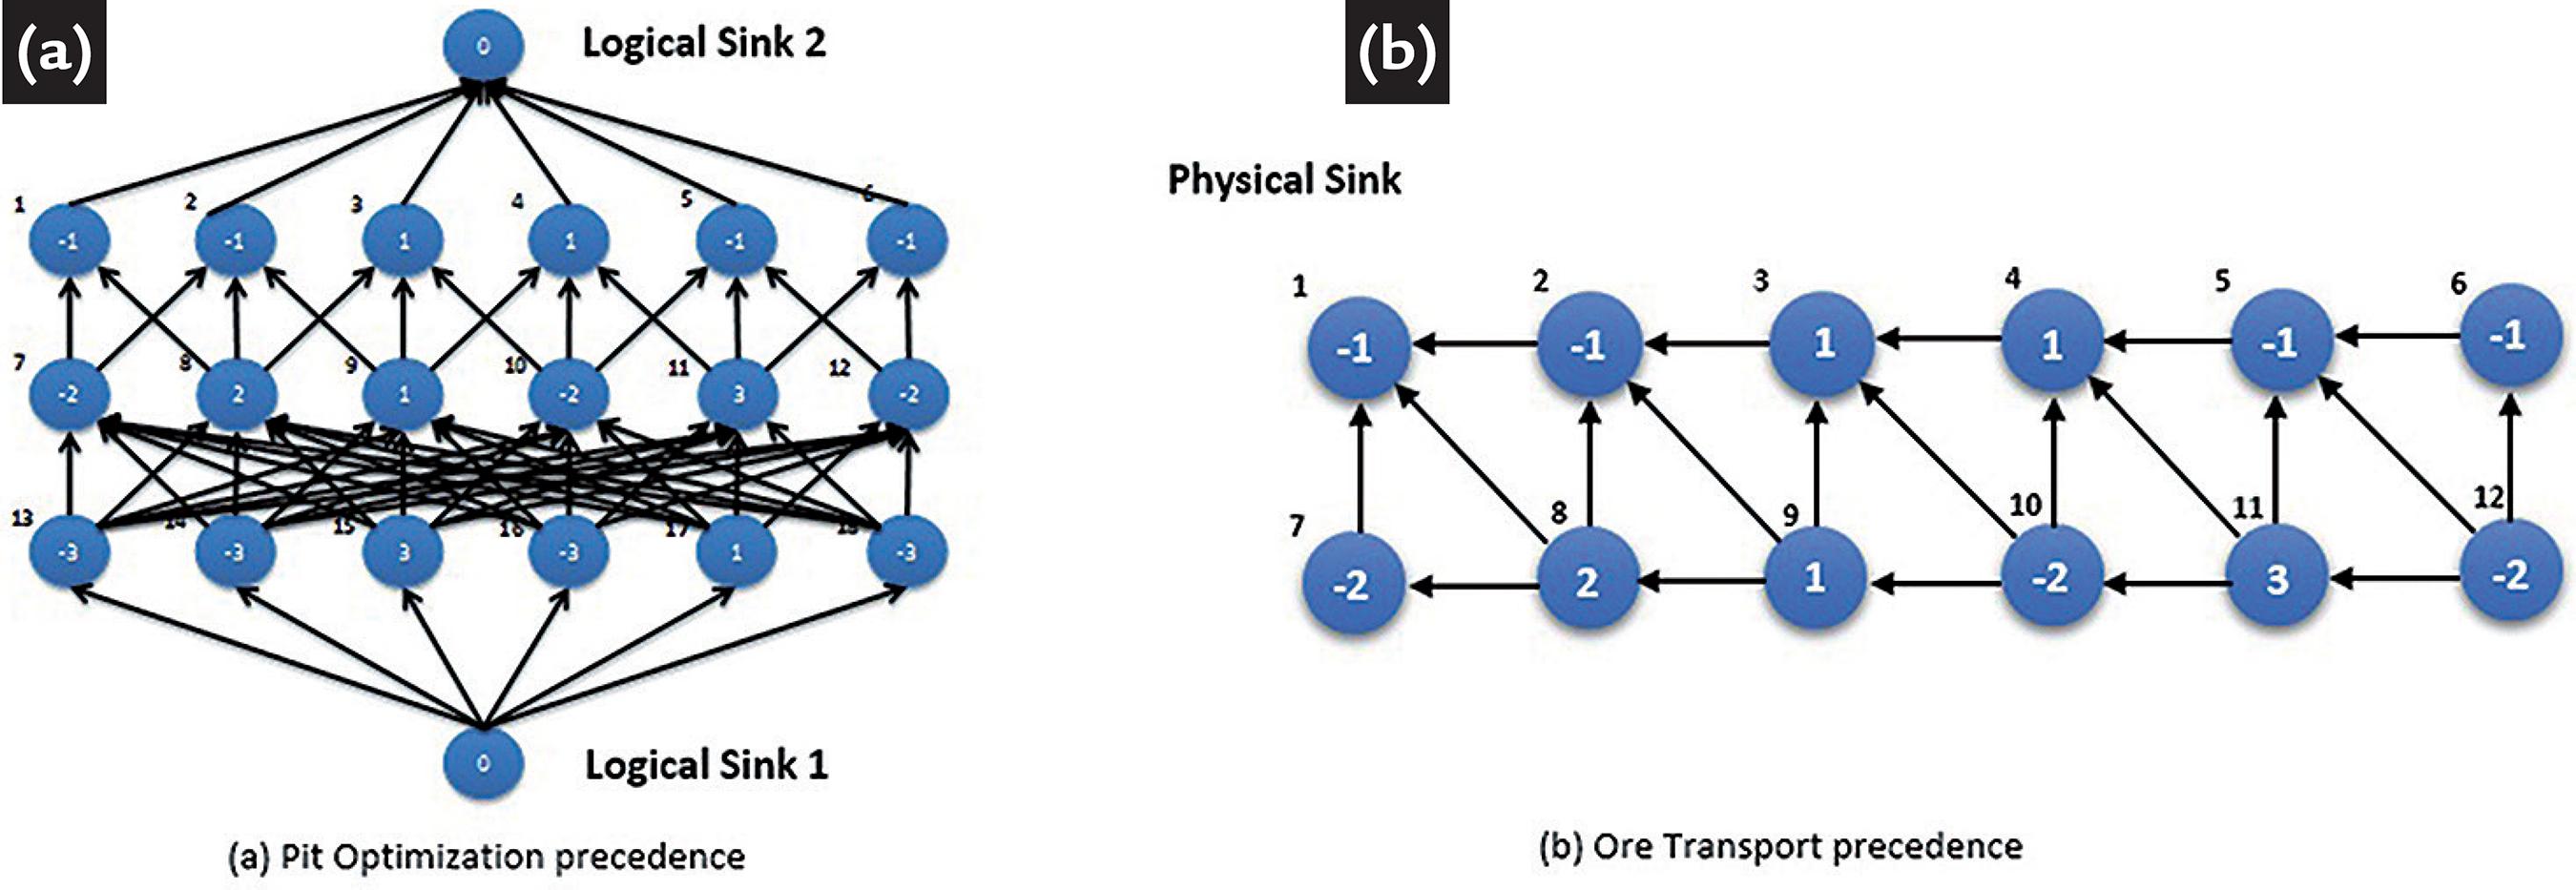
An approach very similar to the one presented herein is the final pit optimization problem because it also uses horizontal and vertical modelling of graphs. However, to model the precedence of the blocks for routing, it will be necessary to consider that vertical modelling will be different due to the differences between the roots or sink nodes. The sink is the node where all vertices' directions converge, which, in the case of the problem of ore transport modelled in this article, means that all nodes are directed towards the mill or waste dump. Figure 3(b) shows the physical sink (location of the transport destination) represented by node 1. The direction of the graphs is towards the path to be travelled along all nodes to node 1.
The graph attached to two nodes is only a neighbourhood representation, and the grade and size of these vectors in Figure 3 do not represent the grade and the distance between the blocks; for that representation, the distance model must be used. Seeking greater accuracy, a neighborhood search system was used based on the spatial proximity of nodes, a process that is computationally longer than that adopted by (KANG e colab., 2008KANG, Hwan Il, LEE, BYUNGHEE, KIM, Kabil. Path planning algorithm using the particle swarm optimization and the improved Dijkstra Algorithm. 2008 IEEE Pacific-Asia Workshop on Computational Intelligence and Industrial Application, p. 1002-1004, 2008. Disponível em: <http://ieeexplore.ieee.org/document/4756927/>.
http://ieeexplore.ieee.org/document/4756...
) and (CHICOISNE e colab., 2012CHICOISNE, Renaud e et alii. A new algorithm for the open-pit mine production scheduling problem. Operations Research, v. 60, n. 3, p. 517-528, 2012. Disponível em: <http://pubsonline.informs.org/doi/abs/10.1287/opre.1120.1050>.
http://pubsonline.informs.org/doi/abs/10...
).
Dijkstra Algorithm
The Dijkstra algorithm proposes to find the shortest path between two points; mathematically these points must be represented by nodes in a network of graphs. Dijkstra's initial work is simplified and addresses only the shortest path between two points (DIJKSTRA, 1959DIJKSTRA, E. W. A note on two problems in connexion with graphs. Numerische Mathematik, v. 1, n. 1, p. 269-271, 1959.). The study of Bellman-Ford (BELLMANN, 1958BELLMANN, R. E. On a routing problem. Appl. Math., v. 16, p. 87-90, 1958.) implemented the possibility of fixing a point and determining the shortest path to all other points in the graph. A common practical application is to use this algorithm to determine the shortest path between two cities considering the streets and highways to the destination (PAUL, 2011PAUL, Abraham. Data mining analytics to minimize logistics cost. International Journal of Advances in Science and Technology, v. 2, n. 3, p. 89-107, 2011. Disponível em: <http://www.researchgate.net/publication/233857554_Data_Mining_Analytics_to_Minimize_Logistics_Cost/file/9fcfd50c382502e4cf.pdf>.
http://www.researchgate.net/publication/...
). Sniedovich (SNIEDOVICH, 2006SNIEDOVICH, M. Dijkstra's algorithm revisited: the dynamic programming connexion. Journal of Control and Cybernetics, v. 35, n. 3, p. 599-620, 2006.) proposes a clear and structured division of the steps that must be performed to determine the minimum path between two points in a network of nodes, as follows:
-
Create a visitation matrix. This matrix must count all visited nodes.
-
Identify the current node as the beginning of the vertex, determine all possible arcs, and calculate the cost.
-
Find all unvisited neighbors. The methodology proposed by Sniedovich (SNIEDOVICH, 2006SNIEDOVICH, M. Dijkstra's algorithm revisited: the dynamic programming connexion. Journal of Control and Cybernetics, v. 35, n. 3, p. 599-620, 2006.) recommended calculating the costs in this step; however, the methodology applied herein calculates the costs in the previous step, due to the computational economy obtained when calculating the distance and precedence matrices simultaneously.
-
Find all the neighbors of the current node, and indicate in the visitation matrix all nodes as unvisited.
-
Verify if the destination node is the one planned to complete the search.
-
If the destination was not found, return to step 3.
To apply the Dijkstra methodology to find the lowest cost route, a set of nodes must be determined to construct the arcs. The centroids of the blocks is used to construct the nodes of the graph network. The destination of the transport is represented by an artificial block inserted into the model because the route destination needs geographic coordinates. The block model (C) must have acyclic behavior because in case of a closed cycle, the algorithm goes into an infinite loop, depending on the arrangement of the nodes. The analysis of the paths is composed of the set of predecessor arcs (i) and the successor node (j). As summarized above, the cost of a path can be determined by the sum of the predecessor arcs (F(i)) plus the cost of the analysed node (D(i,j)) for all of the system's nodes (n). The model can be expressed mathematically for all blocks of model (B).
To make the solution of the problem coherent with spatial reality in constructing the costs of each node, grade (G(i,j)) and curvature (R(i,j)) restrictions were applied. The cost (Cost(i,j)) was applied considering the Euclidean distance of the path and the travel time in different cost matrices.
Figure 4 shows the results of the algorithm for three different routes, where the results have grade and curvature values in accordance with the 10% inclination restriction and minimum curvature radius of 6 meters. The plan view of Figure 4, although presenting the mathematically correct curvature radius, is not operational because the initial curvature constraint was determined based on the linear distances of the curve's pivot points. To correct this non-operationality, post-processing will be applied, attempting to increase the result's adherence to reality.
2.2 Curve smoothing/parameterization
The methodology used to correct the pointy aspect of the curves at the graph vertices is called basic splines. The name splines is derived from the ruler used for building ramps by civil, naval and aeronautical engineering(WEGMAN e WRIGHT, 1983WEGMAN, Edward J., WRIGHT, Ian W. Splines in statistics. Journal of the American Statistical Association, v. 78, n. 382, p. 351-365, 1983.). According to Silverman (B . W . SILVERMAN, 2008B . W . SILVERMAN. Some aspects of the spline smoothing approach to non-parametric regression curve fitting. Journal of the Royal Statistical Society, v. 47, n. 1, p. 1-52, 2008.), the method has two purposes: to provide data on the relationship between the variables and provide predictions about not yet observed values. For the first purpose, the non-parametric method is better suited because it allows the model to be versatile and has a good fit to the data. Coefficients β0 through βn are the linear and angular coefficients of the polynomial that will be constructed by the regression. The point of convergence between the curve and the polynomial is defined as a node and is defined on the smoothed curve. The resulting equation is as follows:
The other coefficients β2, β3 and β4 will be multiplied by zero. When the x to be inserted into the equation is between the first and second node, the equation is as follows:
Figure 5 shows the result of parameterizing a section, in which smoothing was applied between segments whose deflection between nodes was greater than 35º and four nodes were used. Before applying the basic spline smoothing methodology, other parametrization methodologies with classical parametric equations such as Gaussian, sum of sines and polynomial were tested.
2.3 Application of Costs
The cost refers to the penalty between the nodes of the built network of graphs, which by association refers to the value between the nodes of the line that compose the path travelled by the equipment. The Euclidean distance is calculated using the coordinates of the nodes that compose the segment; to calculate the transport time, it is necessary to use the conditions of movement for the point bodies. To determine the speed on the sections for each segment, the specifications of the truck manufacturer were used, which in this study were from Caterpillar (CATERPILLAR, 2004CATERPILLAR. Performance Handbook. Caterpillar Inc. Peoria, Illinois, U.S.A: [s.n.], 2004.). Table 1 shows the assumptions adopted for the case study. To determine the total resistance, Equations 3 to 6, based on the study of Ricardo (RICARDO, 2007RICARDO, Helio de Souza, CARALANI, G. Manual prático de escavação - terraplenagem e escavação de rocha. (3a ed.). [S.l.]: Pini, 2007.), were used.
As this manual does not present an explicit mathematical function capable of representing the curve, it was necessary to determine the mathematical function to use in the developed program. To determine the curve shown in Figure 6, the sum of sines method was used, and the result can be observed in the blue curve.
The adjustment resulted in a curve composed of three fractions, as it was determined by a sine sum system of degree 3. Equation 7 shows the Total Resistance as a function of speed (x) based on Table 2 coefficients values.
However, Equation 7 does not present a direct relationship between the grade and velocity of the transport equipment. Considering the intersection points of the grade with the motor curve in Figure 6, it is possible to identify the black dots in Figure 7.
For the representation of the regression curve of Figure 7, a polynomial of degree 3 was used, which can determine the speed (S) of the equipment in the segment based on the road grade (G) of the stretch between two nodes of the graph network.
3. Results and discussion
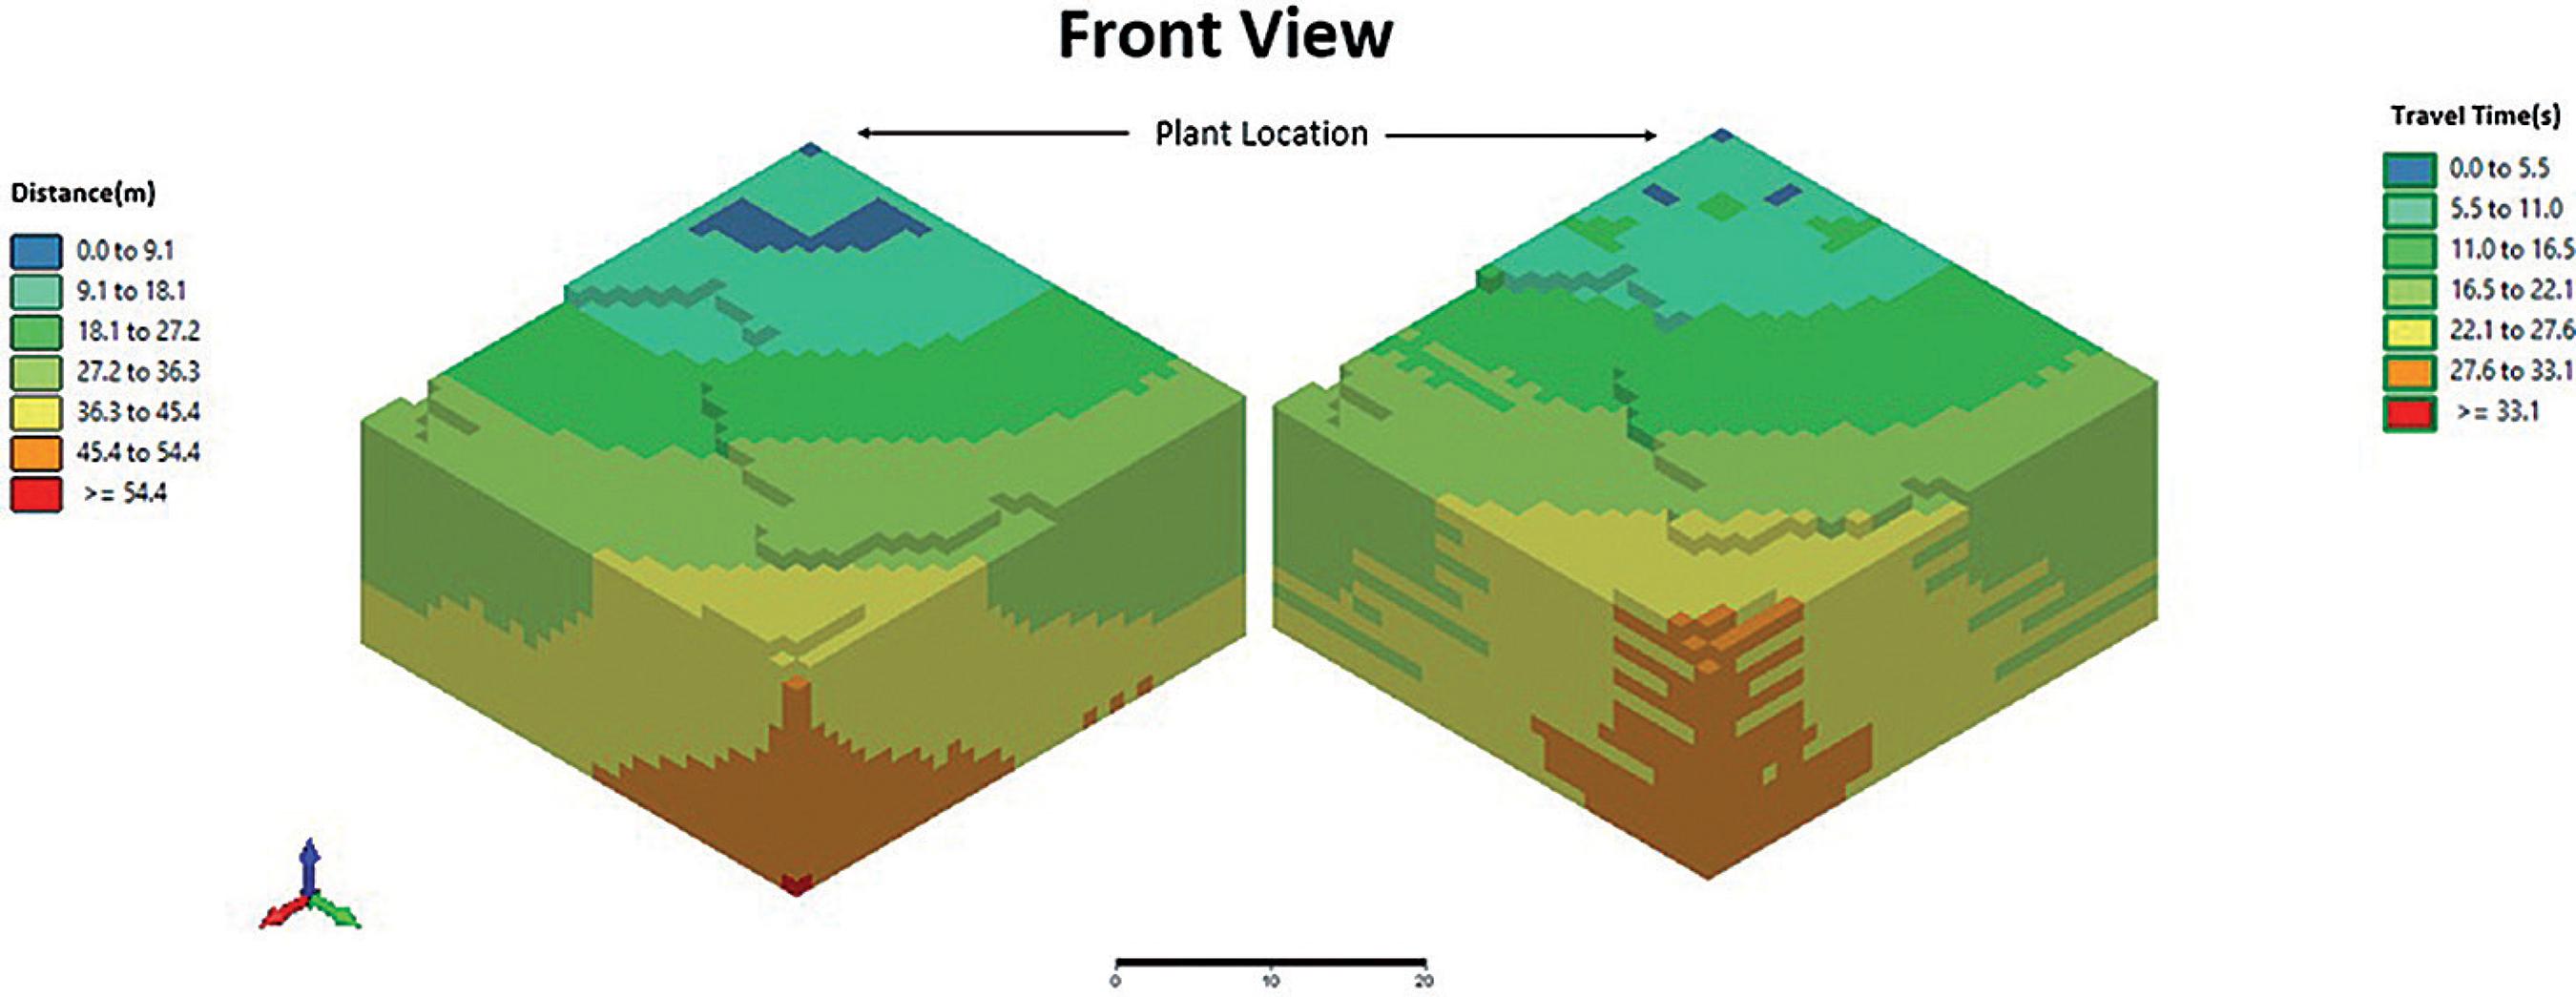
The developed algorithm determines the lowest cost path based on Dijkstra's theory for time and distance for all blocks in the block model. It is important to note that the analysed values correspond to the movement of a loaded truck towards the unloading point, which can be a waste facility or a plant. To validate the proposed algorithm, different scenarios were composed with 9%, 10% and 11% of the maximum route grade. It is important to consider that the grade is limited to the maximum allowed value, which does not mean that all routes will have the same limit. Each block of the model will be analysed separately and the algorithm will determine the best path to minimize the control variable. Figure 8 shows the result based on a 11% grade, for both the distance and time approaches. The figure to the left shows the blocks marked with the distance control variable based on the determined optimal path; to the right, the result based on time is shown. It can be observed that changing the distance and time control variables causes a change in the route for each control variable, grade restriction and curvature radius, which will result in a different minimum cost path.
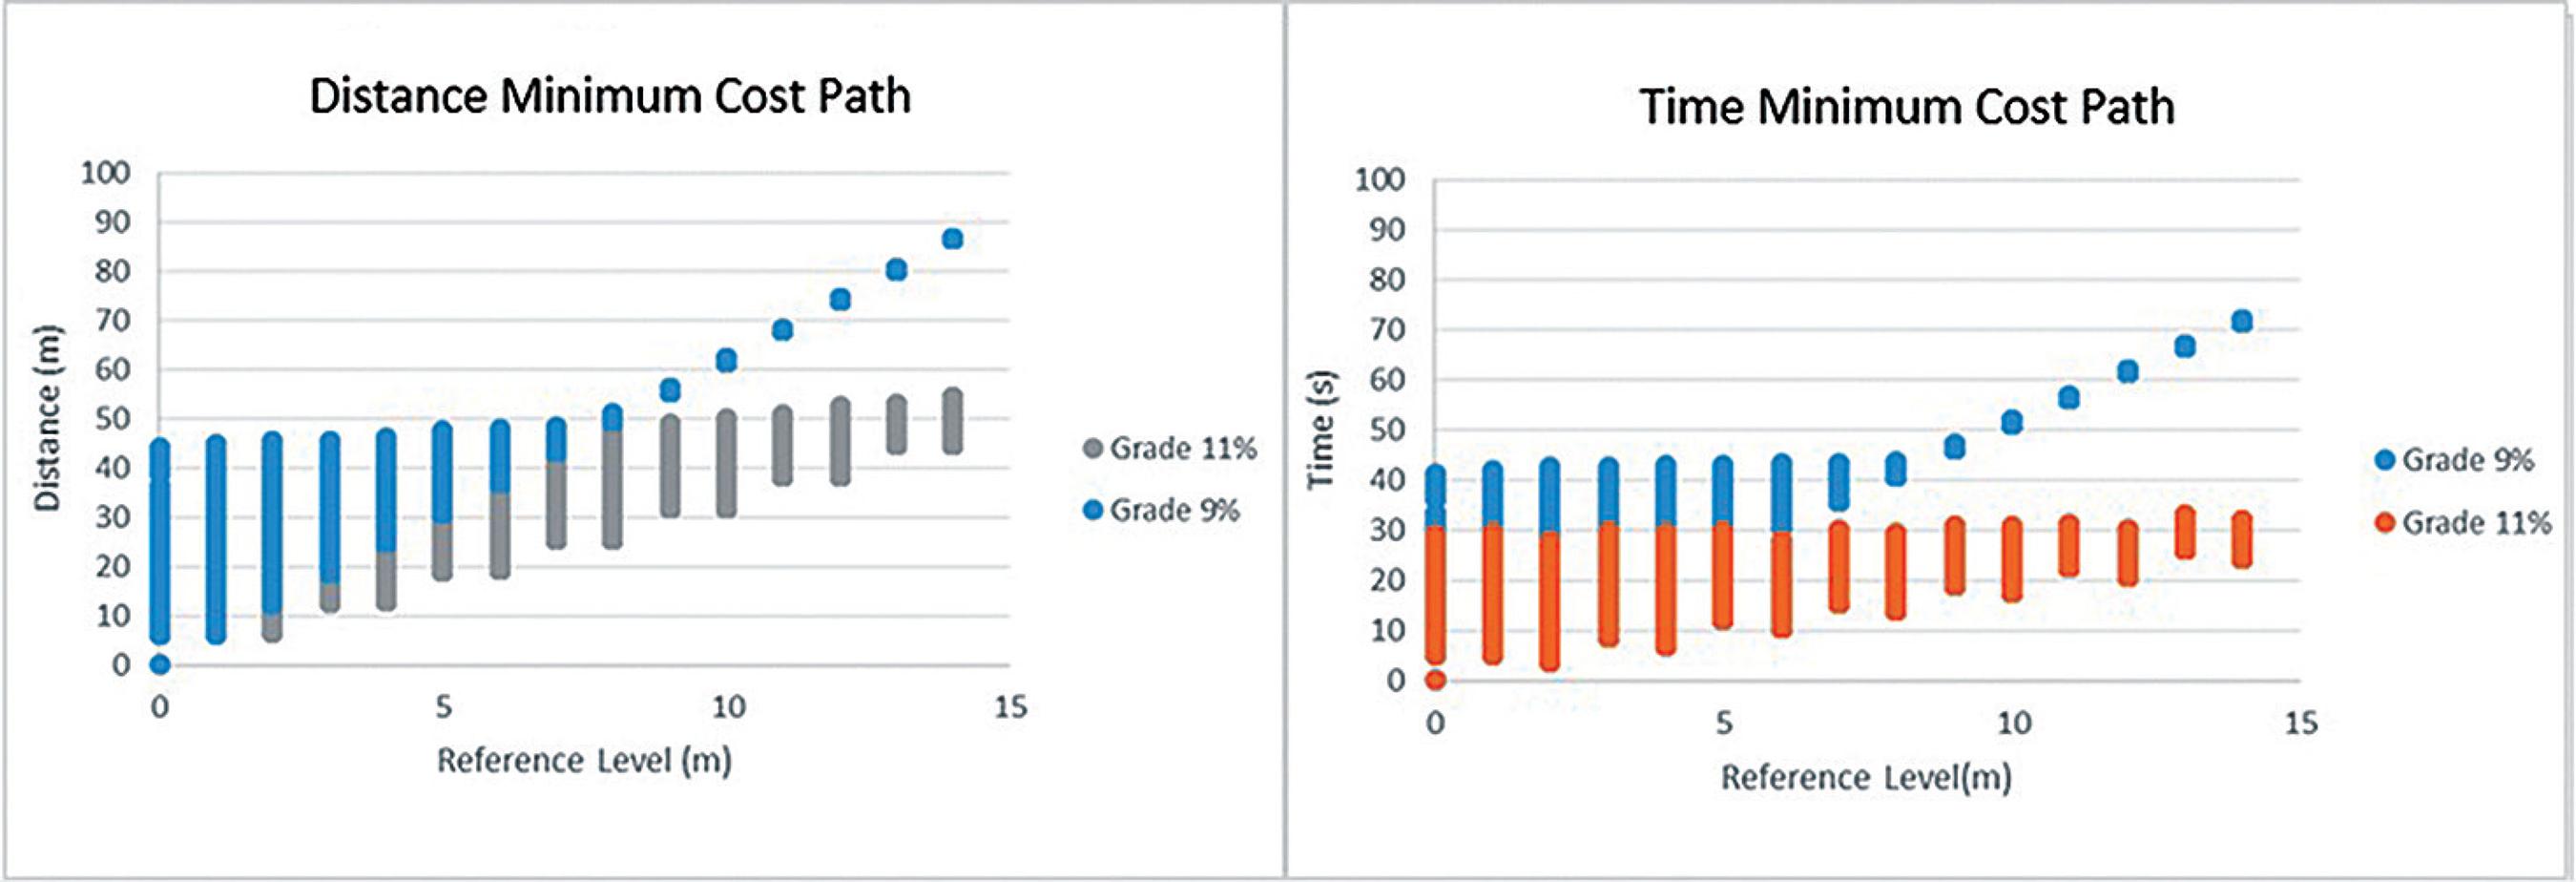
To construct the minimum cost paths, the equipment's movement conditions, represented by equation 8, grades between 9 and 11%, and a curvature radius of 6 metres were used. This curvature radius is adequate because the block model has blocks of 1 meter in length and width and the route width will be compatible with a 6-block width. Of course, a mining operation deepens the level of the work location over time. Figure 9 shows on the x-axis the reference level, which represents the number of meters that was excavated below the topography and the distance and time values found as the work level deepened. It can be observed that starting at level 8, we have a heightened increase in time and transport distance for the more restrictive 9% grade.
The relationship between the length of the route and the required travel time must be directly proportional; however, to understand how the cycle time is affected by the increase in distance it is of fundamental importance to measure the loading and transport operations. Figure 10 shows that the lower the road grade, the closer the transport time is to the bisector, considering the gradient variation with a greater distance covered and at a higher speed. However, in the analysed case, the higher speed was not sufficient to guarantee a shorter transport time; the greater road grade generates less effective distance traveled, which was not sufficient to decrease the cycle time. According to Figure 10, a change of only 2% in the gradient increased the maximum transport distance of lower cost by approximately 62%.
4. Conclusions
Conventional methodologies for estimating mining costs consider Euclidean distance or spatial position as a factor for cost penalties, but this study shows that this relationship is not satisfactory as the distance from the loading point increases.
It is important to consider that the geological model can negatively influence the methodology, if the size of the blocks is too large because very large blocks do not allow controlling the curvature radius of the equipment with quality.
The analysis of Figure 9 allows identifying in which mining level the operating cost suffers a significant increase. Note that the distance and transport time between levels 1 and 7 has a smooth increase; after this range, a significant increase occurs. Up to level 7, the transport distance is less than 50 meters; at level 14, the distance has risen to almost 90 meters. This information can be used in mine planning and sequencing, that will tend to first mine the regions of greatest economic benefit. The methodology is able to determine the cost increase of transport equipment movement according to the operational and spatial conditions of each specific mine operation, avoiding the use of empirical rules and non-real fixed costs.
Figure 10 allows identification of a linear relationship between the minimum distance and the minimum transport time; however, this does not mean that all enterprises will exhibit the same linear behavior. A lower route grade value leads to a reduction in the horizontal distance to vary the vertical dimension. The speed developed in a steeper route is slower; the analysis of this model leads to the choice of a greater road grade because despite the greater distance covered when using the 11% grade, i.e. approximately 62% more, the higher speed contributed to the reduction of the cycle time.
References
- B . W . SILVERMAN. Some aspects of the spline smoothing approach to non-parametric regression curve fitting. Journal of the Royal Statistical Society, v. 47, n. 1, p. 1-52, 2008.
- BELLMANN, R. E. On a routing problem. Appl. Math, v. 16, p. 87-90, 1958.
- BOGNA MRÓWCZYŃSKA. Optimal routes scheduling for municipal waste disposal garbage trucks using evolutionary algorithm. Transport Problems, v. 6, n. 4, 2011.
- CATERPILLAR. Performance Handbook. Caterpillar Inc. Peoria, Illinois, U.S.A: [s.n.], 2004.
- CHICOISNE, Renaud e et alii. A new algorithm for the open-pit mine production scheduling problem. Operations Research, v. 60, n. 3, p. 517-528, 2012. Disponível em: <http://pubsonline.informs.org/doi/abs/10.1287/opre.1120.1050>.
» http://pubsonline.informs.org/doi/abs/10.1287/opre.1120.1050 - COMMUNICATION, Ministry of. Geometric Design Standards for Roads & Highways Department. Government of the People's Republic of Bangladesh Ministry of Communications Roads and Railways Division, n. October, 2000.
- DIJKSTRA, E. W. A note on two problems in connexion with graphs. Numerische Mathematik, v. 1, n. 1, p. 269-271, 1959.
- JULA, Hossein et alii. Full-truck-load assignment and route planning in deterministic and stochastic environments. In: NSF DESIGN AND MANUFACTURING GRANTEES CONFERENCE, 1. p. 2957-2971, 2003.
- KANATANI, Kenichi. Comments on "nonparametric segmentation of curves into various representations". IEEE Transactions on Pattern Analysis and Machine Intelligence, v. 19, n. 12, p. 1391-1392, 1997.
- KANG, Hwan Il, LEE, BYUNGHEE, KIM, Kabil. Path planning algorithm using the particle swarm optimization and the improved Dijkstra Algorithm. 2008 IEEE Pacific-Asia Workshop on Computational Intelligence and Industrial Application, p. 1002-1004, 2008. Disponível em: <http://ieeexplore.ieee.org/document/4756927/>.
» http://ieeexplore.ieee.org/document/4756927/ - MUNIRATHINARN, Mohan, YINGLING, Jon C. A review of computer-based truck dispatching strategies for surface mining operations. International Journal of Surface Mining, Reclamation and Environment, v. 8, n. 1, p. 1-15, 1994.
- PAUL, Abraham. Data mining analytics to minimize logistics cost. International Journal of Advances in Science and Technology, v. 2, n. 3, p. 89-107, 2011. Disponível em: <http://www.researchgate.net/publication/233857554_Data_Mining_Analytics_to_Minimize_Logistics_Cost/file/9fcfd50c382502e4cf.pdf>.
» http://www.researchgate.net/publication/233857554_Data_Mining_Analytics_to_Minimize_Logistics_Cost/file/9fcfd50c382502e4cf.pdf - PEURIFOY, Robert Leroy, LEDBETTER, William Burl. Construction planning, equipment, and methods (4. ed.).. New York, NY: McGraw-Hill, 1985.
- RICARDO, Helio de Souza, CARALANI, G. Manual prático de escavação - terraplenagem e escavação de rocha (3a ed.). [S.l.]: Pini, 2007.
- RICHARDSON, Mike, NICHOLLS, Peter. A business and labour history of Britain [S.l.]: Palgrave MacMillan, 2011.
- RODRIGUES, Lásara Fabrícia, PINTO, Luiz Ricardo. Análise comparativa de metodologias utilizadas no despacho de caminhões em minas a céu aberto. Rem: Revista Escola de Minas, v. 65, n. 3, p. 377-384, 2012. Disponível em: <http://www.scielo.br/scielo.php?script=sci_arttext&pid=S0370-44672012000300015&lng=pt&tlng=pt>.
» http://www.scielo.br/scielo.php?script=sci_arttext&pid=S0370-44672012000300015&lng=pt&tlng=pt - RUNGE, Ian C. Mining economics and strategy [S.l.]: SME, 1998.
- SNIEDOVICH, M. Dijkstra's algorithm revisited: the dynamic programming connexion. Journal of Control and Cybernetics, v. 35, n. 3, p. 599-620, 2006.
- SOUZA, Felipe Ribeiro, MELO, Michel. Mining. REM, v. 67, n. 4, p. 389-395, 2014.
- THOMPSON, R J, VISSER, A T. The functional design of surface mine haul roads. The Journal of The South African Institute of Mining and Metallurgy, v. 100, n. 3, p. 169-180, 2000.
- WEGMAN, Edward J., WRIGHT, Ian W. Splines in statistics. Journal of the American Statistical Association, v. 78, n. 382, p. 351-365, 1983.
Publication Dates
-
Publication in this collection
Apr-Jun 2019
History
-
Received
23 Aug 2018 -
Accepted
04 Dec 2018

 (Source: Authors)
 (Adapted from Souza (