
Abstract
This article deals with the rheology of tailings deposits related to dam break analysis. The material used was a fine tailings from iron ore processing. Geotechnical and rheological characterization of these tailings were performed. The rheological characterization consisted of rotational and oscillatory tests. It was observed that the rheological properties depend on material solids content and sample preparation method. Furthermore, the material showed viscous or viscoplastic fluid behavior, depending on the solids content. The results of the rheological tests were used as input in numerical flow simulations using Flow-3D® software. Failure of a hypothetical tailings deposit was simulated, with different scenarios. Relationships between traveled distance (range, spreading), speed, and time of arrival of the flow wave versus rheological properties were determined. It was found that tailings runs are also strongly influenced by the solids content and deposit stress history (formation), resulting in different flow types ranging from mudflood, through mudflow, and even landslide. A major finding was that in the Flow-3D® analyses, the deposit volume mobilized, and the output hydrograph are parts of the solution, and not premises or a model to follow (e.g. design breach).
Keywords:
rheology; viscoelastic materials; mine tailings deposit; dam break; FLOW-3D®
1. Introduction
Today’s tailings disposal is being reviewed worldwide. Techniques called alternative methods, which promote water reduction in the tailings, have been receiving considerably more attention. This trend seems to guide new projects and should change the way one sees risk in these operations.
The amount of water in the slurry results in a material with different conditions. Thickened or paste tailings usually exhibit a visco-plastic non-Newtonian behavior. They show a yield stress (τ0) and a viscosity (η) that vary with shear rate (γ ) (Pullum et al., 2018PULLUM, L.; BOGER, D. V.; SOFRA, F. Hydraulic mineral waste transport and storage. Annual Review of Fluid Mechanics, v. 50, n. 1, p. 157-185, 2018.). This amount of water can be modified by different ways: sedimentation, consolidation, percolation forces, loading, evaporation and/or drainage, and shearing forces. These processes may occur naturally in the tailings reservoirs or artificially as in an industrial solid-liquid separation process (e. g., thickener, cyclone, filtration, vacuum).
Considering fine tailings deposits, the accumulation of material may occur in different ways, from a self-supporting pile to a deposit confined by a containment structure. In these cases, the material will be modified according to physical processes (sedimentation, consolidation, and desiccation) or even due to chemical reactions, such as curing cement in tailings paste. Oliveira-Filho and Van Zyl (2006)OLIVEIRA-FILHO, W. L.; VAN ZYL, D. Modeling discharge of interstitial water from tailings following deposition - Part 1. Solos e Rochas, v. 29, n. 2, p. 199-209, 2006. technically explain the natural evolution of tailings deposits created from a diluted suspension.
The creation and evolution of the deposit implies that its constituents, solid particles and water, are arranged according to specific structures associated with the formation process (e.g., sedimentation in water, mechanical compaction). That will result in states of stress and deformation not necessarily in equilibrium, as their natural counterpart deposits (Oliveira-Filho & Abrão, 2015OLIVEIRA-FILHO, W. L.; ABRÃO, P. Disposição de rejeitos de mineração. In: ZUQUETTE, L. V. (org.). Geotecnia Ambiental. Rio de Janeiro: Elsevier, 2015.).
Usually, the conventional tailings deposits are, initially, in the probable condition of liquid viscoplastic material, and therefore susceptible to flow. As the deposit ages and is subjected to a natural thickening process, the material achieves a plastic state (water content between liquid limit and plastic limit). Rheologically, it corresponds to the solid viscoplastic condition. Under shear stress, this material could only experience large deformations, with larger or smaller spreading, depending on its solids content. In this sense, O'Brien & Julien (1985)O'BRIEN, J. S.; JULIEN, P. Y. Physical properties and mechanics hyperconcentraded sediment flows. In: SPECIALTY CONFERENCE - DELINEATION OF LANDSLIDE, FLASH FLOOD AND DEBRIS FLOW HAZARD IN UTAH, Logan, 1984. Proceedings […]. Utah: Utah State University, 1985. p. 260-279. explain the flow characteristics and large deformations as a function of solids concentration. This means that flows vary from mudflood, passing through mudflow and then to landslides.
The ability to flow or undergo excessive deformations are crucial points to understand the risks associated with tailings deposits. For this reason, it is important to understand the material rheology, science that deals with these effects.
2. Methodology
In order to achieve the results of this research, rheological tests on fine tailings from an iron ore tailings dam were performed. The referred dam is located in the Quadrilatero Ferrifero, Minas Gerais State, southeast of Brazil. Moreover, FLOW-3D v12.0, a computational fluid dynamics (CFD) software, was used for simulations of hypothetical failures of a dam reservoir built with this material.
2.1 Material characterization
The sample characterization involved: a) determination of the mineralogical composition, using X-ray diffractometry; b) grading analysis, by wet sieving and laser granulometer; c) specific gravity, using the Helium gas pycnometer; d) plasticity of fines, by Casagrande's liquid and plastic limits.
2.2 Sample preparation for rheological tests
Disturbed and undisturbed samples were used and tested in a rheometer. The disturbed samples were intended to represent the material that is thickened in the plant. In its turn, the undisturbed samples were sought to reproduce the material that undergoes the natural thickening process, during its formation in a tailings deposit. The different solids contents (p) represent the different ages of the deposit. To prepare the samples, the following steps were followed:
-
Disturbed samples: Disturbed samples were prepared at a specified solids content. Amounts of dry material and water were weighed, and then mixed. The slurry formed was homogenized in a disperser for five minutes and then used in a test. The sample was discarded at the end of each test.
-
Undisturbed samples: Undisturbed samples reached a required solids content in a natural way by sedimentation and consolidation or consolidation and desiccation, described as follows. Samples were prepared with initial solids contents of 36% or 50%. The material was placed in the rheometer cup, to its full capacity, and allowed to sediment and/or self-weight consolidate for 24 hours. After this, the layer of the supernatant water was removed and a second layer of material at a same initial solids content was placed on the top of the initial layer. Then, the material was allowed to undergo sedimentation and consolidation for another 24 hours and after this, the supernatant water was removed. Higher solids content samples were obtained through a desiccation process. For this, an additional step was carried out by keeping samples at a temperature of 50 ºC for a few hours, in order to accelerate the water evaporation process. The time that each sample was submitted to this process varied according to the solids content.
2.3 Rheological tests
Rheological tests were performed using the Anton Paar's MCR 92 rheometer. This equipment has a highly accurate air-bearing motor technology, which allows measurements in both rotation and oscillation. It consists of a stationary cylindrical cup, where the sample is placed, and a vane, which penetrates the sample, chosen because it is the most used device for mineral slurry. The reason for this is that when using a cylindrical device, there may be slips between its surface and the material (Kwak et al. 2005KWAK, M; JAMES, D. F.; KLEIN, K. A. Flow behaviour of tailings paste for surface disposal. International Journal of Mineral Processing, v. 77, n. 3, p.139-153, nov. 2005.). The results were analyzed using RheoCompass™, an imbedded software. The performed test types are presented in Table 1.
2.4 Dam break simulations
Dam break analyses of a hypothetical tailings dam were performed using FLOW-3D® v12.0 software. Several physical models are provided by the software, allowing to model many physical and chemical flow processes. For this study, the physical models considered in the simulations were: elasto-visco-plasticity, gravity and non-inertial reference, and viscosity and turbulence.
2.4.1 Model geometry
The model geometry, which has the simplified shape of a parallelepiped, is referenced in a Cartesian XYZ system. The model has an internal transversal and vertical division of infinitesimal thickness, resulting in two regions One region represents the reservoir filled with some of the materials under analysis for the dam break study. The other region represents the downstream valley of the dam. The adopted dimensions to study the dam break were 10 m high (Z axis), 1 m wide (Y axis) and 100 m long (X axis) for the reservoir section. In front of the deposit, in the direction of the wave propagation (X axis), the distance of 500 m was adopted. The fluid location was defined using the fluid elevation option, which requires only the coordinate of the free surface. In the void space, a pressure value equal to the atmospheric pressure (1 atm) was considered. Figure 1 illustrates the model geometry. A simulation with this same geometry was also performed, however, with an inclination of 1° (1.75%). In order to monitor the flow along the downstream section, some points were chosen. The distance between them varied according to the simulation case.

2.4.2 Model scenarios
Simulation scenarios were divided in two categories: base studies and sensitive studies. In the base studies, directly determined rheological properties were used. Concerning the sensitive studies, an attempt to expand findings for other concurrent factors (non-leveled terrain, high solids content beyond this research experimental data, field data) was made. The main characteristics of the simulation scenarios are shown in Table 2. Scenarios 1, 2 and 3 correspond to the base scenarios and scenarios 4, 5 and 6 to the sensitive ones.
The rheological properties corresponding to Scenarios 2 and 3 were obtained directly from the CSR tests performed on undisturbed samples. The rheological properties of Scenario 4 were the same as Scenario 3, but a terrain inclination of 1.7% was used. For scenario 5, yield stress was obtained through extrapolation of an experimental curve, as shown in Figure 2. Scenario 6 was named after Penna, as the undrained shear resistance obtained by Penna (2007PENNA, D. C. R. Análise acoplada entre consistência e resistência não drenada de um rejeito fino de minério de ferro. 2007. 135 f. Dissertação (Mestrado em Geotecnia) - Escola de Minas, Universidade Federal de Ouro Preto, Ouro Preto, 2007.) was used as the yield stress. Penna (2007)PENNA, D. C. R. Análise acoplada entre consistência e resistência não drenada de um rejeito fino de minério de ferro. 2007. 135 f. Dissertação (Mestrado em Geotecnia) - Escola de Minas, Universidade Federal de Ouro Preto, Ouro Preto, 2007. used samples taken from a field test deposit consisting of the same material used in this research. However, the material used in his study was obtained directly from the beneficiation plant. Another factor explored by Penna (2007)PENNA, D. C. R. Análise acoplada entre consistência e resistência não drenada de um rejeito fino de minério de ferro. 2007. 135 f. Dissertação (Mestrado em Geotecnia) - Escola de Minas, Universidade Federal de Ouro Preto, Ouro Preto, 2007. was the increase in resistance due to negative porewater pressures (suction), which arose during the drying process observed in the field. It was not possible to reproduce these conditions in the laboratory tests.

Some other premises were assumed for the simulations: a) there was no erosion or carrying material along the path followed by the propagating wave; b) the material consisted only of tailings (or water); c) the reservoir was formed by a single material with homogeneous properties; d) a friction coefficient was not specified, so that by default, the bottom and lateral surfaces were defined as non-slip surfaces; e) the yield stress values used were those obtained from the flow curve of the rotational tests with the vane geometry.
3. Laboratory tests
This section presents the results of the material geotechnical characterization, as well as the results of the rheological tests. Some of these results were used in the numerical simulations presented in the next section.
3.1 Basic characterization
Table 3 presents the results of geotechnical and mineralogical characterizations.
3.2 Rheological tests
The analyses of the data obtained from the rheological tests allowed to classify the material, when in flow, as a pseudoplastic and a thixotropic fluid. Table 4 shows the yield stresses of each solids content sample, as well as the apparent viscosity at certain shear rates. It was observed that the yield stress increased with the increase of the solids content, as expected. Boger (2015BOGER, D. V. Rheological concepts. In: JEWELL, R. J.; FOURIE, A. B. (ed.). Paste and thickened tailings: a guide. 3rd ed. Perth, WA: ACG, 2015. cap 3, p. 21-43.) reports that most suspensions of mineral tailings exhibit an exponential increase in yield stress with an increase in the concentration of solids, as the interactions between particles become more relevant. This behavior was also observed in the material used in this research, as shown in Figure 2. The yield stress values used in the simulations of scenarios 3 and 4 were calculated using the equation of the curve shown in Figure 2, as explained in item 2.4. The yield stress values corresponding to Scenarios 3 and 4 were 1,990 Pa and 5,563 Pa, respectively.
It can be noted that the values of viscosity, shown in Table 4, are extremely high for the low shear rate ranges. Those values are meaningless, as the material at rest or under low shear strain rate behaves like a solid, and not as a liquid, as shown by the results of the amplitude sweep tests (Figure 3).

The asterisks shown in Figure 3 designate the stress levels when the material behavior changes from gel (solid visco-plastic) to sol (liquid visco-plastic). At this point, the storage modulus (G") becomes greater than the loss modulus (G'). G" and G' are the real and the imaginary parts of the complex module, G*, respectively. The triangles, also known as flow points, indicate the limit of the linear viscoelastic range (LVE). The values of each of these quantities are presented in Table 5.
To complement the understanding of viscoplastic behavior of disturbed and undisturbed samples, frequency sweep test results can be useful, as shown in Figure 4. It is noted that undisturbed samples show a solid viscoplastic behavior throughout the whole frequency range. This shows the stability of these suspensions, while the disturbed samples show a liquid viscoplastic behavior under low frequencies. Also, the undisturbed samples showed higher structural strength (consistency), since this kind of sample presented higher values of storage modulus (G'). It is believed that the reason for this behavior is that the internal structure of the disturbed samples is not yet fully formed, since they are still in the process of consolidation.

4. Dam break simulations
With the purpose of comparisons (except scenario 4), the results of the wave propagation for all scenarios are presented together in Figure 5. The left column shows the initial situation (t = 4.2 s) and the right column shows the heights at the end of the simulation (t = 420 s), not necessarily the end of wave propagation. The color scale represents the flow heights, blue representing the lowest height and red the highest one. Figure 6 shows the behavior of the propagation wave in scenario 4 (inclined terrain) at two different instants: just after the failure, 4.8 s (left side), and 480 s, final simulation time (right side). Both Figures 5 and 6 are outputs from the software.


4.1 General behavior
The results in Figure 5 and 6 depict different forms of flow, depending on the rheological properties of the fluid and of the environment. According to O'Brien & Julien (1985)O'BRIEN, J. S.; JULIEN, P. Y. Physical properties and mechanics hyperconcentraded sediment flows. In: SPECIALTY CONFERENCE - DELINEATION OF LANDSLIDE, FLASH FLOOD AND DEBRIS FLOW HAZARD IN UTAH, Logan, 1984. Proceedings […]. Utah: Utah State University, 1985. p. 260-279., these deposit material movements could be classified as: water flood in scenario 1; mud flood in scenario 2 and 4, where fluid spreads almost completely; mud flow in scenarios 3 and 5, a kind of cohesive flow, presenting an angle of repose; or even landslide in scenario 6 (Penna´s), with a fast movement, high deformation, with no flowing.
In addition, a relationship between the traveled distance by the wave and the yield stress, or the solids content, was observed. The wave resulting from the tailings deposit with 60% of solids was still flowing at the instant shown in Figure 5. However, it stopped at abscissa 630 m (not shown). The tailings with 75% of solids reached 225 m. The material with 80% of solids travelled 128 m before stopping. In Penna’s case spreading extended only 20 m from the deposit foothill. Therefore, the higher the yield stress, the shorter the distance traveled by the material.
In Scenario 4, flow was still occurring. Comparing Scenarios 3 and 4, it can be noted that for an inclined terrain, there is an increase in the traveled distance. This change is due to the additional force in the problem: the gravitational force component in the direction of the movement.
4.2 Hydrograph
The results of the simulations show how the rheology of the material and the inclination of the terrain affect the flow rate (Figure 7). The analysis of diverse hydrographs revealed that, with the increase in the fluid viscosity, there was a higher decay of the flow rate. This means that the release of tailings from the deposits with higher solids contents occurs in a slower way, showing an inverse relationship between the average speed and the solids content. The addition of the inclination component resulted in an increase in the speed and in the traveled distance of the wave. This behavior was similar to a material with lower solids content. It was observed that the higher the solids content, the lower the wave speed and, consequently, the longer the wave arrival time, especially in regions further downstream. These are important aspects in any possible evacuation plan for areas close to the dam.

4.3 Released volume
Figure 8 shows volume change of deposit material over time for Scenarios 2, 3, 4, 5 and 6, which are the deposits that contain tailings, taking as reference the initial volume of 1,000 m3 (10 × 1 × 100 m). In Scenario 2, the tailings release occurred extremely fast, with almost the entire volume released in the first 50 seconds. In the other scenarios, most of the volume was also released in the first seconds. However, it extended over a longer period, as the flow rate was lower, except for Penna’s deposit, in which the movement occurred almost instantly.
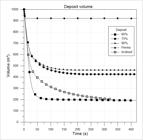
Furthermore, analyses can also be performed regarding the volume of material that remained in the deposit after failure. In none of the simulated scenarios, a total mobilization of the material was observed. In the tailings deposit with 60% of solids content and in the inclined terrain, the volume of material released in the failure was 81%. For the deposits with 75% and 80% of solids contents, released were 57% and 42% of material volume, respectively. For the Penna’s deposit, only 9% was released.
5. Further discussion
5.1 Rheological tests
The rheological results showed that both solids content and the way that the sample was prepared influenced the rheology of the material. Undisturbed samples, i.e., the ones that reached solids content in a natural way through sedimentation, consolidation, and desiccation, proved to be more consistent and resistant than those with no field history (disturbed, or artificially prepared). The same was observed in respect to the increase in the solids content. In this case, both disturbed and undisturbed samples became more consistent and resistant (higher rigidity) as the solids content increased. It was also observed that gel/sol transition was delayed with an increase in the solids content, as well as in the undisturbed samples.
5.2 Numerical simulation results
The main results of all simulations are compiled in Table 6. It was observed that the dam break results are highly influenced by the rheology of the deposit material and, particularly, by the variation of the solids content, as follows:
-
Material released was significantly reduced with increasing solids content.
-
Flux velocity and traveled distance were also affected (reduction) with increasing solids content.
-
The increase in the yield stress leads to a higher angle of repose of the material (as seen in Figure 5). Therefore, the amount of material that remained in each section was higher.
-
The terrain inclination showed some equivalency with lower solids content.
In addition, different rheological behavior of tailings samples (if disturbed or undisturbed) found in the experimental work helped to realistically perform dam break simulations. Since it was assumed that undisturbed samples represent the tailings deposit materials and that they reached their status naturally, it was expected that these materials would show higher resistance to flow. This means that flow would start later for these materials (at higher stresses), and that they would stop flowing earlier.
Finally, it is interesting to note that in Flow-3D® analyses, deposit volume that will be mobilized, as well as the output hydrograph are part of the solution. They evolve based on material properties and are highly affected by deposit formation, physical constraints, and natural constitutive laws. In modelling, these aspects are usually taken as premises or follow a model (e.g., design breach).
6. Conclusions
The rheological tests showed that viscosity and yield stress are highly influenced by both solids content and sample preparation. The increase in the solids content resulted in an exponential increase of the yield stress and a relatively more viscous behavior, especially at lower stresses and flow rates. They also affected the gel/sol transition, which was delayed with an increase in the solids content, as well as in the undisturbed samples. Regarding samples prepared with the same solids content, it was observed that those that experienced a natural thickening, undergoing physical processes of sedimentation, consolidation and desiccation (undisturbed samples), showed higher yield stress than the deformed samples, prepared directly with the specified solids content. Therefore, undisturbed samples showed higher structural strength than the disturbed ones.
Rheological impacts in the flow analyses due to the solids contents resulted in different flow modes, ranging from mud flood, mudflow and landslides. Consequently, it was found that these rheological properties also influenced the speed, the arrival time of the wave, the volume of material that was released, and the angle of repose at the failure.
Different rheological properties observed in the experimental work had an impact in the simulations of the flow studies. As it was realistically assumed that the tailings deposit materials attained their status naturally, undisturbed samples results were considered. For these materials, it was observed a higher resistance to the flow, meaning that the flow would start later, and would also stop flowing earlier.
Finally, this research has shown that released volume and output hydrograph should be considered as part of the dam break solution and not taken as premises or a model constraint, such as a design breach.
Acknowledgments
The authors acknowledge the support of Flow Science, Inc, which granted a temporary license for the FLOW-3D® software.
References
- BOGER, D. V. Rheological concepts. In: JEWELL, R. J.; FOURIE, A. B. (ed.). Paste and thickened tailings: a guide. 3rd ed. Perth, WA: ACG, 2015. cap 3, p. 21-43.
- KWAK, M; JAMES, D. F.; KLEIN, K. A. Flow behaviour of tailings paste for surface disposal. International Journal of Mineral Processing, v. 77, n. 3, p.139-153, nov. 2005.
- MEZGER, T. G. The rheology handbook 2. ed. Hannover, Germany: Vincentz Network, 2006. 299p.
- O'BRIEN, J. S.; JULIEN, P. Y. Physical properties and mechanics hyperconcentraded sediment flows. In: SPECIALTY CONFERENCE - DELINEATION OF LANDSLIDE, FLASH FLOOD AND DEBRIS FLOW HAZARD IN UTAH, Logan, 1984. Proceedings […]. Utah: Utah State University, 1985. p. 260-279.
- OLIVEIRA-FILHO, W. L.; ABRÃO, P. Disposição de rejeitos de mineração. In: ZUQUETTE, L. V. (org.). Geotecnia Ambiental Rio de Janeiro: Elsevier, 2015.
- OLIVEIRA-FILHO, W. L.; VAN ZYL, D. Modeling discharge of interstitial water from tailings following deposition - Part 1. Solos e Rochas, v. 29, n. 2, p. 199-209, 2006.
- PENNA, D. C. R. Análise acoplada entre consistência e resistência não drenada de um rejeito fino de minério de ferro 2007. 135 f. Dissertação (Mestrado em Geotecnia) - Escola de Minas, Universidade Federal de Ouro Preto, Ouro Preto, 2007.
- PULLUM, L.; BOGER, D. V.; SOFRA, F. Hydraulic mineral waste transport and storage. Annual Review of Fluid Mechanics, v. 50, n. 1, p. 157-185, 2018.
Publication Dates
-
Publication in this collection
29 Mar 2021 -
Date of issue
Apr-Jun 2021
History
-
Received
31 Aug 2020 -
Accepted
07 Dec 2020


