
Abstract
The creation of tridimensional models that represent the quality and geomechanical characteristics of the rock mass to be excavated can be made by using spatial interpolation techniques. The aim of this research is to improve the safety in underground activities, as well as to spread and popularize the use of spatial interpolation methods to represent both the spatial continuity of the quality of the rock mass and the geomechanical variables through geostatistical methods. This article presents and demonstrates the viability of using Q-System block models estimated from the borehole data for previous classification of the rock mass surrounding the underground excavation and rock support design. The block model for the support design of galleries is justified because it allows to previously forecast the kind and quantity of support necessary for the stability of the excavation, as well as the costs with these devices, besides increasing the safety in the operations. Techniques of indicator kriging and ordinary kriging were used to build the Q-System index block model. The model was validated through the techniques of visual inspection and cross validation. The data used in this study were collected from the geotechnical description of 39 borehole core samples with a total measurement of 4,015 meters in Fazenda Brasileiro Mine, located in the town of Teofilândia, Bahia State, Brazil.
Keywords:
geostatistical; block model; drill core; rock support design; rock mass quality
Introduction
The geomechanical characterization and classification are important stages of engineering projects that involve rock excavation either in open pit or underground projects. These procedures aim to ensure the safety of the activities through methods for defining the quality level of the rock mass, which in turn, will provide resources to define the methods of excavation, dimensions, and structures of support (Brady and Brown, 2004BRADY, B. H. G.; BROWN, E. T. Rock mechanics: for underground mining. 3rd. ed. Dordrecht: Kluwer Academic Publishers, 2004.; Hoek, 2006HOEK, E. Practical rock engineering. North Vancouver, British Columbia: Evert Hoek Consulting Engineer, 2006.; Zingano, 2002ZINGANO, A. C. Modelamento geomecânico para o dimensionamento de pilares de carvão. 2002. Tese (Doutorado em Engenharia) - Escola de Engenharia, Universidade Federal do Rio Grande do Sul, Porto Alegre, 2002.).
Rock Quality Designation - RQD (Deere, 1963DEERE, D. U. Technical description of rock cores for engineering purpose. Rock Mechanics and Engineering Geology, v. 1, n. 1, p. 16–22, 1963.), Rock Mass Rating - RMR (Bieniawski, 1973BIENIAWSKI, Z. T. Engineering classification of jointed rock masses. Civil Engineer in South Africa, v. 15, n. 12, p. 335-343, 1973.) and the Q-System (Barton et al., 1974BARTON, N.; LIEN, R.; LUNDE, J. Engineering classification of rock masses for the design of tunnel support. Rock Mechanics, v. 6, n. 4, p. 189–236, 1974.) are the most used geomechanical classification methods nowadays, and were developed especially to evaluate the stability of underground excavations and for rock support design systems, but only the Q-System is still widely used for rock support design (Hoek et al., 1995HOEK, E.; KAISER, P. K.; BAWDEN, W. F. Support of Underground Excavations in Hard Rock. Rotterdam: A. A. Balkema, 1995., Li, 2017LI, C. C. Principles of rockbolting design. Journal of Rock Mechanics and Geotechnical Engineering, v. 9, n. 3, p. 396–414, Jun. 2017.).
In turn, the design of support systems for underground excavations, in general, are based on empirical techniques which consider the dimensions and the time of use of an excavation, the level of stress and the geomechanical quality of the rock mass to be excavated. Support systems are used to improve the resistance characteristics and self-support of the rock mass. Commonly, the forecast of quantity and cost of the support system in mines in operation are made through the correlation of the average between the measurement of the excavation performed and the quantity of support used in the previous years (Brady and Brown, 2004BRADY, B. H. G.; BROWN, E. T. Rock mechanics: for underground mining. 3rd. ed. Dordrecht: Kluwer Academic Publishers, 2004.; Hoek et al., 1995HOEK, E.; KAISER, P. K.; BAWDEN, W. F. Support of Underground Excavations in Hard Rock. Rotterdam: A. A. Balkema, 1995.; Li, 2017LI, C. C. Principles of rockbolting design. Journal of Rock Mechanics and Geotechnical Engineering, v. 9, n. 3, p. 396–414, Jun. 2017.).
However, the tridimensional spatial representation of geomechanical variables and of the rock mass quality through a block model is a practice little used in the mineral sector. Usually, only the average values obtained in a set of holes is used to determine the quality of the rock mass in the surveyed area, or as pointed out by Cruz (2017)CRUZ, F. A. R. Espacialização de parâmetro de rocha intacta em modelos de blocos utilizando krigagem da indicatriz. 2017. Dissertação (Mestrado em Engenharia) – Escola de Engenharia, Universidade Federal do Rio Grande do Sul, 2017., the obtained data in the geomechanical descriptions are simulated and inferred through the interpretation of bi-dimensional sections (2D), counting only on the experience of the geomodeler, without any assistance from computational tools to help with this interpretation. But this reality is changing thanks to recent studies and research. The works available in literature are based mainly on the use of the ordinary kriging, indicator kriging and geostatistical simulations techniques to estimate the quality of the rock mass or the geomechanical parameters (e.g Redondo, 2003REDONDO, F. Classificação probabilística do padrão geomecânico de um maciço rochoso mineralizado com base no índice RQD. 2003. Dissertação (Mestrado em Geociências) - Instituto de Geociências e Ciências Exatas, Universidade Estadual Paulista, Rio Claro, 2003.; Leite, 2008LEITE, L. F. Aplicação de métodos estatísticos e geoestatísticos no estudo de famílias de descontinuidades. 2008. Dissertação (Mestrado em Engenharia Mineral) – Escola de Minas, Universidade Federal de Ouro Preto, Ouro Preto, 2008.; Jeon et al., 2008JEON, S.; HONG, C.; YOU, K. Design of tunnel supporting system using geostatistical methods. In: Ng, C. W.W.; Huang, H.W.; Liu, G.B. (ed.). Geotechnical aspects of underground construction in soft ground. London: CRC Press, 2008. p. 797–800.; Egaña and Ortiz, 2013EGAÑA, M.; ORTIZ, J. M. Assessment of RMR and its uncertainty by using geostatistical simulation in a mining project. Journal of GeoEngineering, v. 8, n. 3, p. 83–90, 2013.; Cruz 2017CRUZ, F. A. R. Espacialização de parâmetro de rocha intacta em modelos de blocos utilizando krigagem da indicatriz. 2017. Dissertação (Mestrado em Engenharia) – Escola de Engenharia, Universidade Federal do Rio Grande do Sul, 2017.; Vatanable, 2018VATANABLE, H. Y. A geoestatística como ferramenta para estimar o Rock Mass Rating em modelos tridimensionais. 2018. Dissertação (Mestrado em Engenharia) - Escola de Engenharia, Universidade Federal do Rio Grande do Sul, Porto Alegre, 2018.; Vilca, 2019VILCA, Y. C. Modelagem geoestatística de variáveis geomecânicas: Estudo de caso - Mina Córrego do Sítio, Santa Bárbara/MG. 2019. 138 f. Dissertação (Mestrado em Engenharia Geotécnica) – Escola de Minas, Universidade Federal de Ouro Preto, Ouro Preto, 2019.).
This article focuses on presenting and demonstrating the viability of using the Q-System block model, estimated through indicator kriging and ordinary kriging from borehole data for the pre-classification of the rock mass surrounding the underground excavation, the design and zoning of the support systems in underground excavations. Moreover, it enables the calculation of the forecast of quantity and costs with these systems. The choice of these methodologies was based on the literature available that indicates the good results of the estimates. It is worth mentioning that indicator kriging to estimate geomechanical data is a method that stands out among the methodologies referenced in literature, in addition to being the most suitable for estimates of non-additive variables (Cruz, 2017CRUZ, F. A. R. Espacialização de parâmetro de rocha intacta em modelos de blocos utilizando krigagem da indicatriz. 2017. Dissertação (Mestrado em Engenharia) – Escola de Engenharia, Universidade Federal do Rio Grande do Sul, 2017., Goovaerts, 1997GOOVAERTS, P. Geostatistics for natural resources evaluation. [S. l.]: Oxford University Press, 1997., Journel, 1982JOURNEL, A. G. The indicator approach to estimation of spatial distributions. In: APCOM - INTERNATIONAL SYMPOSIUM, 17., 1982, New York. Proceedings […]. [S. l.: s. l.], 1982. p.793–806., You and Barnes, 1997YOU, K.; BARNES, R. J. Infill sampling design for tunnel rock classification. International Journal of Rock Mechanics and Mining Sciences, v. 34, n. 2, p. 207–215, Feb. 1997.).
Therefore, it provides a direct and specific application of geomechanical block models, instead of only zoning the quality and / or geomechanical characteristics of the rock mass, maximizing the use of the borehole data.
The data for the assembly of this article were taken from the geotechnical description of the 39 boreholes with a total measure of 4,015 meters, distributed along a stretch of 300 meters of the main ramp in the Fazenda Brasileiro Mine, located in the municipality of Teofilândia, Bahia State, Brazil, approximately 200 km northwest of Salvador, Bahia.
2.Bibliographic review
2.1Geomechanical classification
Geomechanical classification is the basis for many empirical formulations in excavation dimensioning, especially for tunnels, underground galleries and their respective support and reinforcement systems. It basically defines a grade or quality of the rock mass by calculating the value attributed to the geological and geotechnical parameters (Bieniawski, 1989BIENIAWSKI, Z. T. Engineering rock mass classifications: a complete manual for engineers and geologists in mining, civil, and petroleum engineering. [S. l.]: John Wiley & Sons, 1989.; Brady and Brown, 2004BRADY, B. H. G.; BROWN, E. T. Rock mechanics: for underground mining. 3rd. ed. Dordrecht: Kluwer Academic Publishers, 2004.; Hoek and Brown, 1997HOEK, E.; BROWN, E. T. Practical estimates of rock mass strength. International Journal of Rock Mechanics and Mining Sciences, v. 34, n. 8, p. 1165–1186, 1997.).
The Q-System was developed by Barton, Lien and Lunde in 1974 at the Norwegian Geology Institute, NGI, and is based on a quality indicator “Q”, obtained through six parameters that describe a series of particularities of the rock mass: Degree of jointing (RQD); Number of joint sets (Jn); Joint roughness number (Jr), Joint alteration number (Ja); Joint water reduction factor (Jw) and the condition of stress on the rock mass (SRF). Barton et al., (1974)BARTON, N.; LIEN, R.; LUNDE, J. Engineering classification of rock masses for the design of tunnel support. Rock Mechanics, v. 6, n. 4, p. 189–236, 1974. divide the rock masses into nine quality categories, ranging from Exceptionally Good to Exceptionally Weak.
It is important to highlight that the Q-System is the most widely used methodology in mining because it is very comprehensive for excavation dimensions and has configurations for different kinds of supports and reinforcements. Any rock support dimensioning methodology for underground excavations that uses geomechanical characteristics or quality of the rock mass together with the dimensions of the excavations, can be applied to elaborate the rock support block model design (Brady and Brown, 2004BRADY, B. H. G.; BROWN, E. T. Rock mechanics: for underground mining. 3rd. ed. Dordrecht: Kluwer Academic Publishers, 2004.; Li, 2017LI, C. C. Principles of rockbolting design. Journal of Rock Mechanics and Geotechnical Engineering, v. 9, n. 3, p. 396–414, Jun. 2017.).
2.2Kriging
Kriging is a geostatistical method of spatial inference (estimate) of a variable in a specific non-sampled support (point, area, volume), distributed in space and/or time, that presents unbiased estimates and minimal variance associated to the estimated value (Yamamoto and Landim, 2015YAMAMOTO, J. K.; LANDIM, P. M. B. Geoestatística: conceitos e aplicações. São Paulo: Oficina de textos, 2015.).
Ordinary Kriging is often associated to B.L.U.E. (Best Linear Unbiased Estimator). Being linear is based on the estimates to be pondered by linear combination from available data. This way, ordinary kriging is much recommended because it does not presuppose knowledge of the average nor the fixedness of the average in the sample field and allows to estimate the local average within the search neighborhood (Isaaks and Srivastava, 1989ISAAKS, E. H.; SRIVASTAVA, M. R. An introduction to applied geostatistics. New York: Oxford University Press, 1989.).
For Indicator Kriging, Journel (1982)JOURNEL, A. G. The indicator approach to estimation of spatial distributions. In: APCOM - INTERNATIONAL SYMPOSIUM, 17., 1982, New York. Proceedings […]. [S. l.: s. l.], 1982. p.793–806. proposed that each of the parameters should be encoded in only two values, for instance, between 0 and 1, where 1 represents the probability of belonging to a given class and 0 represents the probability of not belonging. The result of this process is that by the end of kriging, each block will have the probability distributed between 0 and 1, which will be equivalent to the distribution from 0% to 100% of chances of belonging to any of the class intervals. The final classification of the block will depend on the kind of the parameter used, which can be based on the initial grouping of the database or on the greatest probability of the estimated point (Goovaerts, 1997GOOVAERTS, P. Geostatistics for natural resources evaluation. [S. l.]: Oxford University Press, 1997.).
2.3Geomechanical variables
The final classification at any location of the rock mass using the Q-System methodology is given by a calculation of rating assigned to several parameters. Therefore, the nature of geomechanical variables in the estimates must not be neglected. According to Eganã and Ortiz (2013) some variables are peculiar in the sense that they are non-additive or have a behavior that depends on the direction in which they are measured. The non-additive variables are those whose linear average lacks physical sense (Howson, 2004HOWSON, M. Estimation of geotechnical variables for mass mining. In: MassMin 2004, Sntiago, Chile. Proceedings […]. Santiago: Instituto de Ingenieros de Chile, 2004. p. 44–48.).
Normally, this situation becomes apparent with variables that are a non-linear function of other parameters. This is the case of the RMR which is the sum of several ratings non-linearly assigned from other components (Egaña and Ortiz, 2013EGAÑA, M.; ORTIZ, J. M. Assessment of RMR and its uncertainty by using geostatistical simulation in a mining project. Journal of GeoEngineering, v. 8, n. 3, p. 83–90, 2013.). By definition, the visual or described geomechanical parameters are categorical qualitative variables, non-continuous and non-additive and that belong to a classification range (Cruz, 2017CRUZ, F. A. R. Espacialização de parâmetro de rocha intacta em modelos de blocos utilizando krigagem da indicatriz. 2017. Dissertação (Mestrado em Engenharia) – Escola de Engenharia, Universidade Federal do Rio Grande do Sul, 2017.).
Deere and Deere (1989)DEERE, D. U.; DEERE, D. W. Rock quality designation after twenty years. Vicksburg, Miss: U.S. Army Engineer Waterways Experiment Station, 1989. (Final Report). make some considerations and recommendations about the bias in RQD that may result from differing borehole orientations with respect to joint orientation. For a rock mass where 3 or 4 joint sets exist, the problem is not severe, although, even then, there can be some bias when the boreholes are parallel to one of the sets.
Under the framework of the random functions, the data used for estimation and simulation should belong to a consistent statistical and geotechnical population. This allows pulling together data for statistical inference. Some geotechnical variables, especially those associated to discontinuities are the result of several intermingled phenomena. There is a mixing of populations that cannot be discerned. This translates into poor spatial correlation, but is unavoidable (Egaña and Ortiz, 2013EGAÑA, M.; ORTIZ, J. M. Assessment of RMR and its uncertainty by using geostatistical simulation in a mining project. Journal of GeoEngineering, v. 8, n. 3, p. 83–90, 2013.).
2.4Studies of geostatistical methods applied to geomechanics
Redondo (2003)REDONDO, F. Classificação probabilística do padrão geomecânico de um maciço rochoso mineralizado com base no índice RQD. 2003. Dissertação (Mestrado em Geociências) - Instituto de Geociências e Ciências Exatas, Universidade Estadual Paulista, Rio Claro, 2003. – Indicator kriging for modelling the distribution of the RQD parameter obtained from borehole data.
Leite (2008LEITE, L. F. Aplicação de métodos estatísticos e geoestatísticos no estudo de famílias de descontinuidades. 2008. Dissertação (Mestrado em Engenharia Mineral) – Escola de Minas, Universidade Federal de Ouro Preto, Ouro Preto, 2008.)– Indicator kriging as an estimate method of probability distributions for discontinuity attitudes.
Jeon et al., (2008)JEON, S.; HONG, C.; YOU, K. Design of tunnel supporting system using geostatistical methods. In: Ng, C. W.W.; Huang, H.W.; Liu, G.B. (ed.). Geotechnical aspects of underground construction in soft ground. London: CRC Press, 2008. p. 797–800. – Indicator kriging used to estimate the tridimensional distribution of RMR with the field data of borehole logging and geophysical data. The result was compared with the results using ordinary kriging and sequential simulation of the indicators.
Egaña and Ortiz (2013)EGAÑA, M.; ORTIZ, J. M. Assessment of RMR and its uncertainty by using geostatistical simulation in a mining project. Journal of GeoEngineering, v. 8, n. 3, p. 83–90, 2013. – Proposed a new estimative technique through geostatistical simulation of the variables used in the isolated RMR calculations and compared with the values obtained in the direct estimate of the RMR. The results of this comparison showed a significant improvement of the quality in estimating the local RMR.
Cruz (2017)CRUZ, F. A. R. Espacialização de parâmetro de rocha intacta em modelos de blocos utilizando krigagem da indicatriz. 2017. Dissertação (Mestrado em Engenharia) – Escola de Engenharia, Universidade Federal do Rio Grande do Sul, 2017. – Indicator kriging for parameter spatialization of the intact rock in blocks models.
Vatanable (2018)VATANABLE, H. Y. A geoestatística como ferramenta para estimar o Rock Mass Rating em modelos tridimensionais. 2018. Dissertação (Mestrado em Engenharia) - Escola de Engenharia, Universidade Federal do Rio Grande do Sul, Porto Alegre, 2018. – Indicator kriging to estimate the Rock Mass Rating (RMR) in tridimensional blocks models.
Vilca (2019)VILCA, Y. C. Modelagem geoestatística de variáveis geomecânicas: Estudo de caso - Mina Córrego do Sítio, Santa Bárbara/MG. 2019. 138 f. Dissertação (Mestrado em Engenharia Geotécnica) – Escola de Minas, Universidade Federal de Ouro Preto, Ouro Preto, 2019. – Comparison of estimates by Indicator Kriging, Ordinary Kriging and Indicator Geostatistical Simulation for the RMR.
Location and geology – Case study
The Fazenda Brasileiro Mine is located in the city of Barrocas / BA, approximately 200 km northwest of the capital of the state of Bahia, Salvador. Access to the mine by land from Salvador is thought the BR 324 and BR 116 highways, respectively.
The gold deposits of the Fazenda Brasileiro mine are inserted in the belt of green rocks of the Itapicuru river (Itapicuru greenstonebelt) in the northeast part of the São Francisco Craton, of lower Proterozoic age, where elongated alignments in the NS direction arise in an area of 100 km x 40 km. The stratigraphic sequence of the greenstonebelt rocks has a mafic basal unit, followed by an intermediate volcanic felsic unit and another metasedimentary unit at the top. Granite intrusions occur throughout the sequence. The host rocks of Fazenda Brasileiro ore are the mafic rocks of the basal unit (Silva et al., 2001SILVA, M. G.; COELHO, C. E. S.; TEIXEIRA, J. B. G. The Rio Itapicuru greenstone belt, Bahia, Brazil: geologic evolution and review of gold mineralization. Mineralium Deposita, v. 36, n. 3–4, p. 345–357, 2001.)
4Methodology
Indicator kriging was the estimation method adopted in this study because it is necessary to use a non-linear estimate method. Besides it is one of the most suitable methods for geomechanical variables according to the consulted bibliography. It is worth remembering that the Q-System index is the result of non-linear calculations of the geomechanical parameter weights and, therefore, should not be directly estimated using linear geostatistical tools. (Egaña and Ortiz, 2013EGAÑA, M.; ORTIZ, J. M. Assessment of RMR and its uncertainty by using geostatistical simulation in a mining project. Journal of GeoEngineering, v. 8, n. 3, p. 83–90, 2013.; Goovaerts, 1997GOOVAERTS, P. Geostatistics for natural resources evaluation. [S. l.]: Oxford University Press, 1997.; Journel, 1982JOURNEL, A. G. The indicator approach to estimation of spatial distributions. In: APCOM - INTERNATIONAL SYMPOSIUM, 17., 1982, New York. Proceedings […]. [S. l.: s. l.], 1982. p.793–806.; You and Barnes, 1997YOU, K.; BARNES, R. J. Infill sampling design for tunnel rock classification. International Journal of Rock Mechanics and Mining Sciences, v. 34, n. 2, p. 207–215, Feb. 1997.).
The article starts with the geomechanical description of the borehole data, where a description form was used to register the necessary information for classification according to the Q-System methodology. In this case study, 39 boreholes were used, with a total length of 4,015 meters, distributed along 300 meters of the main access ramp in the Fazenda Brasileiro Mine (Figure 1).

The holes were carried out in a metasedimentary sequence, called Canto Sequence, East-West oriented, dipping 40°/50° to South and strike 10° to East. A similar geomechanical behavior can be considered for all of the tested area, thus representing only one geomechanical domain.
The software Isatis® was used to construct the block models. Before starting the estimative procedures, the data of geomechanical description were regulated in equal length intervals, through the method of weighted average called compositing.
The dimensions of the block used in the estimates are usually defined in function of the spacing of the sampling, ranging from 1/4 to 1/2. However, the resolution of the model (blocks size) depends on the kind of study, the necessary level of detail, and stage of the project, among other factors. But due to the peculiar and irregular distribution of the samples, these definitions were not adopted in the present study.
The samples were collected by underground fan drilling from the side wall of the main access ramp of the underground mine at a depth of 270 meters from the topographic surface. Drill fans have an average horizontal distance of 50 m, but with a different number of drill holes per fan, ranging from 2 to 6 holes. Near the access ramp, the vertical spacing between the drill holes is approximately one meter, but in the region of the end of the holes, the vertical spacing between them can reach 70 meters. Thus, some samples in the horizontal plane have a minimum spacing of 50 meters, but in the vertical plane spacing can vary from 1 to 70 meters.
Due to the irregularity of the sample spacing in the study area, it was not possible to adopt the usual strategies to define the size of the blocks, making it necessary to adopt a different strategy in this case.
This way, for the present study, aimed at a high level of detail with good differentiation and representativity of the intervals of the Q-System indexes, the model resolution adopted after several attempts was 2x 2 x 2 m This resolution is justified because of the presence of fault zones ranging from 0.5 m to 1.5 m. These reduced dimensions were the most efficient to represent the geotechnical risk regions in three-dimensional block models, better preserving the initial information present in the boreholes. For the estimates, the blocks were discretized into 5, 5, 5 points. The estimates were then made on the point support and the average was taken so that the estimate represents a block support.
Kriging methods use the concept of semi-variogram in the estimate calculation. The semi-variogram is used to define the spatial continuity and to represent the variability of the phenomenon in question, thus obtaining the final variogram model. Specific variogram models, for each category of the parameters Jn, Jr, Ja, and a unique variograma model for RQD, were created in three orthogonal directions. This was done to gain an impression of the spatial continuity of the data across the project area. Once the variogram models that represent the spatial continuity and the variability of the categories of geomechanical parameters are defined, it is necessary to determine the search neighborhood, which encompasses the search radius and the number of minimal and maximal samples to calculate the estimate.
Using the results of the variography, the structural characteristics of the mineral deposit and the spatial disposition of samples, and after several attempts of combinations, a search neighborhood was adopted with anisotropic radius rotated to azimuth 90º, dipping of 45°, reach of 30 m in the X axis, 50 m in the Y axis and 4 m in the Z axis, with a minimum of two samples and a maximum of four samples.
Indicator kriging is used to estimate functions of probabilities distributions and to estimate categoric variables, so, to estimate the Q-System index it is necessary to estimate the parameters relative to Jn, Jr, and Ja separately, where each parameter used in the calculation will be subdivided into categories and a value will be attributed to these categories. That is, the geomechanical parameters, Jn, Jr, Ja, will be configured in categoric data through the indicators.
On the other hand, the RQD parameter in the calculation of the Q-System index must be estimated through ordinary kriging, due to the need to use the numeric value of RQD. That is, the RQD block model used in the calculation of the Q-System index should be elaborated by linear estimate methods, the non-additivity of this variable should be disregarded for the estimate. To transform this variable in one categoric variable of 100 categories is not viable in practical terms, besides being able to generate a low or null spatial correlation, making the use of geostatistical methods unviable.
The final classification of the Q-System index will come from the calculations using the block models of parameters Jn, Jr, Ja, and RQD. For the parameter water condition, a constant standard value of 1 is used, relative to a dry excavation or minor inflow, added directly in the proceedings of calculations, without the need of building a specific block model, given the difficulties or even the impossibility of verifying the water conditions in the rock mass during the drill core process. The SRF parameter is also added directly in the proceedings of calculations adopting for this case the value of 2.5, relative to a low stress condition in situ, near the surface or open joints.
5.Results
5.1Spatial continuity analysis
In Figure 2a, for demonstration matter, the histogram of categories distribution of Jn in the holes is presented. The variogram model of the Category Jn 3 represented by Figure 2b presents a spherical structure.

(a) Histogram of classes distribution of Jn in the holes. (b) Semi-variogram of spatial continuity of Class 3 of Jn.
Kriging
Ordinary kriging was used to estimate the RQD parameter described along the boreholes due to the necessity to use the numeric value of this parameter to calculate the Q-System index. In turn, indicator kriging was used to estimate the parameters referring to Jn, Jr, and Ja.
The tridimensional geomechanical model of the Q-System index was generated according to the calculation using the block models of RQD, Jn, Jr, and Ja. Figure 3 presents the final block model of the estimate of the Q-Systems index.

By analyzing the model generated, it can be observed that Rock Mass Quality (Q-System Index) is distributed in layers following the same orientation of the geological body, which, in this region, is formed by a metasedimentary stratigraphic sequence, called Canto Sequence.
5.3Validation of the model
Right after being estimated, the model needs to be validated, in order to verify if the model is satisfactory. There are some techniques to perform this validation. The techniques which were used to perform the validation of this estimate are the Visual Inspection and Cross Validation (Isaaks and Srivastava, 1989ISAAKS, E. H.; SRIVASTAVA, M. R. An introduction to applied geostatistics. New York: Oxford University Press, 1989.).
Visual inspection is a simple tool to compare the sampled values with the estimated values. This is a good tool for evaluation, if the estimate method is appropriate.
Observing Figure 4, it is possible to notice that the values of the samples, as well as the estimated values of the blocks, have a good value correlation and follow the same spatial stratified standard. This stratified distribution is in accordance with the geological characteristics of the study area, which is formed by a metasedimentary sequence.

The cross validation consists in the technique where each original data point is removed and its value is estimated from the data of the estimate, that is, the sampled points now will be estimated and compared to the original values of the sample. With the scatterplot, the values estimated by kriging are confronted with the real values over a regression line; the higher the correlation between the data, the better the level of the estimate.
The cross validation does not prove that the chosen variogram model is correct but proves that it is not grossly incorrect. The aim is a gaussian distribution with average near zero, that is, low bias, and low variance. The results of the cross validation for the Q-system estimates are presented in Figure 5.

Results of the cross validation. a) Scatterplot of estimated versus real values – Q-System; b) histogram of cross validation error – Q-System.
By analyzing the results above, the correlation coefficient for the Q-System estimate was 98.8% with very low error averages. The validation methods used in this study showed that the estimates were good, and the block models are satisfactory.
5.4Previous geomechanical classification of the rock mass surrounding the underground excavations
The previously constructed Q-System block model was used for a preliminary definition of the quality of the rock mass surrounding future excavations. To do this, a split tool existing in programs of mine planning was used to cut the block models only in the region encompassed within the limits of the excavation project.
Figure 6 illustrates the result of the split Q-System block model, representing the zoning of the quality of the rock mass surrounding the galleries. This previous classification allows to identify regions with possible geotechnical risks, and thus to adopt proper measures in the development and support system of the galleries.

Through this previous classification of the rock mass surrounding future excavations, it is possible to perform the design and zoning of the support systems for underground excavations.
5.5Zoning of the support systems design for underground excavations
At Fazenda Brasileiro Mine, the support system is based only on the Q-System index value obtained by the geomechanical mapping in the underground excavations, according to the interval of definition of the support categories presented in Table 1. Therefore, by using the block model of the Q-System index and the interval of support categories, the definition / zoning of the support categories along the excavations was performed, after a procedure to regulate the limits of the support categories, illustrated in Figure 7.
6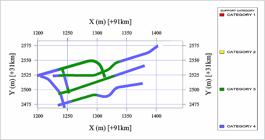
Results discussions
The goal of the spatial representation of the quality of the rock mass is to provide a three-dimensional model where it is possible to identify the different characteristics and quality along the rock mass model, especially in regions with high geotechnical risks.
For this reason, to ensure a good preservation, representativeness of the initial data present in the drill holes and to overcome some deficiencies of the database, it was necessary to adopt some search strategies and definition of the estimation parameters that are different from or not usually those used in ore grade estimates to enable the creation of block models.
The database used is characterized by non-additive variables and a reduced number of samples, distributed in an irregular fan-shaped spacing with a large variation of distances between samples, which leads to a grouping of the samples in the proximities of the gallery and a big distancing in the extremities of the drilling area. Moreover, there is a lack of uniformity in the spacing, number of holes, distances and inclination between distinct holes, low spatial continuity, and a large variation of the Q-System values along the holes.
Because of such characteristics, to obtain a better result from the estimates using indicator kriging and ordinary kriging techniques, a far-reaching search neighborhood was used in order to involve all the blocks between the boreholes, together with a restrictive quantity of samples, maximum of 4 and minimum of 2. This is necessary to reduce the overestimation of results generated by the calculation of the weighted average of the weights of each sample in the estimated block in the regions with low geomechanical quality and / or low number of samples, and thus, reproduce the initial data in the best way. It is worth mentioning that the overestimation of one or two points of the Q System can cause changes in the class of the rock mass, resulting in possible risks to underground operations.
The cross validation and visual analysis of the block model of the constructed Q-System index attested a good correlation between the estimated values and original data described in the boreholes and that the model is satisfactory considering the values of the Q-System index described along the boreholes.
Although the configurations of the database were not ideal, the method of estimation by indicator kriging and ordinary kriging adopted in this study presented good results and met the objectives proposed for previous geomechanical classification of the rock mass surrounding the underground excavations, using block models and zoning of the support system categories, according to the methodology used in Fazenda Brasileiro Mine. This way, it was possible to maximize the use of the information contained in the borehole data in the mineral sector.
7.Conclusions
The construction and use of geomechanical block models should be a practice more present in the mining industry. To summarize, it is recommended that the estimation method to be used should always be the one with the best reproduction of the original characteristics of the data base. The advantages of its use in planning excavations and increasing the safety in the operations are undeniable, as it provides a prediction of the quality of the rock mass before the excavation happens, and as demonstrated in the present study, also subsidizes the support design of underground excavation in the initial phase, as well as that already in operation.
The use of block models for design and zoning the support systems of underground excavation is a direct application of rock mass quality block models and was proven an effective technique. As demonstrated, this technique can be applied to any dimensioning technique that uses identifiable geomechanical characteristics in the borehole data or other variable that could be included in the calculation, for example in situ stress, lithology and depth.
The block model of support design of galleries is justified because it allows to previously forecast the kind and quantity of support necessary for the stability of the excavation, as well as the costs with these devices. And enables a more precise estimate, given the better detailing and spatial representativity of the geomechanical characteristics of the rock mass. Besides promoting the maximization of the use of the information contained in the borehole core samples in the mineral sector, the article demonstrates the efficacy and the groundbreaking spirit of using block models to support design for underground excavations.
Acknowledgments
The authors wish to thank UFOP, UFRGS, Leagold Mining Corporation and the entire team of the Fazenda Brasileiro Mine for supporting this work.
References
- BARTON, N.; LIEN, R.; LUNDE, J. Engineering classification of rock masses for the design of tunnel support. Rock Mechanics, v. 6, n. 4, p. 189–236, 1974.
- BIENIAWSKI, Z. T. Engineering classification of jointed rock masses. Civil Engineer in South Africa, v. 15, n. 12, p. 335-343, 1973.
- BIENIAWSKI, Z. T. Engineering rock mass classifications: a complete manual for engineers and geologists in mining, civil, and petroleum engineering. [S. l.]: John Wiley & Sons, 1989.
- BRADY, B. H. G.; BROWN, E. T. Rock mechanics: for underground mining. 3rd. ed. Dordrecht: Kluwer Academic Publishers, 2004.
- CRUZ, F. A. R. Espacialização de parâmetro de rocha intacta em modelos de blocos utilizando krigagem da indicatriz. 2017. Dissertação (Mestrado em Engenharia) – Escola de Engenharia, Universidade Federal do Rio Grande do Sul, 2017.
- DEERE, D. U.; DEERE, D. W. Rock quality designation after twenty years Vicksburg, Miss: U.S. Army Engineer Waterways Experiment Station, 1989. (Final Report).
- DEERE, D. U. Technical description of rock cores for engineering purpose. Rock Mechanics and Engineering Geology, v. 1, n. 1, p. 16–22, 1963.
- EGAÑA, M.; ORTIZ, J. M. Assessment of RMR and its uncertainty by using geostatistical simulation in a mining project. Journal of GeoEngineering, v. 8, n. 3, p. 83–90, 2013.
- GOOVAERTS, P. Geostatistics for natural resources evaluation [S. l.]: Oxford University Press, 1997.
- HOEK, E.; KAISER, P. K.; BAWDEN, W. F. Support of Underground Excavations in Hard Rock Rotterdam: A. A. Balkema, 1995.
- HOEK, E.; BROWN, E. T. Practical estimates of rock mass strength. International Journal of Rock Mechanics and Mining Sciences, v. 34, n. 8, p. 1165–1186, 1997.
- HOEK, E. Practical rock engineering North Vancouver, British Columbia: Evert Hoek Consulting Engineer, 2006.
- HOWSON, M. Estimation of geotechnical variables for mass mining. In: MassMin 2004, Sntiago, Chile. Proceedings […]. Santiago: Instituto de Ingenieros de Chile, 2004. p. 44–48.
- ISAAKS, E. H.; SRIVASTAVA, M. R. An introduction to applied geostatistics New York: Oxford University Press, 1989.
- JEON, S.; HONG, C.; YOU, K. Design of tunnel supporting system using geostatistical methods. In: Ng, C. W.W.; Huang, H.W.; Liu, G.B. (ed.). Geotechnical aspects of underground construction in soft ground London: CRC Press, 2008. p. 797–800.
- JOURNEL, A. G. The indicator approach to estimation of spatial distributions. In: APCOM - INTERNATIONAL SYMPOSIUM, 17., 1982, New York. Proceedings […]. [S. l.: s. l.], 1982. p.793–806.
- LEITE, L. F. Aplicação de métodos estatísticos e geoestatísticos no estudo de famílias de descontinuidades. 2008. Dissertação (Mestrado em Engenharia Mineral) – Escola de Minas, Universidade Federal de Ouro Preto, Ouro Preto, 2008.
- LI, C. C. Principles of rockbolting design. Journal of Rock Mechanics and Geotechnical Engineering, v. 9, n. 3, p. 396–414, Jun. 2017.
- REDONDO, F. Classificação probabilística do padrão geomecânico de um maciço rochoso mineralizado com base no índice RQD 2003. Dissertação (Mestrado em Geociências) - Instituto de Geociências e Ciências Exatas, Universidade Estadual Paulista, Rio Claro, 2003.
- SILVA, M. G.; COELHO, C. E. S.; TEIXEIRA, J. B. G. The Rio Itapicuru greenstone belt, Bahia, Brazil: geologic evolution and review of gold mineralization. Mineralium Deposita, v. 36, n. 3–4, p. 345–357, 2001.
- VATANABLE, H. Y. A geoestatística como ferramenta para estimar o Rock Mass Rating em modelos tridimensionais. 2018. Dissertação (Mestrado em Engenharia) - Escola de Engenharia, Universidade Federal do Rio Grande do Sul, Porto Alegre, 2018.
- VILCA, Y. C. Modelagem geoestatística de variáveis geomecânicas: Estudo de caso - Mina Córrego do Sítio, Santa Bárbara/MG. 2019. 138 f. Dissertação (Mestrado em Engenharia Geotécnica) – Escola de Minas, Universidade Federal de Ouro Preto, Ouro Preto, 2019.
- YAMAMOTO, J. K.; LANDIM, P. M. B. Geoestatística: conceitos e aplicações. São Paulo: Oficina de textos, 2015.
- YOU, K.; BARNES, R. J. Infill sampling design for tunnel rock classification. International Journal of Rock Mechanics and Mining Sciences, v. 34, n. 2, p. 207–215, Feb. 1997.
- ZINGANO, A. C. Modelamento geomecânico para o dimensionamento de pilares de carvão 2002. Tese (Doutorado em Engenharia) - Escola de Engenharia, Universidade Federal do Rio Grande do Sul, Porto Alegre, 2002.
Publication Dates
-
Publication in this collection
20 Sept 2021 -
Date of issue
Oct-Dec 2021
History
-
Received
29 Oct 2020 -
Accepted
01 June 2021


