
ABSTRACT
The upper Teles Pires River basin is located in the Brazilian agriculture frontier in the north of Mato Grosso state and has experienced significant changes in land use and cover, which can cause major changes in its hydrological dynamics. Climatic and hydrologic data are scarce in the region, which poses uncertainties in the decision-making process aiming at the sustainable management of water resources in this strategic area. The aim of this study was to evaluate the performance of the Large-Scale Distributed Hydrological Model (MGB-IPH) to assess water availability of the upper Teles Pires basin and support water resource management in the Amazon-Cerrado ecotone. The MGB-IPH model was calibrated and validated using data from three streamflow stations available in the basin. In order to verify the model performance, the Nash-Sutcliffe (NS) and the PBIAS statistical parameters were applied. Our results show that, by using the MGB-IPH model with generally available data, the maximum and minimum flow regimes can be successfully assessed in the upper Teles Pires basin. The continuity curves of daily flow simulated by the model showed a good fit with the observed flow. Overall, the results demonstrated the applicability of the MGB-IPH model for water resource assessment and management in the basin.
Keywords:
water resource management; hydrologic simulation; sustainability; Brazilian agriculture frontier
RESUMO
A bacia do alto Rio Teles Pires está localizada na região de fronteira agrícola no norte de Mato Grosso, onde significativas mudanças no uso e cobertura do solo vem ocorrendo, o que, por sua vez, pode resultar em alterações importantes na dinâmica hidrológica da bacia. Dados climáticos e hidrológicos são escassos na bacia, o que gera dificuldades para a gestão sustentável dos recursos hídricos nesta região estratégica. No presente trabalho, avaliamos o desempenho do Modelo de Grandes Bacias (MGB-IPH) para a estimativa da disponibilidade hídrica da bacia do alto Teles Pires, visando o suporte à tomada de decisões para a gestão hídrica no ecótono Amazônia-Cerrado. O modelo MGB-IPH foi calibrado e validado utilizando séries históricas de três estações hidrométricas presentes na bacia. Para avaliação da qualidade do modelo, foram empregados os índices estatísticos de desempenho de Nash-Sutcliffe (NS) e a porcentagem BIAS (PBIAS). Com base nos resultados é possível afirmar que a utilização do modelo MGB-IPH possibilita a estimativa das vazões mínimas e máximas da bacia do alto Teles Pires de forma satisfatória. As curvas de continuidade das vazões diárias simuladas pelo modelo apresentaram um bom ajuste com os dados observados. Os resultados demonstram a aplicabilidade do modelo MGB-IPH como ferramenta de apoio à avaliação e gestão dos recursos hídricos na bacia.
Palavras-chave:
gestão de recursos hídricos; simulação hidrológica; sustentabilidade; fronteira agrícola
INTRODUCTION
The upper Teles Pires River basin is located in the Brazilian northwestern agriculture frontier, in the north of Mato Grosso state, and comprises a large part of the Cerrado ecosystem and transition areas between the Amazon and Cerrado biomes. The region covered by the basin has great economic and environmental importance. More than 17% of the total gross domestic product (GDP) of Mato Grosso is generated in the municipalities that are totally or partially within the basin, including some of the largest producers of soybean and corn in Brazil (EPE 2009EPE. 2009. Empresa de Pesquisa Energética. Avaliação Ambiental Integrada (AAI). ( (http://www.epe.gov.br/pt/publicacoes-dados-abertos/publicacoes/avaliacao-ambiental-integrada-aai
). Accessed on 19/09/2017.
http://www.epe.gov.br/pt/publicacoes-dad...
; SEPLAN 2017Seplan. 2017. Secretaria de Estado de Planejamento. PIB Mato Grosso e Municípios. ( (http://www.seplan.mt.gov.br/-/3934855-pib-mato-grosso-e-municipios
). Accessed on 06/06/2017.
http://www.seplan.mt.gov.br/-/3934855-pi...
). The basin has experienced significant changes in land use and cover in the last decades due to conversion of its natural cover to areas intended for pasture and, later, agriculture, which increased 25.5% between 1986 and 2014 (Zaiatz et al. 2018Zaiatz, A.P.S.R.; Zolin, C.A.; Paulino, J.; Vendrusculo, L.G.; Lopes, T.R. 2018. Agricultural land use and cover change in the Cerrado/Amazon ecotone: a case study in the upper Teles Pires River basin. Acta Amazonica, 48: 168 -177.), which likely led to hydrologic impacts.
Several studies have assessed hydrological extremes over the Amazon basin, such as the floods of 2009 and 2012, and the droughts in 1996, 2005, and 2010 (Espinoza et al. 2011Espinoza, J.C.; Marengo, J.A.; Ronchail, J.; Carpio, J.M.; Flores, L.N.; Guyot, J.L. 2014. The extreme 2014 flood in south-western Amazon basin: the role of tropical-subtropical South Atlantic SST gradient. Environmental Research Letters, 9: 1-9.; Huete et al. 2006Huete, A.R.; Didan, K.; Shimabukuro, Y.E.; Ratana, P.; Saleska, S.R.; Hutyra, L.R.; Yang, W.; Nemani, R.R.; Myneni, R. 2006. Amazon rainforests green-up with sunlight in dry season. Geophysical Research Letters, 33: 1-4.; Marengo et al. 2011Marengo, J.A.; Tomasella, J.; Alves, L.M.; Soares, W.R.; Rodriguez, D.A. 2011. The drought of 2010 in the context of historical droughts in the Amazon region. Geophysical Research Letters, 38: 1-5., 2008Marengo, J.A.; Nobre, C.A.; Tomasella, J. 2008. The drought of Amazonia in 2005. American Meteorological Society, 21: 495-516.; Nie et al. 2015Nie, N.; Zhang, W.; Guo, H.; Ishwaran, N. 2015. 2010-2012 drought and flood events in the Amazon Basin inferred by GRACE satellite observations. Journal of Applied Remote Sensing, 9: 1-14. ). However, studies focusing on water availability in agriculture transition zones of the Amazon biome are scarce or nonexistent. The upper Teles Pires basin is no exception, since, in spite of its great economic and environmental importance for the state of Mato Grosso, and its significance for Brazilian agriculture, little attention has been given to water availability assessment in the basin, in order to support water resource planning and management in the region. Despite its large size (37,444 km2), the upper Teles Pires basin has only three fluviometric stations within its coverage area. Thus, studies of water availability in this basin, as well as the assessment of floods while designing hydraulic structures, are hampered by lack of data (Lopes et al. 2017Lopes, T.R.; Zolin, C.A.; Prado, G.; Paulino, J.; Almeida, F.T. 2017. Regionalization of maximum and minimum flow in the Teles Pires basin, Brazil. Engenharia Agrícola, 37: 54-63.). An important aspect in large-scale agriculture areas is water extraction for irrigation, which is growing fast in the upper Teles Pires basin (ANA 2017ANA. 2017. Agência Nacional de Águas. Atlas de irrigação: uso da água na agricultura irrigada. ( (http://atlasirrigacao.ana.gov.br/
). Accessed on 10/01/2018.
http://atlasirrigacao.ana.gov.br/...
), in most cases without the appropriate information on minimum flow to support the grant of water use rights, known in Brazil as outorga. Considering the uncertainties related to the sparse river flow monitoring network, the criteria for granting water rights for irrigation, as well as industrial use, may be compromised in some cases, affecting the sustainability of water use in the basin.
Currently, one of the most challenging issues in hydrology is the development of models that can support decision makers with reliable predictions of river flow, mainly from data-scarce basins, and at the same time be flexible enough for the evaluation of different management scenarios (Birhanu 2009Birhanu, B.Z. 2009. Hydrological modeling of the Kihansi river catchment in South Central Tanzania using SWAT model. International Journal of Water Resources and Environmental Engineering, 1: 1-10.). In this context, conceptual and physically based hydrological models emerged as important tools for water resource planning and management, due to their applicability for streamflow forecasting and assessment of the impacts of land use and climate change on water availability. In this regard, several hydrological models are available, such as the European Hydrological System Model (MIKE SHE), Agricultural Policy/Environmental Extender (APEX), Soil and Water Assessment Tool (SWAT) (Golmohammadi et al. 2014) and the Large-Scale Distributed Hydrological Model (MGB-IPH) (Collischonn et al. 2007Collischonn, W.; Allasia, D.G.; Silva, B.C.; Tucci, C.E.M. 2007. The MGB-IPH model for largescale rainfall-runoff modelling. Hydrological Sciences Journal, 52: 878-895.). The MGB-IPH model has been successfully applied in several Brazilian basins with different characteristics (Felix and Paz 2016; Neto et al. 2006).
The objective of this study was to run a hydrological calibration, validation and performance evaluation of the MGB-IPH hydrological model for the upper Teles Pires basin in order to assess water availability and seasonal variations in river discharge. Our aim was to create a tool to support decision makers in the management of water resources in this little known basin.
MATERIAL AND METHODS
Study Area
The Teles Pires River is one of the territorial divisors of the Brazilian Mato Grosso and Pará states (Figure 1) and a major tributary of the Tapajos River, one of the most important tributaries of the right bank of the Amazonas River. The Teles Pires River basin drainage area, at the confluence with the Tapajos, is of about 141.278 km2, covering 35 municipalities, 31 in Mato Grosso and four in Pará.

Geographical location of the upper Teles Pires River basin in Mato Grosso, Brazil. The map of Brazil shows the outlines of federal states. The Teles Pires River basin in shown spanning the states of Mato Grosso, to the south, and Pará. This figure is in color in the electronic version.
For the purpose of water resource management, the basin was divided by the Brazilian National Water Resources Plan (Plano Nacional de Recursos Hídricos), in upper, middle and lower sub-basins, according to the physical and topological characteristics of each section (EPE 2009EPE. 2009. Empresa de Pesquisa Energética. Avaliação Ambiental Integrada (AAI). ( (http://www.epe.gov.br/pt/publicacoes-dados-abertos/publicacoes/avaliacao-ambiental-integrada-aai
). Accessed on 19/09/2017.
http://www.epe.gov.br/pt/publicacoes-dad...
). The upper Teles Pires basin lies between 15º00’ and 11º00’S, and 54º00’ and 58º00’W, and extends across nearly 37,444 km2, with an average slope of 0.79 m km-1. The prevailing climate types within the basin are Aw (tropical with a dry winter) and Am (tropical monsoon), with precipitation and mean annual temperature of approximately 2000 mm and 25 ºC, respectively (Souza et al. 2013Souza, A.P.; Mota, L.L.; Zamadei, T.; Martim, C.C.; Almeida, F.T.; Paulino, J. 2013. Classificação climática e balanço hídrico climatológico no Estado de Mato Grosso. Nativa, 1: 34-43.; Alvares et al. 2013Alvares, C.A.; Stape, J.L.; Sentelhas, P.C.; Gonçalves, J.L.M.; Sparovek, G. 2013. Köppen’s climate classification map for Brazil. Meteorologische Zeitschrift, 22: 711-728. ). According to measurements taken at the fluviometric stations within the basin, the highest specific average flow has been recorded at 28.14 L s-1 km-2 (the average values reported for the middle and lower Teles Pires are 24.39 L s-1 km-2 and 23.13 L s-1 km-2, respectively) (EPE 2009EPE. 2009. Empresa de Pesquisa Energética. Avaliação Ambiental Integrada (AAI). ( (http://www.epe.gov.br/pt/publicacoes-dados-abertos/publicacoes/avaliacao-ambiental-integrada-aai
). Accessed on 19/09/2017.
http://www.epe.gov.br/pt/publicacoes-dad...
). The main soil type classes in the upper Teles Pires basin include Cambisol (gleied soils with moderate depth and high erodibility); Latosol and associations (gleied and deep soils, more porous and very low erodibility); Red Ultisol and their associations (well or moderately drained, moderately porous and low erodibility); Neossols and their associations (deep soils with low potential for surface runoff, porous and low erodibility) (Santos et al. 2011Santos, H.; Júnior, W.C.; Dart, R.O.; Áglio, M.L.D.; Souza, J.; Pares, J.G.; Oliveira, A.P. 2011. O novo mapa de solos do Brasil: legenda atualizada - Dados eletrônicos. 1st ed. Embrapa Solos, Rio de Janeiro, 67p.; EPE 2009EPE. 2009. Empresa de Pesquisa Energética. Avaliação Ambiental Integrada (AAI). ( (http://www.epe.gov.br/pt/publicacoes-dados-abertos/publicacoes/avaliacao-ambiental-integrada-aai
). Accessed on 19/09/2017.
http://www.epe.gov.br/pt/publicacoes-dad...
).
The natural cover in the Teles Pires basin was originally Cerrado, and Amazon/Cerrado transition vegetation. Today the basin spans one of the so-called “Brazilian agricultural frontiers”, and its forest cover has suffered intense anthropization from 1986 to 2014, with substantial reduction in forest area. The expansion of pasture and subsequent agriculture areas was the main driver of forest clearing in the upper Teles Pires basin (Zaiatz et al. 2018Zaiatz, A.P.S.R.; Zolin, C.A.; Paulino, J.; Vendrusculo, L.G.; Lopes, T.R. 2018. Agricultural land use and cover change in the Cerrado/Amazon ecotone: a case study in the upper Teles Pires River basin. Acta Amazonica, 48: 168 -177.).
MGB-IPH model and input data
The MGB-IPH model takes into account different modules for the calculation of soil water budget, evapotranspiration, flow propagation within a cell, and flow routing through the drainage network. The river basin is divided into elements of area linked by channels, with land use and cover within each element arranged into classes. Based on the Digital Elevation Model (DEM) (Figure 2A), the model discretizes the drainage network in several irregular units (catchment areas) (Figure 2B) (Getirana et al. 2010Getirana, A.C.V.; Bonnet, M.P.; Rotunno Filho, O.C.; Collischonn, W.; Guyot, J.L.; Seyler, F.; Mansur, W.J. 2010. Hydrological modelling and water balance of the Negro River basin: evaluation based on in situ and spatial altimetry data. Hydrological Processes, 24: 3219-3236.). Based on the catchment area discretization, the model uses the combination of soil types and land cover to delineate Hydrological Response Units (HRU) (Figure 2C), which are areas with expected similar hydrological response (Collischonn et al. 2007Collischonn, W.; Allasia, D.G.; Silva, B.C.; Tucci, C.E.M. 2007. The MGB-IPH model for largescale rainfall-runoff modelling. Hydrological Sciences Journal, 52: 878-895.). The water budget and evapotranspiration are then calculated for each HRU.

Characterization maps of the upper Teles Pires River basin (Mato Grosso, Brazil). (A) Digital elevation model (DEM); (B) Catchment discretization (sub-basins); (C) Hydrological response units (HRUs): Forest in deep soil (FDS), Forest in shallow soil (FSS), Planted Pasture in deep soil (LDS), Planted pasture in shallow soil (LSS), Agriculture in deep soil (ADS), Agriculture in shallow soil (ASS), Secondary vegetation in deep soil (PDS), Secondary vegetation in shallow soil (PSS) and Water. This figure is in color in the electronic version.
The MGB-IPH input data is divided in two categories: weather and discharge time series data and spatial data (maps of soil type, land cover and DEM). The DEM data used in this study was provided by the National Institute for Space Research (INPE), with spatial resolution of 30 x 30 m (Figure 2A) (INPE 2017INPE. 2018. Instituto Nacional de Pesquisas Espaciais. Divisão de Sensoriamento Remoto (DSR-INPE). Banco de Dados Geomorfométricos do Brasil - TOPODATA. ( (http://www.dsr.inpe.br/topodata/
). Accessed on 20/11/2017.
http://www.dsr.inpe.br/topodata/...
). The land use and cover map from 2014 was used as input data and was obtained from Zaiatz et al. (2018Zaiatz, A.P.S.R.; Zolin, C.A.; Paulino, J.; Vendrusculo, L.G.; Lopes, T.R. 2018. Agricultural land use and cover change in the Cerrado/Amazon ecotone: a case study in the upper Teles Pires River basin. Acta Amazonica, 48: 168 -177.), who evaluated the land use and cover dynamics of the area from 1986 to 2014. The soil map was obtained through the RADAM-Brazil Project (Santos et al. 2011Santos, H.; Júnior, W.C.; Dart, R.O.; Áglio, M.L.D.; Souza, J.; Pares, J.G.; Oliveira, A.P. 2011. O novo mapa de solos do Brasil: legenda atualizada - Dados eletrônicos. 1st ed. Embrapa Solos, Rio de Janeiro, 67p.), provided by the Brazilian Institute of Geography and Statistics (IBGE). The main soil types in the upper Teles Pires basin were grouped into two classes, shallow soils (SS) (Cambisol and Neosol) and deep soils (DS) (Utsol and Latosol), according to their potential for runoff generation. The land use and cover was classified into five classes as follows: Forest (F), Planted Pasture (L), Agriculture (A), Secondary Vegetation (P) and Water (W).
In addition to the cartographic data, the MGB-IPH model uses flow data and interpolated rainfall, temperature, solar radiation, relative humidity, wind speed and atmospheric pressure data. These data were obtained from three fluviometric stations located within the upper Teles Pires basin (Cachoeirão, Teles Pires and Porto Roncador) and pluviometric stations located within the basin and in surrounding regions (Table 1 and Figure 2A), through the Hydrological Information System (Hidroweb) provided by the National Water Agency (ANA 2016ANA. 2018. Agência Nacional de Águas. Hidro Web: Sistemas de informações hidrológicas. ( (http://hidroweb.ana.gov.br
). Accessed on 10/01/2018.
http://hidroweb.ana.gov.br...
) and from the Brazilian National Institute of Meteorology (INMET).
Fluviometric and pluviometric stations used to obtain time series for the upper Teles Pires River basin (Mato Grosso, Brazil).
In order to assess the ability of the model to simulate the dynamics in the hydrological system under study, the model calibration is performed for a specific time period, and validated for another period, not used in the calibration. The validation step allows to confirm the accuracy of the calibrated parameters of the model aiming at the simulation of stationary processes in river basins with hydrological data.
A 20-year series period (1991-2011) of river-flow data was used for the simulation of the upper Teles Pires basin as follows: a five-year period (1991-1995) was used for the MGB-IPH warm-up, in order to reduce the effects of uncertainties regarding the initial conditions of the model parameters (Collischonn 2001Collischonn, W.; Tucci, C.E.M. 2001. Simulação hidrológica de grandes bacias. Revista Brasileira de Recursos Hídricos, 6: 95-118.; Tucci 2005Tucci, C.E.M. 2005.Modelos hidrológicos. 2nd ed. UFRGS/ABRH, Porto Alegre, 669p.); the subsequent 10 years (1996-2006) were used for the calibration and the last five years (2007-2011) were used for the validation of the MGB-IPH model.
Model calibration is an interactive process in which parameter values are modified and their effect on results is evaluated repeatedly until the calculated data (hydrograph) reproduce the observed data with good accuracy. In the model calibration the parameters are associated with known variables, such as land-use and cover classes and soil types (Collischonn 2001Collischonn, W.; Tucci, C.E.M. 2001. Simulação hidrológica de grandes bacias. Revista Brasileira de Recursos Hídricos, 6: 95-118.), so that after calibration the parameter should adequately reproduce the observed hydrograph.
The following parameters were used for calibration of the MGB-IPH model: soil moisture capacity (Wm); a parameter defining the shape of the storage-saturation relation (b); a parameter controlling flow during dry periods (Kbas); a parameter controlling quantity of soil water emerging as surface flow (Kint); a parameter controlling the shape of the reduction in intermediate or sub-surface drainage (XL); a parameter controlling flow from subterranian reservoir to the soil surface layer during a time-interval (CAP); residual storage (Wc); the coefficient for surface propagation in cells (CS); the coefficient for sub-surface propagation in cells (CI); and the delay for the subterranean reservoir (CB). A detailed description of the MGB-IPH model is presented by Collischonn et al. (2007Collischonn, W.; Allasia, D.G.; Silva, B.C.; Tucci, C.E.M. 2007. The MGB-IPH model for largescale rainfall-runoff modelling. Hydrological Sciences Journal, 52: 878-895.) and Monte et al. (2016Monte, B.E.O.; Costa, D.D.; Chaves, M.B.; Magalhães, L.O.; Uvo, C.B. 2016. Hydrological and hydraulic modelling applied to the mapping of flood-prone áreas. Revista Brasileira de Recursos Hídricos, 21: 152-167.).
Fixed parameter values were taken for albedo, leaf-area index (LAI), tree height (Z) and surface resistance (Rsup) (Table 2), according to the soil type and land use and coverage of each HRU (Collischonn 2001Collischonn, W.; Tucci, C.E.M. 2001. Simulação hidrológica de grandes bacias. Revista Brasileira de Recursos Hídricos, 6: 95-118.; Tucci 2005Tucci, C.E.M. 2005.Modelos hidrológicos. 2nd ed. UFRGS/ABRH, Porto Alegre, 669p.). A value of 0.0100 m³ (s.km²)-1 was obtained for specific baseflow (QB) (Monte et al. 2016Monte, B.E.O.; Costa, D.D.; Chaves, M.B.; Magalhães, L.O.; Uvo, C.B. 2016. Hydrological and hydraulic modelling applied to the mapping of flood-prone áreas. Revista Brasileira de Recursos Hídricos, 21: 152-167.).
In a simplified way, the sensitivity analysis investigates how the variation in the output of a numerical model can be attributed to variations of its input factors (Pianosi et al. 2016Pianosi, F.; Beven, K.; Freer, J.; Hall, J.W.; Rougier, J.; Stephenson, D.B.; Wagener, T. 2016. Sensitivity analysis of environmental models: A systematic review with practical workflow. Environmental Modelling & Software, 79: 214-232.). In this regard, in order to assess the sensitivity of the MGB-IPH model parameter, a qualitative analysis was performed taking into consideration the calibrated parameters from 1996 to 2006, measuring the model performance by comparison of modelled and observed data.
In order to evaluate the MGB-IPH model performance, we used the Nash-Sutcliffe efficiency coefficient (NS) and its logarithmic version (NSLOG), which is more influenced by low flows, as well as the percent bias (PBIAS) coefficient (Fan et al. 2014Fan, F.M.; Collishonn, W. 2014. Integração do Modelo MGB-IPH com Sistema de Informação Geográfica.Revista Brasileira de Recursos Hídricos, 19: 243-254.; Eduardo et al. 2016Eduardo, E.N.; Mello, C.R.; Viola, M.R.; Owens, P.R.; Curi, N. 2016. Hydrological simulation as subside for management of surface water resources at the Mortes River Basin. Ciência e Agrotecnologia, 40: 390-404.) as follows:
(1)
(2)
(3)
where Qm is the observed flow at the streamflow station (m3 s-1); Qs is the simulated flow (m3 s-1); n is the number of time intervals and is the mean observed flow (m3 s-1).
Model performance values of NS and NSLOG > 0.75 were classified as good, while values between 0.36 and 0.75 were acceptable (Liew et al. 2003van Liew, M.W.; Arnold, J.G.; Garbrecht, J.D. 2003. Hydrologic simulation on agricultural watersheds: choosing between two models. Transactions of the ASAE, 46: 1539-1551.; Preira et al. 2014). The percent bias (PBIAS) represents the average tendency (higher or lower) of the simulated data in relation to the observed data. Negative and positive values of PBIAS respectively indicate that the model underestimates or overestimates the simulated flow in relation to observed data. The following range delimitations of PBIAS values were used for model classification: |PBIAS| < 10%, very good; 10% < |PBIAS| < 15%, good; 15% < |PBIAS| < 25%, satisfactory and |PBIAS| > 25%, unsatisfactory (van Liew et al. 2007van Liew, M.W.; Veith, T.L.; Bosch, D.D.; Arnold, J.G. 2007. Suitability of SWAT for the Conservation effects assessment project: A comparison on USDA - ARS watersheds. Journal of Hydrologic Engineering, 12: 17 -189.).
RESULTS
The NS and NSLOG coefficients (Table 3), for both the calibration and validation periods for the three streamflow stations located in the upper Teles Pires basin (Cachoeirão, Teles Pires and Porto Roncador) showed high values (> 0.75), indicating a good fitness between the observed and simulated river flow (Figure 3), as well as a good performance for the MGB-IPH model. Higher values of NSLOG were observed in the calibration period, showing a better adjustment of hydrograph recession. Regarding the PBIAS coefficient, the result was very good (< 10%) for the streamflow stations in the calibration and validation periods, except for the Cachoeirão streamflow station, for which a PBIAS > 10% was obtained, indicating a good result. With exception of the Porto Roncador streamflow station in the calibration period, the MGB-IPH model simulation overestimated the flow in relation to observed data for both the calibration and validation periods.
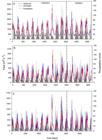
Hydrograph of observed and simulated daily flows during the calibration (1996 - 2006) and validation (2007 - 2011) periods for the Cachoeirão (A), Teles Pires (B) and Porto Roncador (C) streamflow stations in the upper Teles Pires River basin (Mato Grosso, Brazil). This figure is in color in the electronic version.
The permanence curves of the daily flow simulated by the MGB-IPH model had a good fit in the Teles Pires (Figure 4B) and Porto Roncador (Figure 4C) streamflow stations for both Q90 and Q95 estimates. Moreover, the values of the coefficient of determination (R2) for both calibration and validation were high, showing the accuracy of the MGB-IPH model simulation for both periods (Figure 4).

Continuity curves and the respective regression analyses of observed and simulated daily flows during the calibration (1996 - 2006) and validation (2007 - 2011) periods for the Cachoeirão (A1 and A2), Teles Pires (B1 and B2) and Porto Roncador (C1 and C2) streamflow stations in the upper Teles Pires River basin (Mato Grosso, Brazil). The numbers 1 and 2 represent, respectively, the calibration and validation periods for each streamflow station. This figure is in color in the electronic version.
Regarding the sensitivity analyses of the MGB-IPH model parameters, the most relevant parameters were Wm and b, which strongly affected maximum and minimum streamflow, as well as the overall PBIAS. The final calibrated parameters of the MGB-IPH model for the upper Teles Pires basin are presented in Table 4.
DISCUSSION
The MGB-IPH model showed a good fit between the observed and simulated values of river flow in the upper Teles Pires River basin, reproducing well the river hydrograph for all streamflow stations. In most streamflow stations we observed a decrease in the NS coefficient values from the calibration to the validation period, which was also observed by Strauch et al. (2011Strauch, M.; Bernhoferb, C.; Koide, S.; Volk, M.; Lorz, C.; Makeschin, F. 2012. Using precipitation data ensemble for uncertainty analysis in SWAT streamflow simulation. Journal of Hydrology, 414: 413-424. ), Lelis et al. (2012Lelis, T.A.; Calijuri, M.L.; Santiago, A.F.; Lima, D.C.; Rocha, E.O. 2012. Análise de Sensibilidade e Calibração do Modelo Swat Aplicado em Bacia Hidrográfica da Região Sudeste do Brasil. Revista Brasileira de Ciência do Solo, 36: 623-634.), Melo Neto et al. (2014Melo Neto, J.O.; Silva, A.M.; Mello, C.R.; Mello Júnior, A.V. 2014. Simulação hidrológica escalar com o modelo SWAT. Revista Brasileira de Recursos Hídricos, 19: 177188.) and Monteiro et al. 2015Monteiro, J.A.F.; Strauch, M.; Srinivasan, R.; Abbaspour, K.; Gücker, B. 2015. Accuracy of grid precipitation data for Brazil: application in river discharge modelling of the Tocantins catchment. Hydrological Processes, 30:1419-1430.). In general, the simulated streamflow adjusted very well to the observed data, showing the model ability to reproduce the frequent oscillations embedded in long-term continuous simulation.
In the Taquari-Antas basin, in southern Brazil, NS and NSLOG ranges were 0.66 − 0.90 and 0.71 − 0.86, respectively, in the calibration period of the MGB-IPH model, while in the validation period NS and NSLOG ranges were 0.4 − 0.84 and 0.75 − 0.86 (Collischonn et al. 2007Collischonn, W.; Allasia, D.G.; Silva, B.C.; Tucci, C.E.M. 2007. The MGB-IPH model for largescale rainfall-runoff modelling. Hydrological Sciences Journal, 52: 878-895.). In this latter study only one MGB-IPH model performance was considered unsatisfactory (NS = 0.4) in one of the 11 analyzed streamflow stations, which was attributed to poor raingauge coverage and relatively small contribution area.
Fan et al. (2014Fan, F.M.; Collischonn, W.; Meller, A.; Botelho, L.C.M. 2014. Ensemble streamflow forecasting experiments in a tropical basin: The São Francisco river case study. Journal of Hydrology, 519: 2906-2919.) used the MGB-IPH model in a case study of ensemble forecasting experiments in the upper part of the São Francisco River basin, in southeastern Brazil, and found good results (NS and NSLOG > 0.75) for 70% of the streamflow stations in the calibration period. The use of the MGB-IPH model for the hydrologic and hydrodynamic modeling of the Amazon River resulted in a good performance of 70% of the streamflow stations with NS > 0.6 and 75% with BIAS < 15% (Paiva et al. 2013Paiva, R.C.D.; Buarque, D.C.; Collischonn, W.; Bonnet, M.P.; Frappart, F.; Calmant, S.; Mendes, C.A.B. 2013. Large-scale hydrologic and hydrodynamic modeling of the Amazon River basin. Water Resources Research, 49: 1226-1243.). These results confirm the potential of the MGB-IPH model to simulate river flow in different regions and climate conditions in Brazil, providing an important tool for decision makers regarding water resource planning and management, specially in data-scarce regions, as is the case in the agriculture frontier between the Cerrado and Amazon regions.
The overestimation of the peak flows observed during the calibration period at the Cachoeirão and Teles Pires streamflow stations can be explained by a period of data failure in the flow data series of both stations. At the Porto Roncador station, where the best adjustment of the hydrograph in the calibration period was observed, the data series had no missing values. At Cachoeirão the model underestimated the Q90 and Q95 flows, which is more acceptable for water use rights criteria than overestimation, taking into account the precautionary principle (MMA 2018MMA. 2018. Ministério do Meio Ambiente. Princípio da Precaução. ( (http://www.mma.gov.br/informma/item/7512
). Accessed on 17/09/2018.
http://www.mma.gov.br/informma/item/7512...
), especially in the context of lack of information for the upper Teles Pires basin, and the uncertainties involved in Q90 and Q95 flow extrapolation. The good fit of simulated and observed data of the permanence curve is of great importance for possible applications of the MGB-IPH model for the assessment of water availability and long-term forecasts in the water management process. Our high R2 values also attest the applicability of the MGB-IPH model for river flow forecasting.
The important role of the Wm and b parameters in the sensitivity analyses for the model performance assessment is related to the fact that b controlled the shape of the hydrograph peaks, giving better fit to maximum streamflow, while Wm adequately represented the soil characteristics related to soil infiltration capacity, as also observed by Monte et al. (2016Monte, B.E.O.; Costa, D.D.; Chaves, M.B.; Magalhães, L.O.; Uvo, C.B. 2016. Hydrological and hydraulic modelling applied to the mapping of flood-prone áreas. Revista Brasileira de Recursos Hídricos, 21: 152-167.).
The hydrological calibration and validation of the MGB-IPH model for the upper Teles Pires River basin can properly predict the overall variation in streamflow, and showed potential for use as a tool to support decision makers in water resource planning and management in the region, as well as researchers working on land use and climate change scenarios and their impact on water availability.
CONCLUSIONS
The MGB-IPH model proved to be efficient for the hydrologic simulation of the upper Teles Pires River basin. The flow hydrograph was adequately represented for both the calibration and validation periods. The NS and NSLOG coefficients were higher than 0.75, and PBIAS varied from -11.4% to 1.9%, usually overestimating the peak flows and underestimating the Q90 and Q95 flows, which is preferable for water resource management and conservation. The most sensitive parameters for the simulation were soil moisture capacity and the storage-saturation relation, which strongly affected maximum and minimum streamflow, as well as the overall water balance. Our results indicate that the MGB-IPH model can be used as a support tool for water resource management in the upper Teles Pires basin, and for short-time water availability assessment through the permanence curves.
ACKNOWLEDGMENTS
The authors thank Embrapa Agrossilvipastoril, Universidade Federal do Mato Grosso (UFMT) through the Programa de Pós-Graduação em Agronomia (Campus Sinop), Fundação de Amparo à Pesquisa do Estado do Mato Grosso (FAPEMAT), and the referees and journal editors for their suggestions and assistance.
- ANA. 2017. Agência Nacional de Águas. Atlas de irrigação: uso da água na agricultura irrigada. ( (http://atlasirrigacao.ana.gov.br/ ). Accessed on 10/01/2018.
» http://atlasirrigacao.ana.gov.br/ - ANA. 2018. Agência Nacional de Águas. Hidro Web: Sistemas de informações hidrológicas. ( (http://hidroweb.ana.gov.br ). Accessed on 10/01/2018.
» http://hidroweb.ana.gov.br - Alvares, C.A.; Stape, J.L.; Sentelhas, P.C.; Gonçalves, J.L.M.; Sparovek, G. 2013. Köppen’s climate classification map for Brazil. Meteorologische Zeitschrift, 22: 711-728.
- Birhanu, B.Z. 2009. Hydrological modeling of the Kihansi river catchment in South Central Tanzania using SWAT model. International Journal of Water Resources and Environmental Engineering, 1: 1-10.
- Collischonn, W.; Allasia, D.G.; Silva, B.C.; Tucci, C.E.M. 2007. The MGB-IPH model for largescale rainfall-runoff modelling. Hydrological Sciences Journal, 52: 878-895.
- Collischonn, W.; Tucci, C.E.M. 2001. Simulação hidrológica de grandes bacias. Revista Brasileira de Recursos Hídricos, 6: 95-118.
- Eduardo, E.N.; Mello, C.R.; Viola, M.R.; Owens, P.R.; Curi, N. 2016. Hydrological simulation as subside for management of surface water resources at the Mortes River Basin. Ciência e Agrotecnologia, 40: 390-404.
- EPE. 2009. Empresa de Pesquisa Energética. Avaliação Ambiental Integrada (AAI). ( (http://www.epe.gov.br/pt/publicacoes-dados-abertos/publicacoes/avaliacao-ambiental-integrada-aai ). Accessed on 19/09/2017.
» http://www.epe.gov.br/pt/publicacoes-dados-abertos/publicacoes/avaliacao-ambiental-integrada-aai - Espinoza, J.C.; Marengo, J.A.; Ronchail, J.; Carpio, J.M.; Flores, L.N.; Guyot, J.L. 2014. The extreme 2014 flood in south-western Amazon basin: the role of tropical-subtropical South Atlantic SST gradient. Environmental Research Letters, 9: 1-9.
- Fan, F.M.; Collishonn, W. 2014. Integração do Modelo MGB-IPH com Sistema de Informação Geográfica.Revista Brasileira de Recursos Hídricos, 19: 243-254.
- Fan, F.M.; Collischonn, W.; Meller, A.; Botelho, L.C.M. 2014. Ensemble streamflow forecasting experiments in a tropical basin: The São Francisco river case study. Journal of Hydrology, 519: 2906-2919.
- Getirana, A.C.V.; Bonnet, M.P.; Rotunno Filho, O.C.; Collischonn, W.; Guyot, J.L.; Seyler, F.; Mansur, W.J. 2010. Hydrological modelling and water balance of the Negro River basin: evaluation based on in situ and spatial altimetry data. Hydrological Processes, 24: 3219-3236.
- Huete, A.R.; Didan, K.; Shimabukuro, Y.E.; Ratana, P.; Saleska, S.R.; Hutyra, L.R.; Yang, W.; Nemani, R.R.; Myneni, R. 2006. Amazon rainforests green-up with sunlight in dry season. Geophysical Research Letters, 33: 1-4.
- INPE. 2018. Instituto Nacional de Pesquisas Espaciais. Divisão de Sensoriamento Remoto (DSR-INPE). Banco de Dados Geomorfométricos do Brasil - TOPODATA. ( (http://www.dsr.inpe.br/topodata/ ). Accessed on 20/11/2017.
» http://www.dsr.inpe.br/topodata/ - Lelis, T.A.; Calijuri, M.L.; Santiago, A.F.; Lima, D.C.; Rocha, E.O. 2012. Análise de Sensibilidade e Calibração do Modelo Swat Aplicado em Bacia Hidrográfica da Região Sudeste do Brasil. Revista Brasileira de Ciência do Solo, 36: 623-634.
- Lopes, T.R.; Zolin, C.A.; Prado, G.; Paulino, J.; Almeida, F.T. 2017. Regionalization of maximum and minimum flow in the Teles Pires basin, Brazil. Engenharia Agrícola, 37: 54-63.
- Marengo, J.A.; Nobre, C.A.; Tomasella, J. 2008. The drought of Amazonia in 2005. American Meteorological Society, 21: 495-516.
- Marengo, J.A.; Tomasella, J.; Alves, L.M.; Soares, W.R.; Rodriguez, D.A. 2011. The drought of 2010 in the context of historical droughts in the Amazon region. Geophysical Research Letters, 38: 1-5.
- Melo Neto, J.O.; Silva, A.M.; Mello, C.R.; Mello Júnior, A.V. 2014. Simulação hidrológica escalar com o modelo SWAT. Revista Brasileira de Recursos Hídricos, 19: 177188.
- MMA. 2018. Ministério do Meio Ambiente. Princípio da Precaução. ( (http://www.mma.gov.br/informma/item/7512 ). Accessed on 17/09/2018.
» http://www.mma.gov.br/informma/item/7512 - Monteiro, J.A.F.; Strauch, M.; Srinivasan, R.; Abbaspour, K.; Gücker, B. 2015. Accuracy of grid precipitation data for Brazil: application in river discharge modelling of the Tocantins catchment. Hydrological Processes, 30:1419-1430.
- Monte, B.E.O.; Costa, D.D.; Chaves, M.B.; Magalhães, L.O.; Uvo, C.B. 2016. Hydrological and hydraulic modelling applied to the mapping of flood-prone áreas. Revista Brasileira de Recursos Hídricos, 21: 152-167.
- Nie, N.; Zhang, W.; Guo, H.; Ishwaran, N. 2015. 2010-2012 drought and flood events in the Amazon Basin inferred by GRACE satellite observations. Journal of Applied Remote Sensing, 9: 1-14.
- Paiva, R.C.D.; Buarque, D.C.; Collischonn, W.; Bonnet, M.P.; Frappart, F.; Calmant, S.; Mendes, C.A.B. 2013. Large-scale hydrologic and hydrodynamic modeling of the Amazon River basin. Water Resources Research, 49: 1226-1243.
- Pianosi, F.; Beven, K.; Freer, J.; Hall, J.W.; Rougier, J.; Stephenson, D.B.; Wagener, T. 2016. Sensitivity analysis of environmental models: A systematic review with practical workflow. Environmental Modelling & Software, 79: 214-232.
- Santos, H.; Júnior, W.C.; Dart, R.O.; Áglio, M.L.D.; Souza, J.; Pares, J.G.; Oliveira, A.P. 2011. O novo mapa de solos do Brasil: legenda atualizada - Dados eletrônicos 1st ed. Embrapa Solos, Rio de Janeiro, 67p.
- Seplan. 2017. Secretaria de Estado de Planejamento. PIB Mato Grosso e Municípios. ( (http://www.seplan.mt.gov.br/-/3934855-pib-mato-grosso-e-municipios ). Accessed on 06/06/2017.
» http://www.seplan.mt.gov.br/-/3934855-pib-mato-grosso-e-municipios - Souza, A.P.; Mota, L.L.; Zamadei, T.; Martim, C.C.; Almeida, F.T.; Paulino, J. 2013. Classificação climática e balanço hídrico climatológico no Estado de Mato Grosso. Nativa, 1: 34-43.
- Strauch, M.; Bernhoferb, C.; Koide, S.; Volk, M.; Lorz, C.; Makeschin, F. 2012. Using precipitation data ensemble for uncertainty analysis in SWAT streamflow simulation. Journal of Hydrology, 414: 413-424.
- Tucci, C.E.M. 2005.Modelos hidrológicos 2nd ed. UFRGS/ABRH, Porto Alegre, 669p.
- van Liew, M.W.; Arnold, J.G.; Garbrecht, J.D. 2003. Hydrologic simulation on agricultural watersheds: choosing between two models. Transactions of the ASAE, 46: 1539-1551.
- van Liew, M.W.; Veith, T.L.; Bosch, D.D.; Arnold, J.G. 2007. Suitability of SWAT for the Conservation effects assessment project: A comparison on USDA - ARS watersheds. Journal of Hydrologic Engineering, 12: 17 -189.
- Zaiatz, A.P.S.R.; Zolin, C.A.; Paulino, J.; Vendrusculo, L.G.; Lopes, T.R. 2018. Agricultural land use and cover change in the Cerrado/Amazon ecotone: a case study in the upper Teles Pires River basin. Acta Amazonica, 48: 168 -177.
-
CITE AS:
Oliveira, R.F.de; Zolin, C.A.; Victoria, D. de C.; Lopes, T.R.; Vendrusculo, L.G.; Paulino, J. 2018. Hydrological calibration and validation of the MGB-IPH model for water resource management in the upper Teles Pires River basin in the Amazon-Cerrado ecotone in Brazil. Acta Amazonica 49: 54-63.
Edited by
ASSOCIATE EDITOR:
Publication Dates
-
Publication in this collection
Jan-Mar 2019
History
-
Received
05 Mar 2018 -
Accepted
22 Sept 2018


