Abstract
Abstract: Useful insight can be gained into the underlying adsorption mechanism by studying the adsorption of nitrogen by primary structure coal with different water content. In this work, a coal-adsorption gas experimental system is used to investigate the adsorption of nitrogen by coal samples containing different amounts of water ( 2.894%, 1.871%, 0.897%, and 0%) and different pressures (0.7, 1.2, 1.7, 2.2, 2.7, 3.2, and 3.7MPa). The adsorption rates under the different conditions were calculated using a volume method, and the adsorption kinetics investigated using a kinetic model. The results show that an adsorption model based on an opposing process characterizes the adsorption behavior better than the pseudo-first order kinetic model and pseudo-second order kinetic model. The adsorption rate constant, k, reflects the rate at which the gas can get into the pores of different sizes in the coal a greater k value, implies a greater increment in the rate. The k value is found to decrease when the initial pressure is increased for the same moisture content. Also, the greater the water content, the smaller the value of k for a given initial pressure. As the moisture content continues to increase, the k value tends to a certain value. The results presented can provide an experimental basis for the study of the mechanism responsible for the adsorption of nitrogen by primary structure coal with different moisture content.
Key words
adsorption kinetics; adsorption rate constant; primary structural coal; moisture content.
INTRODUCTION
Many experimental studies have shown that coal adsorbed gas is not selective (Zhao et al. 2012ZHAO D. 2012. Study on coalbed methane adsorption \& desorption mechanism influenced by coupling of water injection and temperature. Taiyuan University of Technology., Kang et al. 2017KANG YL, CHEN YB and LI XC. 2017. Effect of particle size on methane sorption capacity of shale. Natural Gas Geoscience 28(2): 272-279., Ou 2014OU ZP. 2014. Molecular dynamics study of methane diffusion in nanopores. Southwest Petroleum University.). Different conditions (e.g. coal composition, its pore and fracture structure, its moisture content, etc.) can cause the rate of adsorption and the total adsorption capacity of the coal to differ. Studies that investigate the rate of adsorption of gas by coal can be used to study the adsorption mechanism itself (Zhang et al. 2014ZHANG ZB, QIU XL and YUAN YQ. 2014. Experimental study on methane adsorption of coal bed from Sihe Mine in Qinshui Basin. Peetroleum Geology \& Experiment X36(5): 656-658.). Adsorption and desorption experiments using powdered coal to absorb CH4, N2, CO2, and other gases, have been carried out using different temperatures, pressures, particle sizes, moisture content, and coal with different metamorphic degrees by employing high temperature and high pressure isothermal adsorption instruments (Yang 2014YANG HP. 2014. Study of the adsorption and desorption mechanism of methane in coalbed. Xi’an University of Science and Technology., Do and Rice 1987DO D and RICE R. 1987. On the relative importance of pore and surface diffusion in non-equilibrium adsorption rate processes. Chem Eng Sci 42: 2269-2284., Payne and Kreutzer 1989PAYNE SH and KREUTZER HJ. 1989. Analysis of thermal desorption data. Surf Sci 222: 404-429., Zuo et al. 2016ZUO L, HU ZM and CUI YX. 2016. High temperature and pressure methane adsorption characteristics and adsorption kinetics of shale. Journal of China Coal Society 41(8): 2017-2023.). The results obtained show that provided all the other conditions are the same, the higher the temperature, the greater the kinetic energy of the gas, which is disadvantageous to gas adsorption. Also, the higher the pressure, the greater the adsorption capacity. Smaller particle sizes tend to make adsorption easier. Furthermore, when the moisture content is within a certain range of values, the greater the moisture content, the smaller the total amount of adsorption (Zhao et al. 2014ZHAO D, FENG ZC and ZHAO YS. 2014. Effects of liquid water on coalbed methane adsorption characteristics based on the adsorption kinetic theory. Journal of China Coal Society 39(3): 518-523., Feng et al. 2009FENG ZC, ZHAO D and ZHAO YS. 2009. Experimental study on impact of water ratio to adsorption of limp coal. CJRME 28(S2): 3291-3295., Hao et al. 2015HAO X, DA ZT, JUN LZ, SONG L and SHU T. 2015. A new laboratory method for accurate measurement of the methane diffusion coefficient and its influencing factors in the coal matrix. Fuel 158: 239-247., Wei et al. 2017WEI Z, YUAN PC, HAI NJ, HAI FW and WEI L. 2017. Modeling and experiments for transient diffusion coefficients in the desorption of methane through coal powders. Int J Heat Mass Transf 110: 845-854.).
Researchers in China and elsewhere have analyzed and summarized the available experimental results and established various models (the pseudo-first order adsorption model, quasi two-stage adsorption model, the Bangham kinetic model, etc.) (Ya and Zhi 2016YA M and ZHI PL. 2016. Experimental study on diffusion property of methane gas in coal and its influencing factors. Fuel 185: 219-228., Wei et al. 2017WEI Z, YUAN PC, HAI NJ, HAI FW and WEI L. 2017. Modeling and experiments for transient diffusion coefficients in the desorption of methane through coal powders. Int J Heat Mass Transf 110: 845-854., Zhao et al. 2016ZHAO JL, TANG DZ and XU H. 2016. Measurement of methane diffusion coefficient and analysis of its influencing factors in coal matrix. Coal Science and Technology 44(10): 77-82.). Under different experimental conditions it has been found that the adsorption of different substances on the solid accord with different adsorption models. For example, the adsorption of shale gas is more suitably described by the Bangham adsorption equation. Higher temperatures and pressures correspond to smaller adsorption rate constants in the Bangham model, which means it becomes more difficult to increase the adsorption capacity (Yi 2014YI SW. 2014. Factors Affecting Gas Diffusion Rates in Coal and Rock Reservoirs and Intensification Methods. Southwest Petroleum University., Dai 2016DAI JW. 2016. Study on microcosmic mechanism of gas supercritical adsorption in shale nanoparticles. Southwest Petroleum University., Ren et al. 2015REN SY, LI GX and ZHAO HH. 2015. Research progress of pressure adsorption and concentration of low-concentration CBM technology. Anhui Chemical Engineering 41(2): 1-3., Dong et al. 2017DONG Z, ZENG CF, DONG Z, YANG SZ and TING TC. 2017. Experimental study of meso-structural deformation of coal during methane adsorption-desorption cycles. J Nat Gas Sci Eng 42: 243-251., Xiao and Cai 2017XIAO LL and CAI FW. 2017. Simulation of dynamic changes of methane state based on NMR during coalbed methane output. Fuel: 194: 188-194., Bai et al. 2011BAI JR,WANG Q and QI H. 2011. Kinetics and thermodynamics of adsorption of heavy metal ions onto fly ash from oil shale. Journal of Fuel Chemistry and Technology 39(5): 378-384.). Overall, the models devised can provide a useful foundation for the further description of the adsorption process as coal absorbs gases.
Due to the experimental conditions used, the previous isothermal adsorption experiments are carried out using pulverized coal (primary component with a particle size no greater than 180 μm). As the particle size is very different to that of the primary structure coal (the primary structural coal refers to the coal seam which preserves the original structure and structural characteristics, and retains a large number of pores and fracture structures of different scales such as millimeter, micrometer and nano-scale cracks), the experimental results are also very different. To study the adsorption of nitrogen gas at a variety of initial pressures, and investigate the effect of having coal with different moisture content, an appropriate homemade set of experimental apparatus was constructed. Experiments were subsequently carried out to determine the rate of adsorption, adsorption capacity, and the effect of initial pressure and moisture content.
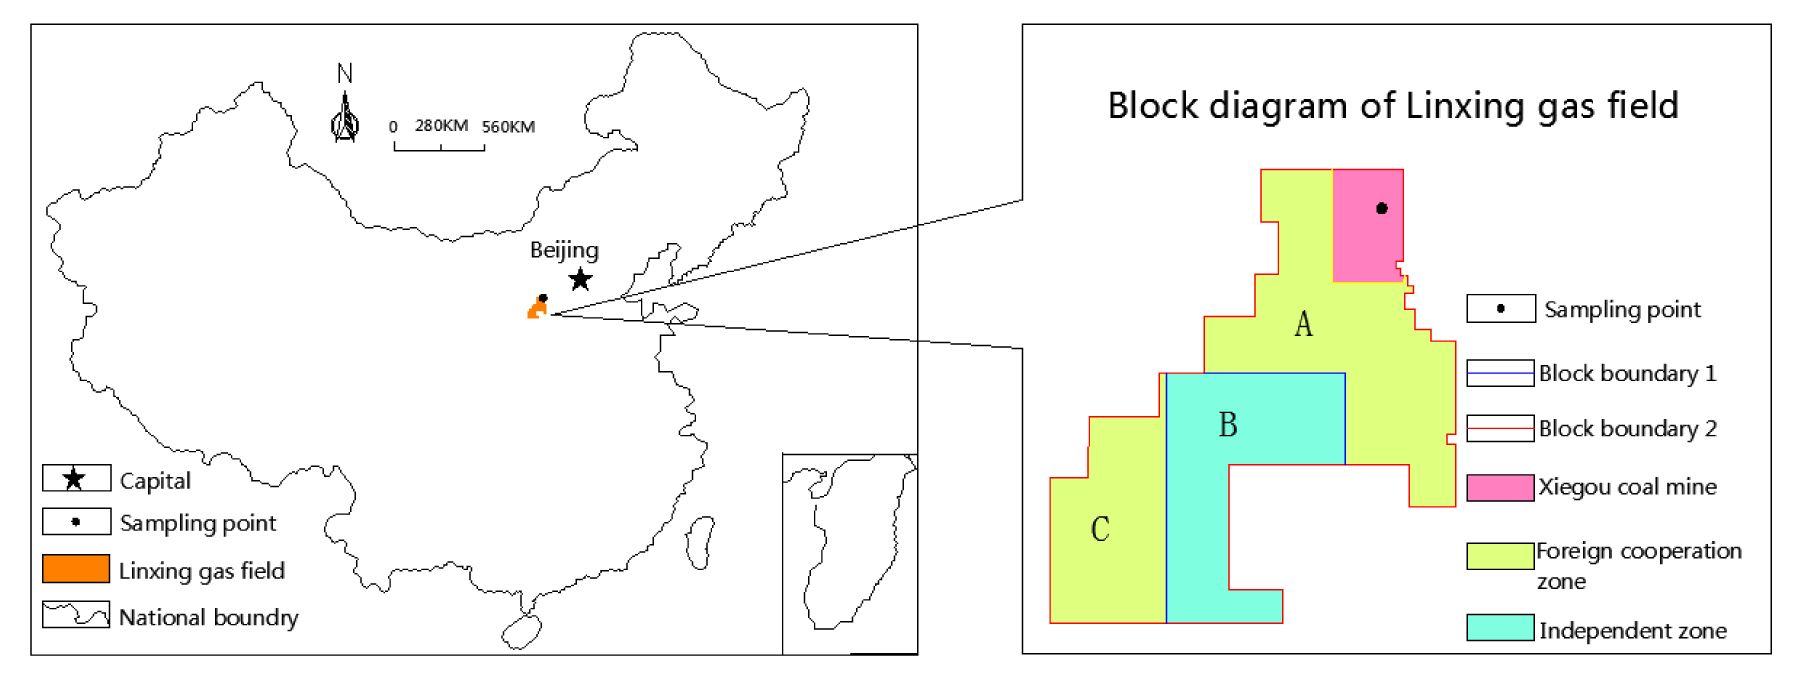
The experimental sampling area is the southern margin of the ordos basin. The geological structure of the sampling area is based on the movement of the middle Yanshan and the development of the Himalayan movement. Geological decided to gas reservoir, due to the sedimentation stability, simple structure, therefore area for coalbed methane exploration and development demonstration area in China, study the regional characteristics of the original structure of coal adsorption on its guidance and development of great significance.
EQUIPMENT AND EXPERIMENTAL SCHEME
SAMPLE PREPARATION AND EQUIPMENT
Sample preparation
The coal sample is selected as the Xiegou coal mine in linxing gas field, and its geographical location is shown in Fig. 1. Following the standards given in the document GT/T23561-2009, the coal was processed into samples of diameter 50 mm and height 100 mm by sawing, drilling, and polishing. After they were cleaned in an ultrasonic cleaner, the samples were placed in a drying oven at 75 °C for more than 48 hours. The mass of each sample was weighed using a precision balance. The coal samples density, microscopic composition, reflectivity, etc. were tested and industrial analysis tests, see Table I. The experimental apparatus and test sample are shown in Figs.1 and 2.


Equipment
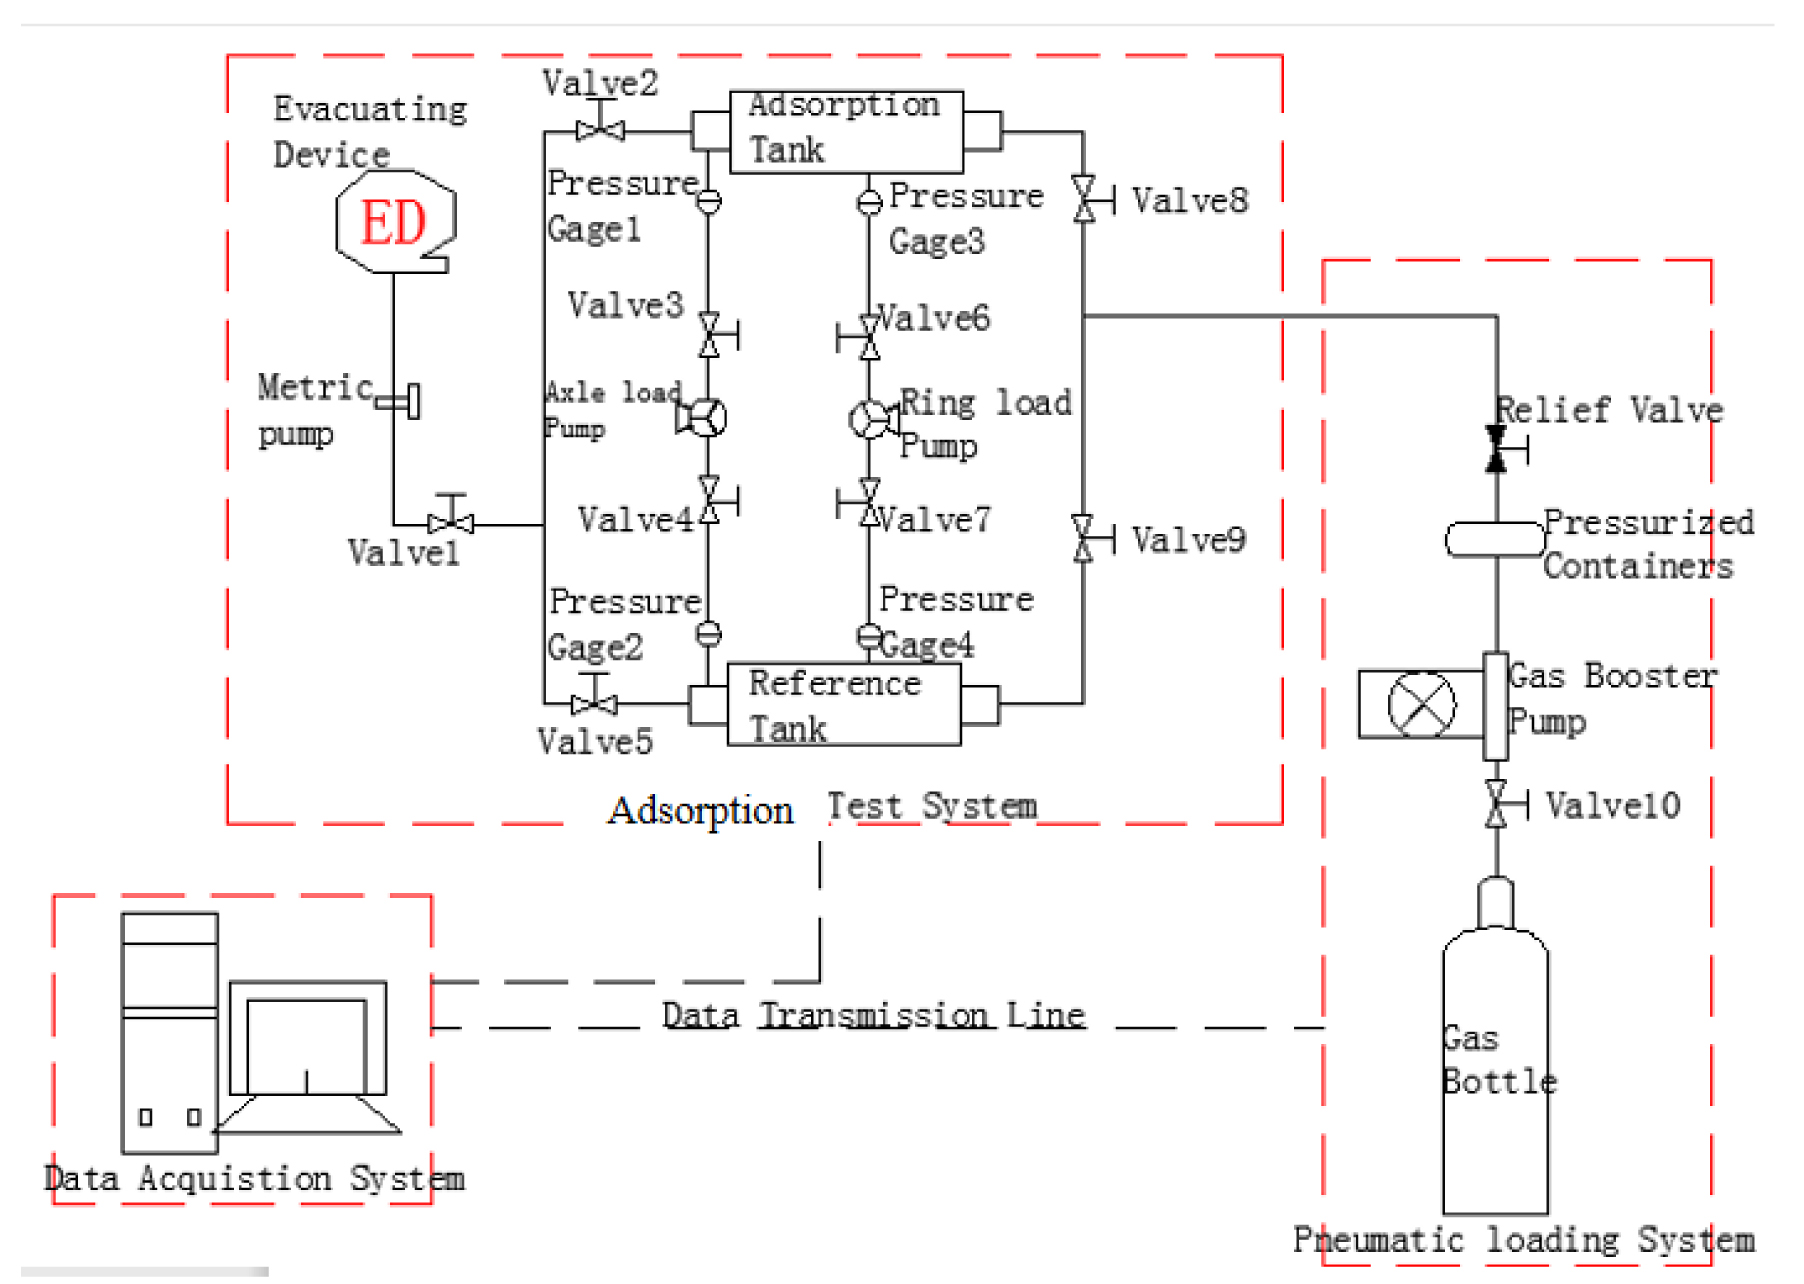
The test apparatus is composed of several parts connected in the manner shown schematically in Fig.3. The main components are the pneumatic loading system, adsorption system, and data acquisition system:
-
Pneumatic loading system: This system is comprised of gas cylinders, gas booster pump, pressure vessels, safety valve, and so on. If the cylinder pressure is insufficient to achieve the required pressure, the gas booster pump is used to create the additional pressure required. The pressure vessels can control the system pressure, and the safety valve can control the starting and stopping of the system.
-
Adsorption system: This part of the apparatus includes the generator, axial- and confining-pressure pump groups, temperature controller, precise gas flow-meter, vacuum pump, and safety valve, etc. The manually-operated axial-pressure pump, confining-pressure pump, and pneumatic loading system can provide both axial and confining pressure. The vacuum pump is used to pump gas out of the system and the temperature controller controls the experimental temperature. The gas flow-meter with safety valve is used to determine the volume of test gas flowing.
-
Data acquisition system: This part is comprised of the pressure sensor, temperature sensor, synthetic circuit, computer, and data recording program, etc. The pressure and temperature sensors record the temperature and pressure changes in real-time (the data is transmitted to the computer).

EXPERIMENTAL METHOD
The main experimental steps involved are:
-
Sample drying: The coal samples were grouped, numbered (No. 1 - 4), and placed in a drying box at 70 °C for not less than 72 hours. The experimental design pressure gradient was 0.7 MPa, 1.2 MPa, 1.7 MPa, 2.2 MPa, 2.7 MPa, 3.2 MPa, 3.7 MPa.
-
Gas tightness inspection and free volume measurement: After degassing, the coal samples were filled with helium until the gas pressure reached a set value (P1). Then, the valve at the end of the flow generator was opened, and the flow-meter recorded the flow. When these operation steps were completed, the system was filled with helium until the gas pressure reached to the second set value (P2). The operation and recording of the change in flow were repeated as before. In order to avoid interference from other factors, the temperature difference between these two procedures must be no more than 1 °C.
-
Adsorption of nitrogen at different pressure: A group of coal was selected and placed in generator 2. To simulate the stress in the coal seam, the loading axial pressure and confining pressure were increased using the rotating hand rocker of the axial pressure pump and the surrounding pressure pump until the target pressure was reached. Meanwhile, the temperature control switch was adjusted to set the temperature to 23 °C. The target sample inside the device is degassed. After 3 hours, the valve was opened so the gas can get into generator 1. When the pressure in generator 1 was stable, the target sample in generator 2 was loaded to target pressure. The pressure sensor inside the chamber (accurate to 0.05 MPa) recorded the internal gas pressure every 10 seconds. We can then calculate the nitrogen adsorption capacity at any time point in the process of the pressure dropping using Boyle’s law. The data processing system was used to monitor the falling pressure (volume) as a function of time (to a precision of 10 s) in order to quantify the nitrogen adsorption process. Experiments were carried out using different initial pressures so the adsorption of nitrogen by the coal samples was obtained for a variety of different pressures.
-
Adsorption of nitrogen using coal with different moisture content: A coal sample was selected and soaked in water. The moisture content was roughly set by controlling the soaking time, but the exact moisture content was determined according to sample weight. A target sample was soaked in distilled water for 48 hours. After this time, the sample was weighed every 1 hour and weighing continued until it changed by less than 0.001 g on 3 consecutive weighings. Thus, the coal sample could be taken to be saturated. To make coal samples that are less than saturated, we started from saturated ones. These were allowed to dry out and weighed every 3 hours. Once the moisture content reached the target value, the adsorption experiment was carried out. The experimental steps involved are the same as in Step (1) above. Thus, the adsorption of nitrogen by coal samples containing different moisture content could be determined. When the volumetric method is used for the adsorption experiment, the pressure drop of the sample tank within 60 min is not more than 0.02 MPa, and it is considered to reach the adsorption equilibrium state.
EXPERIMENTAL RESULTS AND ANALYSIS
COMPARISON OF DIFFERENT ADSORPTION MODELS
Adsorption isotherm studies
Langmuir theory (Langmuir 1918LANGMUIR I. 1918. The adsorption of gases on plane surface of glasses. J Am Chem Soc 40: 1361-1403.), Freundlich theory (Freundlich 1906FREUNDLICH MF. 1906. Over the adsorption in solution. J Phys Chem 57: 385-470.) and BET multi-layer adsorption theory (Tian 2015TIAN YY. 2015. Research on shale adsorption isotherm. Chengdu University of Technology.) are nonlinear models for studying gas equilibrium isotherm adsorption. The fitness of the model is determined by determining a non-linear coefficient (R2).
Langmuir isotherm is expressed as follows:
Where p is the gas pressure, V is the volume of the adsorbed gas, VL is maximum adsorption capacity, and pL is pressure at 50% of the maximum adsorption capacity.
The Freundlich model is an empirical formula in which the adsorption process changes directly with pressure until equilibrium pressure is reached. This model is only suitable for use in low pressure gas environments and is not suitable for high pressure gas environments. The Freundlich model is expressed as follows:
Where V represents the amount of gas adsorbed, Kbrepresents the binding constant, p represents the gas pressure, and n represents the model parameter, which is related to temperature and coal pore distribution.
The BET multi-layer adsorption theory is based on the Langmuir single-layer adsorption theory, and it is believed that multi-layer adsorption can also occur on the first layer of adsorbed molecules. This theory is mostly applicable to the adsorption of solid porous materials. The BET equation is expressed as follows:
Where: V represents the total volume of adsorption (balanced pressure is p), Vm represents the volume of adsorbent vacancies on the surface of the adsorbent filled with the required adsorbate, p represents equilibrium pressure, ps represents saturated vapor pressure, and C represents constant associated with adsorption.
Adsorption kinetics and mechanism
There are many kinetic models that can be used to describe the adsorption of gas by coal. In this article, three of these models are considered: (i) the pseudo-first order kinetic model, (ii) the pseudo-second order kinetic model, and (iii) the opposite process adsorption model – the models are compared and applied to the data to see which gives the better fit to the behavior observed (Wang et al. 2015WANG HH, LIU YS and LI ZY. 2015. Kinetic models and numerical simulation of SO2 adsorption on activated carbon. Journal of China Coal Society 40(1): 203-211., Suganya and Senthil 2018aSUGANYA S and SENTHIL KP. 2018a. Influence of ultrasonic waves on preparation of active carbon from coffee waste for the reclamation of effluents containing Cr(VI) ions. J Ind Eng Chem 60: 418-430., bSUGANYA S and SENTHIL KP. 2018b. Kinetic and thermodynamic analysis for the redemption of effluents containing Solochrome Black T onto powdered activated carbon: A validation of new solid-liquid phase equilibrium model. J Mol Liq 259: 88-101., Ponnusamy et al. 2018PONNUSAMY SK, SUNITA JV and SUBBURAJ S. 2018. Treatment of dye wastewater using an ultrasonic aided nanoparticle stacked activated carbon: Kinetic and isotherm modelling. Bioresour Technol 250: 716-722., Aditya et al. 2018ADITYA RK, SRNTHIL KP, EMMANUEL DR, DANIEL DG and MARK EZ. 2018. Pecan shell based act vated carbon for removal of iron (II) from fracking wastewater: Adsorption kinetics, isotherm and thermodynamic studies. Process Saf Environ 114: 107-122., Saravanan et al. 2018, Suganya et al. 2017SUGANYA S, SENTHIL KP, SARAVANAN A, SUNDAR RP and RAVIKUMAR C. 2017. Computation of adsorption parameters for the removal of dye from wastewater by microwave assisted sawdust: Theoretical and experimental analysis. Environ Toxicol Pharmacol 50: 45-57., Gunasundari and Senthil 2017GUNASUNDARI E and SENTHIL KP. 2017. Adsorption isotherm, kinetics and thermodynamic analysis of Cu(II) ions onto the dried algal biomass (Spirulina platensis). J Ind Eng Chem 56: 129-144., Gerard et al. 2015GERARD N, SANTHANA K, SENTHIL KP, KALIYUR RS and VINOTH KV. 2015. Performance study on sequestration of copper ions from contaminated water using newly synthesized high effective chitosan coated magnetic nanoparticles. J Mol Liq 214: 335-346., Nithya et al. 2018NITHYA K, ASHA S, SENTHIL KP and RAMACHANDRAN T. 2018. Fast kinetics and high adsorption capacity of green extract capped superparamagnetic iron oxide nanoparticles for the adsorption of Ni(II)ions. J Ind Eng Chem 59: 230-241., Senthil et al. 2018SENTHIL KP, SIVARANJANEE R, SUNDAR RP and SARAVANAN A. 2018. Carbon sphere: Synthesis, characterization and elimination of toxic Cr(VI) ions from aquatic system. J Ind Eng Chem 60: 307-320.).
The pseudo-first order adsorption kinetic model:
Lagergren’s pseudo-first order adsorption kinetic model can be expressed thus:
where and correspond to the amount adsorbed (g/g) at time tand at equilibrium, respectively, and k 1is the pseudo-first order adsorption constant (min–1).
The pseudo-second order adsorption kinetic model:
where and correspond to the amount adsorbed (g/g) at time tand at equilibrium, respectively, and k 2is the pseudo-first order adsorption constant (min–1).
Opposite process adsorption model:
The process by which coal absorbs gas is dynamic. That is, adsorption and desorption do not occur on their own — they both happen at the same time. The net adsorption or desorption behavior is a macroscopic characterization that reflects the difference between the absolute adsorption rate and absolute desorption rate (on the microscopic level). The leads to a process of ‘process confrontation’:
where Va is the absolute adsorption rate, Vd the absolute desorption rate, and Vad the relative adsorption rate.
When Vad > 0, there is net adsorption. Similarly, Vad < 0, reflects net desorption and a zero value means that the absolute adsorption and absolute desorption rates are the same, i.e. the system has reached dynamic equilibrium.
The adsorption and desorption process applied to coal and nitrogen can be expressed by the opposite process, namely:
where A(g) represents nitrogen in the gas phase, A(a) nitrogen in the adsorbed phase,n0 is the total amount of gas (with none adsorbed), nt is the amount adsorbed by the adsorbent at time t, andne is equilibrium adsorption capacity at that pressure.
Adsorption and desorption rates (according to Langmuir) do not just depend on the surface adsorption coverage rate. Rather, they are also proportional to the pressure. The adsorption rate of the nitrogen can be expressed as follows:
where Ka is the absolute adsorption rate constant, Kd the desorption rate constant, and t is adsorption time.
When the adsorption rate is equal to desorption rate, we have:
Taking Eq. (9) from Eq. (8) gives:
It can be found from the formula above that the rate of change of adsorption capacity with time is proportional to the difference between the amount of adsorption and the amount of equilibrium adsorption in the adsorption process. If, that is, is the relative adsorption rate of the adsorption kinetics which is related to the pressure used in the adsorption process, then, Eq. (10) can be rewritten as:
If both sides of the equation are divided by the equilibrium adsorption capacity, ne, we find:
Hypothesis:
Then, Eq. (9) implies that:
According to the relationship between the downwardly moving pressure and time corresponding to different initial pressures, the data can be fitted to the nonlinear equation:
where a, b, and care constants which depend on the initial pressure.
According to Eqs. (13)–(15), can be found such that:
Where is a constant.
It can be seen from formula (11) that under constant temperature conditions, given a block of primary structural coal, the parameters affecting its adsorption capacity have values of k(intrinsic factors: pore size, water content, etc.) and pressure P (external factors). The k value reflects to some extent a block-like pore and crack distribution, and thek value is inversely proportional to the pressure P. To verify the relationship between the k value and the pressure P, the following experiment was performed.
ANALYSIS OF THE EXPERIMENTAL RESULTS
Adsorption rates for a dry sample under different initial pressures
Experiments were carried out in which the nitrogen that was absorbed by the coal had an initial pressure of 0.7, 1.2, 1.7, 2.2, 2.7, 3.2, and 3.7 MPa. The ways in which the pressure changed with time are shown in Fig. S1 (Supplementary Material). SUPPLEMENTARY MATERIAL Figure S2 - Curves showing the fitting of the data to the dynamic equations for different initial pressures. Figure S3 - The variation of the pressure with time for coal with different moisture content. Figure S4 - Adsorption dynamics curves at different water cuts. Figure S5 - Comparison of nonlinear correlation coefficients (R2).
According to the formulas (1)-(3), the isothermal adsorption models of the adsorbed nitrogen of the native structural coal in the dry state were compared according to the six sets of pressure gradients in Fig. 4. Take the pressure of 1.7MPa as an example. The comparison results are shown in the following Table II.
Isothermal adsorption model comparison (Where VLis maximum adsorption capacity, and PL is pressure at 50% of the maximum adsorption capacity, Kbrepresents the binding constant, p represents the gas pressure).

Using the experimental results, the constants required to fit the data to Eq. (16) were found. The resulting rate constants are shown in Table III.
Adsorption rate constants for dry coal under different initial pressures (R2 is the correlation coefficient, the closer the coefficient is to 1, indicating that the stronger the correlation, the higher the degree of fit).
The adsorption data for three different initial pressures were selected and fitted to the pseudo-first order and opposite process adsorption kinetic equations. The fitting curves are shown in Fig. S2.
Comparing the fitting results, the opposite process adsorption kinetic equation can be seen to give a better fit which means this model is a better reflection of the adsorption kinetics of the coal. The fitting parameters are further contrasted in Table IV.
Dry the parameters of the three kinetic equations (Where qt and qe correspond to the amount adsorbed at time t and at equilibrium, respectively, and k2 is the pseudo-first order adsorption constant where a,b, and c are constants which depend on the initial pressure. R2 is the correlation coefficient, the closer the coefficient is to 1, indicating that the stronger the correlation, the higher the degree of fit).
Adsorption rates for different moisture content
Experiments were carried out to investigate the adsorption of nitrogen by coal with a moisture content of 2.894%, 1.871%, and 0.897%. The changes in the gas pressure with time are shown in Fig. S3.
As before, using the experimental data and Eq. (16), the constants required to fit the coal data were found. The resulting rate constants are shown in Tables V, VI and VII.
Similarly, using the formulas (4)-(16), the kinetic equations can be fitted to coal samples with different water contents, see Fig. S4.
Combined with Fig. S2 and Fig. S4, the pseudo-first order adsorption kinetic model, the pseudo-second order adsorption kinetic model and opposite process adsorption models for the coal samples with different water contents are fitted. The non-linear coefficient (R2) of the three kinetic equations are shown in Fig. S5.
It can be seen from Fig. S5 that the nonlinear correlation coefficients (R2) of the three kinetic equations are different. The pseudo-first order adsorption kinetic model is between 0.71 and 0.98, and the pseudo-first order adsorption kinetic model is between 0.89 and 0.98. The opposite process adsorption models is between 0.98 and 0.99. It can be concluded that opposite process adsorption model constructed in this paper are more consistent with the adsorption characteristics of the original structural coal.
Thermogravimetric Analysis error correction
Considering that the experimental procedure shown in Fig. 2 was carried out at a constant temperature of 23 °C. Due to the long experimental time, the adsorption process may cause pyrolysis of the surface of the massive coal. This leads to a loss of mass and, to some extent, this process causes a change in the volume of the coal matrix . Since this experiment uses the volumetric method to test the adsorption process, the volume change may affect the experimental results. In order to avoid the negative effect of this process, the TGA-IR thermogravimetric analyzer is used for different masses (initial mass is mg, mg, mg, and mg) were tested. According to the density of the coal matrix, the corresponding volume change is obtained.
The combined test data is shown in Table VIII and Fig. S1. It is found that the mass loss of different quality block coal samples under the constant temperature of 23 °C is between 0.199-0.370 mg. The amount of mass loss is independent of the original mass of the coal sample, and as the pyrolysis time (longer than 120 min) increases, the mass change no longer has a significant difference. According to formula (Where is volume loss, is mass loss, ), the volume reduction caused by mass loss can be estimated to be between 0.000142 and 0.000264 ml. Comparing the volume of the sample tank mL, such errors can be ignored, so the experimental data is reliable.
THE EFFECT OF DIFFERENT FACTORS ON ADSORPTION RATE
The effect of initial pressure on adsorption rate constant
As can be seen from Table III, the value of kbecomes smaller as the initial pressure increases. When the initial pressure is low, there is no pressure in the pores of the coal (the initial pressure is the difference in pressure between the outer space of the coal and the pores of the coal). Gas can easily enter the larger pores of the coal under these circumstances. As the amount of gas going into the pores increases, the internal pressure increases and the pressure in the outer space decreases. The pressure difference between the internal and external spaces therefore decreases. This continues until the pressure difference means it is almost impossible to make more gas enter into the smaller pores.
At this time, the pressure difference between the outer space and the internal pores of the coal remains almost unchanged. If the outer pressure now rises, a pressure difference between the outer space and the pores of the coal is formed and gas can enter into the smaller pores. As the pressure difference needed to make the gas enter the smaller pores is greater, but the maximum pressure difference is almost equal each time, the value of the adsorption rate constant k decreases.
The effect of water content on adsorption rate constant
The variation of the adsorption rate constant with moisture content is shown in Fig. 5. It can be seen from Fig. 5 that for a given initial pressure the adsorption rate constantk decreases as the moisture content increases. This is mainly because the water in the pores of the coal will occupy some of the adsorption sites in the pores. Coal more readily absorbs water under the same temperature and pressure which means that the nitrogen cannot occupy such adsorption sites. Thus, the value of the adsorption rate constant k decreases as does the adsorption capacity.

THE EFFECT OF MOISTURE CONTENT ON TIME
The times for the adsorption process to reach equilibrium in samples with different moisture content are shown in Table IX.
The Table IX shows that the higher the moisture content of the coal sample, the longer the system takes to reach equilibrium for a given initial pressure. This may be due to the competition between the moisture and the gas to become adsorbed in the pores of the coal. On the other hand, the moisture in the pores increases the resistance to the gas and helps stop it from entering the system.
CONCLUSIONS
-
The adsorption kinetics of primary structure coal under different initial pressures and with different moisture content were determined using a homemade coal adsorption gas system. A new adsorption kinetic equation was constructed and the characteristics of the adsorption kinetics were thus revealed with experiments.
-
The adsorption parameter k decreases at higher initial pressures (but same moisture content). However,k tends to a constant value when the initial pressure increases indefinitely. The value of kalso decreases at higher levels of moisture content (for the same initial pressure). As the moisture content of the primary structure coal approaches saturation, kapproaches its minimum value.
-
The observed variation in k reflects the pore size distribution in the coal. In this article, the experimental pressure varied continuously, and the relationship between the adsorption rate constant and pore size was not studied at the different pressures. Moreover, the whole experiment is a constant temperature 23 °C process, so the effect of temperature on the adsorption rate constant is not considered from the thermodynamic point of view. This is the shortcoming of this paper, so this will be my future research direction. Primary structure coal is an important one in nature and so its adsorption characteristics are of some interest. With further research similar to that presented here, the mechanism underlying adsorption by primary structure coal should gradually become apparent.
ACKNOWLEGMENTS
This study was supported by Program for Innovative Research Team in University of Ministry of Education of China (IRT_16R22), the China innovative talents of Henan province science and technology project (15HASTIT050) and the Central Plains Economic Zone of coal seam gas (Ye Yan) Henan Collaborative Innovation Center support.
I am very grateful to Professor Ni Xiaoming for his contribution to the format and language expression of the paper. I also thank Professor Wei Jianping and Yongchao Zhao for their guidance during the experiment.
REFERENCES
- ADITYA RK, SRNTHIL KP, EMMANUEL DR, DANIEL DG and MARK EZ. 2018. Pecan shell based act vated carbon for removal of iron (II) from fracking wastewater: Adsorption kinetics, isotherm and thermodynamic studies. Process Saf Environ 114: 107-122.
- BAI JR,WANG Q and QI H. 2011. Kinetics and thermodynamics of adsorption of heavy metal ions onto fly ash from oil shale. Journal of Fuel Chemistry and Technology 39(5): 378-384.
- DAI JW. 2016. Study on microcosmic mechanism of gas supercritical adsorption in shale nanoparticles. Southwest Petroleum University.
- DO D and RICE R. 1987. On the relative importance of pore and surface diffusion in non-equilibrium adsorption rate processes. Chem Eng Sci 42: 2269-2284.
- DONG Z, ZENG CF, DONG Z, YANG SZ and TING TC. 2017. Experimental study of meso-structural deformation of coal during methane adsorption-desorption cycles. J Nat Gas Sci Eng 42: 243-251.
- FENG ZC, ZHAO D and ZHAO YS. 2009. Experimental study on impact of water ratio to adsorption of limp coal. CJRME 28(S2): 3291-3295.
- FREUNDLICH MF. 1906. Over the adsorption in solution. J Phys Chem 57: 385-470.
- GERARD N, SANTHANA K, SENTHIL KP, KALIYUR RS and VINOTH KV. 2015. Performance study on sequestration of copper ions from contaminated water using newly synthesized high effective chitosan coated magnetic nanoparticles. J Mol Liq 214: 335-346.
- GUNASUNDARI E and SENTHIL KP. 2017. Adsorption isotherm, kinetics and thermodynamic analysis of Cu(II) ions onto the dried algal biomass (Spirulina platensis). J Ind Eng Chem 56: 129-144.
- HAO X, DA ZT, JUN LZ, SONG L and SHU T. 2015. A new laboratory method for accurate measurement of the methane diffusion coefficient and its influencing factors in the coal matrix. Fuel 158: 239-247.
- KANG YL, CHEN YB and LI XC. 2017. Effect of particle size on methane sorption capacity of shale. Natural Gas Geoscience 28(2): 272-279.
- LANGMUIR I. 1918. The adsorption of gases on plane surface of glasses. J Am Chem Soc 40: 1361-1403.
- NITHYA K, ASHA S, SENTHIL KP and RAMACHANDRAN T. 2018. Fast kinetics and high adsorption capacity of green extract capped superparamagnetic iron oxide nanoparticles for the adsorption of Ni(II)ions. J Ind Eng Chem 59: 230-241.
- OU ZP. 2014. Molecular dynamics study of methane diffusion in nanopores. Southwest Petroleum University.
- PAYNE SH and KREUTZER HJ. 1989. Analysis of thermal desorption data. Surf Sci 222: 404-429.
- PONNUSAMY SK, SUNITA JV and SUBBURAJ S. 2018. Treatment of dye wastewater using an ultrasonic aided nanoparticle stacked activated carbon: Kinetic and isotherm modelling. Bioresour Technol 250: 716-722.
- REN SY, LI GX and ZHAO HH. 2015. Research progress of pressure adsorption and concentration of low-concentration CBM technology. Anhui Chemical Engineering 41(2): 1-3.
- SARAVANAN A, SENTHIL KP and ANNAM RA. 2015. Hybrid synthesis of novel material through acid modification followed ultrasonication to improve adsorption capacity for zinc removal. J Clean Prod 172: 92-105.
- SENTHIL KP, SIVARANJANEE R, SUNDAR RP and SARAVANAN A. 2018. Carbon sphere: Synthesis, characterization and elimination of toxic Cr(VI) ions from aquatic system. J Ind Eng Chem 60: 307-320.
- SUGANYA S and SENTHIL KP. 2018a. Influence of ultrasonic waves on preparation of active carbon from coffee waste for the reclamation of effluents containing Cr(VI) ions. J Ind Eng Chem 60: 418-430.
- SUGANYA S and SENTHIL KP. 2018b. Kinetic and thermodynamic analysis for the redemption of effluents containing Solochrome Black T onto powdered activated carbon: A validation of new solid-liquid phase equilibrium model. J Mol Liq 259: 88-101.
- SUGANYA S, SENTHIL KP, SARAVANAN A, SUNDAR RP and RAVIKUMAR C. 2017. Computation of adsorption parameters for the removal of dye from wastewater by microwave assisted sawdust: Theoretical and experimental analysis. Environ Toxicol Pharmacol 50: 45-57.
- TIAN YY. 2015. Research on shale adsorption isotherm. Chengdu University of Technology.
- WANG HH, LIU YS and LI ZY. 2015. Kinetic models and numerical simulation of SO2 adsorption on activated carbon. Journal of China Coal Society 40(1): 203-211.
- WEI Y and KAMY S. 2016. Simulation of gas desorption and geomechanics effects for unconventional gas reservoirs. Fuel 116: 455-464.
- WEI Z, YUAN PC, HAI NJ, HAI FW and WEI L. 2017. Modeling and experiments for transient diffusion coefficients in the desorption of methane through coal powders. Int J Heat Mass Transf 110: 845-854.
- XIAO LL and CAI FW. 2017. Simulation of dynamic changes of methane state based on NMR during coalbed methane output. Fuel: 194: 188-194.
- YA M and ZHI PL. 2016. Experimental study on diffusion property of methane gas in coal and its influencing factors. Fuel 185: 219-228.
- YANG HP. 2014. Study of the adsorption and desorption mechanism of methane in coalbed. Xi’an University of Science and Technology.
- YI SW. 2014. Factors Affecting Gas Diffusion Rates in Coal and Rock Reservoirs and Intensification Methods. Southwest Petroleum University.
- ZHANG ZB, QIU XL and YUAN YQ. 2014. Experimental study on methane adsorption of coal bed from Sihe Mine in Qinshui Basin. Peetroleum Geology \& Experiment X36(5): 656-658.
- ZHAO D. 2012. Study on coalbed methane adsorption \& desorption mechanism influenced by coupling of water injection and temperature. Taiyuan University of Technology.
- ZHAO D, FENG ZC and ZHAO YS. 2014. Effects of liquid water on coalbed methane adsorption characteristics based on the adsorption kinetic theory. Journal of China Coal Society 39(3): 518-523.
- ZHAO JL, TANG DZ and XU H. 2016. Measurement of methane diffusion coefficient and analysis of its influencing factors in coal matrix. Coal Science and Technology 44(10): 77-82.
- ZUO L, HU ZM and CUI YX. 2016. High temperature and pressure methane adsorption characteristics and adsorption kinetics of shale. Journal of China Coal Society 41(8): 2017-2023.
Publication Dates
-
Publication in this collection
02 Sept 2019 -
Date of issue
2019
History
-
Received
04 May 2018 -
Accepted
10 Aug 2018