Abstract
The Hunga Tonga–Hunga/Hunga-Haʻapai eruption on January 15, 2022 sent off a plume of ash material up to the stratosphere and triggered a meteotsunami and barometric pressure pulse that rippled through the atmosphere and oceans all around the world. The nature of the volcanic event and its global impacts on the oceans, atmosphere, lithosphere and the cryosphere are a matter of debate. Here we present a first overview of the time travel of the sound atmospheric pressure wave through the Antarctic continent based on in situ measurements, which represented a unique event observed through the polar ice sheet during the instrumental meteorological era. In addition, we estimated the tsunami travel time of the Hunga-Tonga event from a first order model to infer its impact over the Antarctic Sea ice and ice shelves. One outcome from our observations and modeling is the detection of the meteotsunami in the Antarctic Peninsula and the impact of the continental relief over the atmospheric pressure wave dispersion.
Key words
Antarctica; Hunga-Tonga; Meteotsunami; volcanism
INTRODUCTION
The explosive eruption of the underwater subduction zone volcano Hunga-Tonga/Hunga Ha’apai in Tonga (20.536°S;175.382°W) occurred on January 15, 2022, (around 04:14 UTC) provided unprecedented near real time worldwide observation, from ground-based meteorological stations, tidal level disturbance measurements to satellites-based observations. It allowed us to infer the global immediate impact of a volcanic sonic blast and meteotsunami, their traveling time and velocity around the globe. The volcanic event produced a barometric pressure pulse (atmospheric Lamb waves), which most prominent was the surface-guided Lamb wave (≲0.01 hertz), propagating for four passages around Earth over 6 days (Matoza et al. 2022). Initial estimates from Calipso (Cloud-Aerosol Lidar and Infrared Pathfinder Satellite Observations) satellite imagery suggest that the volcanic ash may have risen from the surface to the lower stratosphere - as much as 30 km or even higher (NOAA - https://www.ngdc.noaa.gov/mgg/global).
One impressive outcome from the Hunga-Tonga volcanic event was the violent and explosive nature of the eruption, generating a sonic blast, an air pressure wave, earthquakes, and a meteotsunami in a single event. The shock wave, inferred by the barometric pressure pulse (ΔSLP), was recorded in several Antarctic stations, research campsites, automatic weather stations (AWS), and oceanographic buoys from the eastern to western continental sides. Since the event, several studies have already been published examining in detail the properties of the eruption-atmospheric waves that crossed the entire globe and also the dual mechanisms of tsunami generation: (a) the initial blast, and (b) by the propagation of atmospheric Lamb waves (eg. Amores et al. 2022, Duncombe 2022, Kulichkov et al. 2022, Lin et al. 2022, Rabinovich et al. 2011, Themens et al. 2022, Zhang et al. 2022), however, none related with their effects on Antarctic ice shelves in except for the recent paper of Liang et al. (2023) that suggested a relation between the meteotsunami of Hunga-Tonga event and the calving observed ate the Drygalski Ice Tongue (75.4°S, 163.6°E), located in VictoriaLand, East Antarctica, on the south side of Terra Nova Bay (Li et al. 2016).
Historical associations between earthquake-tsunami and ice shelves breaking in Antarctica were previously described as the event of the Tohoku earthquake of 11 March 2011 in Japan that triggered a tsunami that propagated to Antarctica within 18-22 hours (Brunt et al. 2011). In that case, the National Oceanic and Atmospheric Administration (NOAA) Center for Tsunami Research, from the Pacific Marine Environmental Laboratory (PMEL) predicted a tsunami amplitude of 0.20-0.30 m in the Southern Ocean. A second example is the Ross Ice Shelf response to the 16 September 2015 Chilean earthquake tsunami recorded by a broadband seismic array (Bromirski et al. 2017). They observed an induced flexural-gravity wave propagation from the front to the deep interior of the ice shelf at gravity wave speeds of 70 m/s. However, meteotsunamis as the one generated following the Hunga-Tonga event differs from classic tsunamis by the triggering processes, commonly associated with atmospheric disturbances such as gravity waves and convective systems (Monserrat et al. 2006, Vilibić et al. 2020, Jansà & Ramis 2021). Meteotsunamis are high frequency Sea Level Oscillations (SLOs) with spectral energy in the same frequency band as tsunamis that need a considerable barometric change and some physical mechanism such as some kinds of resonance to amplify the sea level response, and to reach hazardous oscillation amplitudes at the coast (Villalonga et al. 2023). Only two events of a meteotsunami with a global dimension have been reported, one following the Krakatoa volcano eruption, in 1883, and the recent one after the Hunga Tonga–Hunga Ha’apai volcano eruption in January, 2022.
Considering the actual unstable conditions of many of marine ice sheets around Antarctica (Robel et al. 2019) and a historical timeline of past tsunamis´s impacts over sea ice, ice shelves and calving events in Antarctica, this work aims at: (1) surveying the time travel of the barometric pressure pulse/shock wave through the Antarctic continent based on in situ measurements; (2) investigate the correlation between high energy events such as the Hunga-Tonga blast and meteotsunami, and their influence on the ice-shelf breakup dynamics in Antarctic Peninsula.
MATERIALS AND METHODS
Atmospheric pressure data
Atmospheric pressure dataset was provided by a network of Antarctic meteorological groups from Brazil, Italy, Australia, Chile, USA, German, New Zealand, and the UK that covered the coast of Antarctica from east to west. Dataset was surveyed a few weeks after the volcanic event. Table I summarizes locations and values of ΔSLP, that represents the amplitude of change in sea level pressure when the shock wave reaches a measuring site. A few data were constrained by the time resolution of automatic weather stations (AWS) data acquisition systems.
Summary of Antarctic stations data measurements for sea level pressure variations recorded just after the Hunga-Tonga eruption/explosion on January 15, 2022.
Air pressure shock wave travel was constructed from the Delaunay Triangulation method implemented at the Thin Plate Spline (TIN) interpolation algorithm on SAGA 7.8.2/QGIS 3.22.8 (cell size: 5.000; regularization: 0,0001; neighborhood: level 1). Additional data from seven New Zealand Weather Stations (Cape Reinga, Norfolk Island, Auckland, Tauranga, Taupo, Gisborne, and Wellington), seven Australian Weather Stations (Brisbane, Sydney, Melbourne, Broken Hill, Coober Pedy, Kalgoorlie, and Perth), were added to the Antarctic database in order to better detail the barometric pressure pulse/wave shock migration from Tonga to Antarctica.
Two additional Antarctic meteorological stations (Amundsen-Scott Station/USA -https://amrc.ssec.wisc.edu/data/ftp/pub/southpole/surface_observations/2022/0122.sfc and Comandante Ferraz Station at King George Island (Meteo-station EACF 1891 - http://vitral.inmet.gov.br/) were used to validate the time travel lines from model output. At those stations, the start of ΔSLP pulses occurred at 12:00h UTC and 12:30h UTC, respectively.
Wave Height Data
Tsunami data for several global locations were immediately released after the eruption by local governmental agencies in alarm systems. The peak amplitude at the Antarctic coast was estimated at 30 cm based on limited gauge data from the Antarctic Peninsula and Ross Sea (https://www.ioc-sealevelmonitoring.org/). Herein data of wave height were gathered in a global map with Antarctica in the center. A first order numerical simulation for tsunami travel time, TTT, was performed using MIRONE, a tsunami modeling software (an open source code written in MATLAB) developed based on the nonlinear shallow water theory (Luis 2007). A map representation of the tsunami time travel (TTT) was generated from ArcGIS/ESRI. We estimated the first tsunami wave propagation into Antarctica based on the equation 1:
where D is the distance, T is time, g is gravity acceleration and the water column depth is Z . Water column depth was obtained from ETOPO1 Global Relief Model from NOAA1.
Additional data from a mooring wave buoy deployed near Penguin Island at South Shetland Islands (Antarctica) were also analyzed. This deployment belongs to the observational activities developed as part of the Antarctic Modeling Observation System (ATMOS) project which studies the interactions and turbulent fluxes exchanges on the sea ice–ocean–atmosphere–waves interface, at micro/mesoscales in the Atlantic sector of the Southern Ocean. The moored wave buoy was deployed in November 2021 and recovered by February 2022 off the coast of Penguin Island (61.4°S,52.3°W) following Voermans et al. (2021). The water depth at the site of deployment is approximately 60-70 m.
Ice dynamics survey in Antarctic Peninsula
To evaluate the ice dynamics at the Antarctic Peninsula during the Hunga-Tonga event, we used a series of European Space Agency (ESA) SENTINEL-1 C-band Synthetic Aperture Radar (SAR) images between January 16-28, 2022 (https://scihub.copernicus.eu/dhus/#/home). Initial processing was carried out using ESA’s Sentinel Application Platform (SNAP) software where the images were geometrically corrected and the sigma lee algorithm (Lee et al. 2009) was applied for the removal of granular noise (speckle).
RESULTS AND DISCUSSION
The atmospheric pressure wave detection across Antarctica
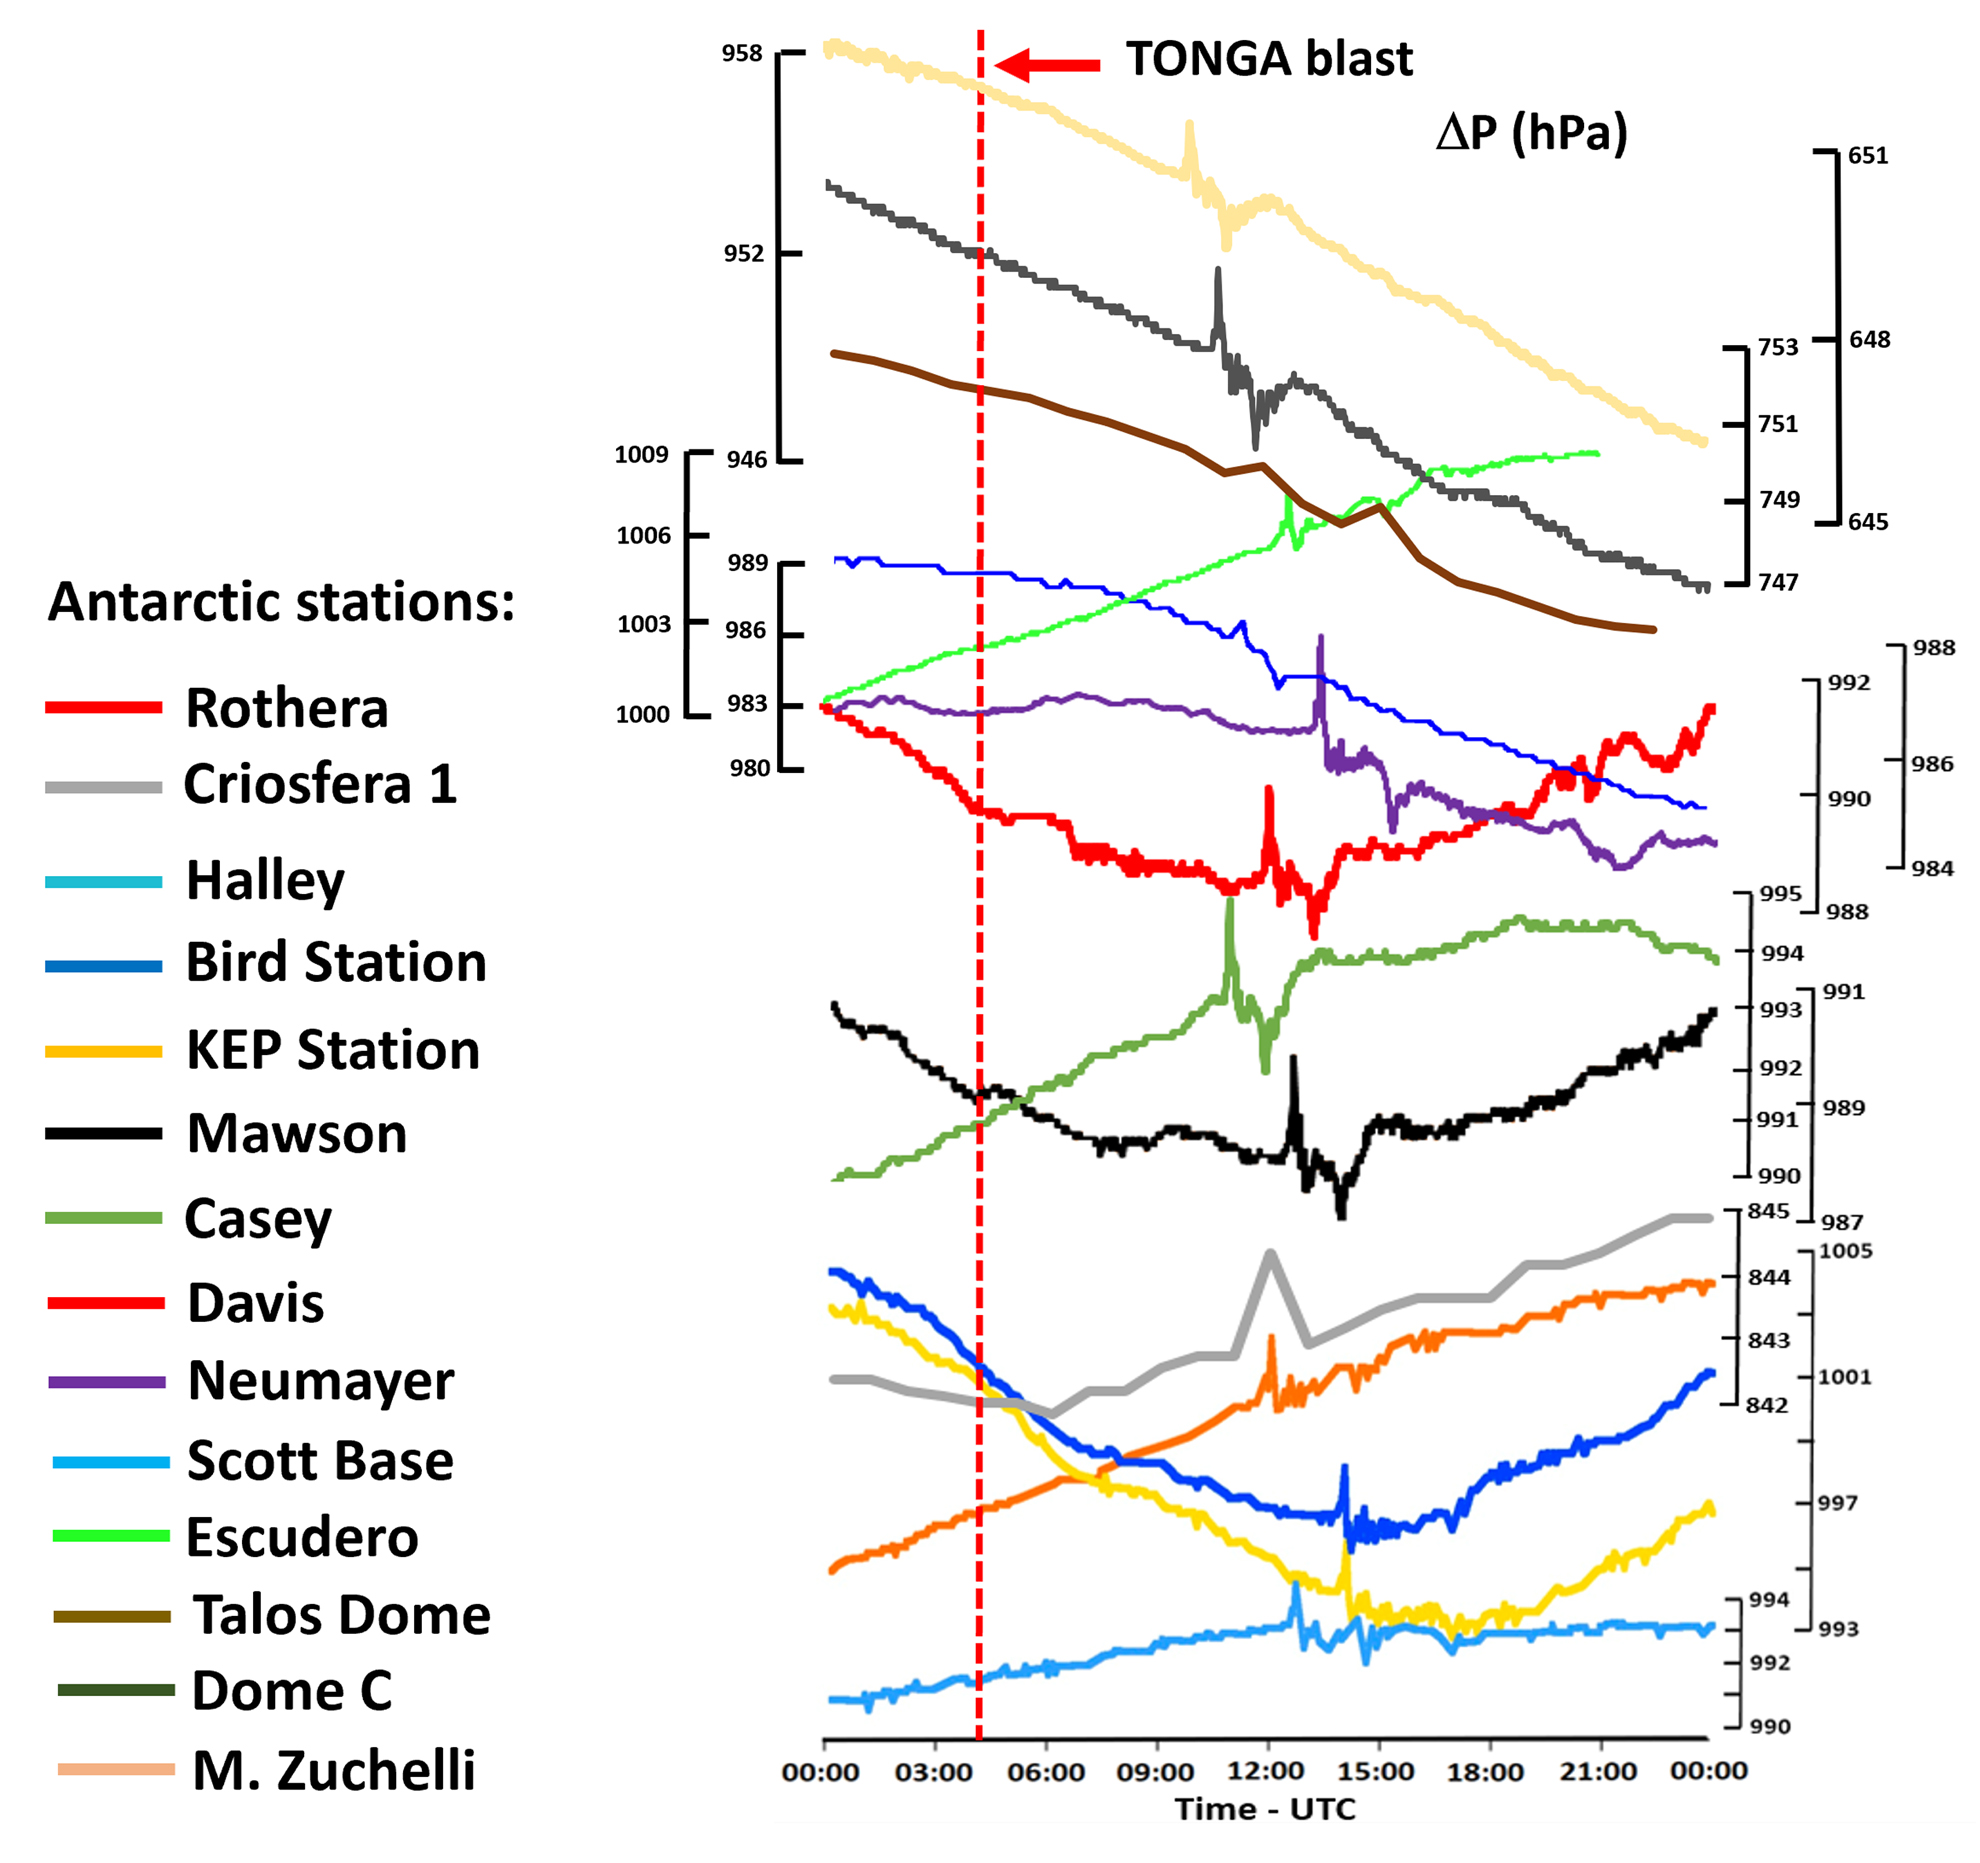
Abrupt ΔSLP changes in measurements at several Antarctic stations varied from 0.8 to 3.1 hPa (Figures 1 and 2), with duration of 3 hours. From our survey, the first ΔSLP abrupt change reported in Antarctica occurred at the Italian base of Mario Zuchelli Station at 9:56 UTC. This station also recorded the highest ΔSLP value of 3.1 hPa. The atmospheric pressure wave traveled all along the Antarctic continent and surrounding Southern Ocean and reached South Georgia Island at 14:00 UTC. As a whole, the air pressure returned to its initial pattern around 17:00h UTC (Figure 3).

Map of the 14 Antarctic stations locations together with Hunga-Tonga-Hunga Ha’apai position and four reference stations located nearby the event.

The Hunga-Tonga volcanic blast and the barometric pressure pulses measured in 14 Antarctic stations during January 15, 2022.

Hunga-Tonga atmospheric pressure wave propagation modeling from the event site through the Antarctic continent based on the air pressure variability measured in 28 weather/research stations/camps. Time in UTC. Legend. Time in second from the eruption time Tzero (To).
Considering some reference sites closer to the Hunga-Tonga volcanic event, and from our surveyed stations, ΔSLP steadily decreased from values > 5.0 hPa in Australia to around 3.0 to 5.0 hPa at Norfolk Island. A reduction in the magnitude occurred towards the Southern Ocean until the wave reached the Antarctic coast at Victoria-George V-Terre Adélie-Wilkes Land (Figure 3). In Antarctica it decreased from 3.1 hPa at Mario Zuchelli Station to 2.5 hPa at Halley Station. This decrease depends on various parameters, e.g. air temperature, wind direction and intensity, frictions with surfaces of the ocean and ice, and geomorphology.
Our resultant model for the atmospheric pressure wave propagation based on the in situ ground-based measurements shown in Table I suggests an interaction between the air pressure wave with the underlying terrain geomorphology as can be observed by the deflection seemingly caused by the Australian coast/continent as well as the line compressions observed when the waves train reached the Transantarctic Mountains (Figure 3). Along the Antarctic ice sheet, East Antarctic experienced a smoother wave propagation while at the West Antarctic we observed a speedup process. We should also point that since the energy transported by a wave depends linearly on its velocity, the West Antarctic ice sheet is supposed to be more effectively impacted, especially at its glacier’s terminus part.
Considering wave amplitude data from global oceans (Figure 4), we estimated that amplitudes at West Antarctica and the Pacific sector of East Antarctica would have varied between 0.5 and 1.0 m based on data from ATMOS buoy and based on gauge data from the Antarctic Peninsula and Ross Sea (https://www.ioc-sealevelmonitoring.org). It is important to highlight that despite the apparent low wave amplitudes, tsunamis have very long wave periods and can cause severe damages when reaching coastal regions. Another point is that very long tsunami waves tend to lose little of their energy as they migrate from the source point to coastlines causing greater run-up than common storm waves (Bryant 2008).

A summary report of tsunami wave height related to the Hunga-Tonga event on January 15, 2022. Arrow indicates ATMOS wave buoy site and the blue and yellow squares are the closest meteorological stations.
Our Hunga-Tonga tsunami model for the Southern Ocean (Figure 5), suggests a relationship between the wave time travel and the regional seafloor geomorphology and continental mainland.

(a) Seafloor geomorphic features around Antarctica; (b) Hunga-Tonga tsunami time travel to Antarctica. Numbers represent hours after the event.
Figure 4a clearly shows that the Southern Indian Ocean sector between longitudes 0o – 180o greatly differ from the Southern Pacific Ocean sector between longitudes 180o – 100oW, being the Pacific sector characterized by an open ocean region with smoother seafloor roughness, changing from 4,900 m to 3,700m (Harris et al. 2014). This way tsunamis generated from the active Eastern Pacific volcanism would potentially strike the West Antarctica sea ice and coastal ice at the Amundsen and Bellingshausen seas. From our estimates, the Hunga-Tonga meteotsunami would have reached the complete West Antarctic coast between 9 and 18 hours after the event.
Can Hunga-Tonga meteotsunamis induce ice-shelf breakups in the Antarctic Peninsula?
For the Antarctic Peninsula region, we have evidence that the Hunga-Tonga’s blast signal was responsible for a meteotsunami event characterized by a rapid change in wave height (h), observed from the ATMOS Project wave buoy data (Figure 5), synchronous to the atmospheric blast signal observed at the nearby ‘Professor Julio Escudero’ (Chilean Antarctic Station) and the ‘Comandante Ferraz’ (Brazilian Antarctic Station). The ATMOS wave buoy was anchored in the coastal waters of Penguin Island, and its oceanic data showed wave height decreasing since January 13, 2022. A sudden increase in wave height was observed two days later, on the event day (January 15, 2022) with a registered wave peak of 1.7 m in height at about 13:00 UTC. This date and time agree with the local ΔSLP recorded at this location (Figure 6). After this peak, the wave buoy continued to register the dropping in the significant height of the waves in that region, showing that the ocean surface continued to respond to the synoptic atmospheric conditions prevailing in that period.

Atmospheric and ATMOS oceanic buoy data in UTC in Northern Antarctic Peninsula following the Hunga-Tonga event on January 15, 2022.
The tsunami amplitudes recorded at ocean gauges did not attenuate as rapidly with distance from the volcano as typically seen with other tsunami sources (Gusman et al. 2022), and the ocean signal was observed worldwide (Carvajal et al. 2022). This was due to the continuous excitation of the tsunami as the air-wave propagated across the ocean, resulting in a global-scale tsunami (Gusman et al. 2022, Omira et al. 2022, Lynett et al. 2022). The last such event occurred in 1883 during the Krakatoa eruption (Self & Rampino 1981).
In current literature, the relation between ice mass losses and ocean wave power were earlier reported in Antarctica. In September 2019, Amery Ice Shelf shed a massive iceberg that represented the largest calving in half a century (Francis et al. 2021). Based on their ice monitoring, the calving occurred roughly a decade earlier than expected and was attributed to anomalously deep and stationary explosive twin polar cyclones which accelerated the ice shelf breakdown. In the Antarctic region, although the estimates are more uncertain due to a low cover of in situ tide gauge observation, damages related to the Hunga-Tonga waves have been reported by New Zealand, USA in California, Japan, Fiji Islands and Peru. However, a few days after the Hunga-Tonga event, the National Aeronautics and Space Administration (NASA) made a released showing that the Moderate Resolution Imaging Spectroradiometer (MODIS) on NASA’s Terra and Aqua satellites acquired images depicting an important ice shelf break up at the remnant of the Larsen B Ice Shelf in the Northern Easters Antarctic Peninsula (https://earthobservatory.nasa.gov). They showed the embayment on January 16, 2022, and a comparison with January 26, 2022.
Since December 2021 the National Snow and Ice Data Center (NSIDC) has been detecting numerous melt ponds on the land fast sea ice adjacent to the Larsen Ice Shelf which they attributed to wind storms and advecting warm air masses towards the Northern Antarctic Peninsula. According to the NSIDC, the 2021-2022 austral summer melt extent at that region far surpassed the mean melt extent for the period 1990-2020.
Our survey from the SENTINEL-1 Synthetic Aperture Radar (SAR) indicates that sea ice in the Larsen B embayment fractures during the summer of 2022, between January 16-21, starting one day after the Hunga-Tonga event of January 15, 2022, and totally collapsed around January 26-28 (Figure 7). Although this sea ice collapse was initially attributed to an ongoing melting condition at Larsen B, we believe this timelapse coincidence should be mentioned herein.

Antarctic Peninsula map and SENTINEL-1 Synthetic Aperture Radar (SAR) images at Larsen B land fast ice in January, 2022, since 1 day after Hunga-Tonga volcanic event.
Depending on season, summer or winter, where the sea ice development can act damping swell energy that could potentially cause ice-shelf breakup and calving events, in conditions with sufficient energy and appropriate frequency band, ocean swells could resonantly excite flexural gravity waves in the floating ice oversea (Holdsworth & Glynn 1978, Brunt et al. 2011). Additionally, while no significant correlation between environmental factors such as atmospheric temperature, winds, and sea ice, and rift propagation on Antarctic ice shelves was allegedly found, recent results suggest that rift propagation rates on ice-shelf breakup and calving events tend to increase after the arrival of tsunamis (Walker et al. 2013, Liang et al. 2023).
Finally, we should observe that a time based perspective on these large volcanic explosive events is crucial, especially considering the fast changes observed on the Antarctic ice sheet and their proximity to highly active areas such as southeast Asia/Pacific, with a highly active historical record with one large VEI 4 (Volcanic Explosivity Index) eruption every 14 years in the case of Indonesia; one in 25 years for Papua New Guinea, and one every 37 years for Vanuatu (Simpson et al. 2011).
CONCLUSIONS
Based on barometric pressure and wave height data gathered from several weather/research stations/camps and wave buoys, we were able to model the atmospheric pressure wave propagation of the Hunga-Tonga event across Antarctica on January 15, 2022.
Although it is not possible to establish a direct causal relationship between sea ice break up at Larsen B and Hunga-Tonga event, it has been demonstrated from stochastic perturbation theory that the marine ice sheet instability may greatly amplify and skew uncertainty in ice-shelf breakup and calving (Robel et al. 2019), with several modeling studies using both idealized and realistic geometries (Hoffman et al. 2019, Robel et al. 2019, Christian at al. 2022, Felikson et al. 2022, Sergienko & Haseloff 2023) suggesting that stochastic variability in the climate forcing parameters have strong effects on the long-term dynamics of the ice sheet grounding lines and overall instability. Therefore, in a scenario of more than 1,350 active volcanoes around the world, many of them at the Pacific Ring of Fire, meteotsunamis induced by volcanic events that could really impact the Antarctic regions should be, at least, regarded as plausible.
ACKNOWLEDGMENTS
We thank the Brazilian Ministério da Ciência, Tecnologia e Inovação (MCTI), the Brazilian Antarctic Program (PROANTAR) for sponsoring INCT-Criosfera and ATMOS projects that provided logistics at Central Antarctica and developed studies at Southern Ocean. This research was funded by the Brazilian agency Conselho Nacional de Desenvolvimento Científico e Tecnológico (CNPq) through the following projects: CNPq 704222/2009 INCT da Criosfera; Antarctic Modeling and Observation System (CNPq/PROANTAR 443013/2018-7); Heitor Evangelista is partly funded through a CNPq Scientific Productivity Fellowship and FAPERJ (“Cientista do Nosso Estado” Program); Luciano P. Pezzi is partly funded through a CNPq Scientific Productivity Fellowship (CNPq/304858/2019-6); PH’s contribution was funded under the Australian Government’s Antarctic Science Collaboration Initiative program, and contributes to Project 6 of the Australian Antarctic Program Partnership (ASCI000002). PH acknowledges support through the Australian Antarctic Science Projects 4506, and the International Space Science Institute (Bern, Switzerland) project #405. Cesar Amaral is funded by FAPERJ (“Jovem Cientista do Nosso Estado” Program). We thank Ms. Roberta Priori for providing figures designs and Mr. Steve Colwell – BAS who provided additional meteorological metadata.
REFERENCES
-
AMORES A, MONSERRAT S, MARCOS M, ARGÜESO D, VILLALONGA J, JORDÀ G & GOMIS D. 2022. Numerical simulation of atmospheric Lamb waves generated by the 2022 Hunga-Tonga volcanic eruption. Geoph Res Let 49: e2022GL098240. https://doi.org/10.1029/2022GL098240.
» https://doi.org/10.1029/2022GL098240 -
BROMIRSKI PD, CHEN Z, STEPHEN RA, GERSTOFT P, ARCAS D, DIEZ A, ASTER RC, WIENS DA & NYBLADE A. 2017. Tsunami and infragravity waves impacting Antarctic ice shelves. J Geophys Res Oceans 122: 5786-5801. https://doi.org/10.1002/2017JC012913.
» https://doi.org/10.1002/2017JC012913 - BRUNT KM, OKAL EA & MACAYEAL DR. 2011. Antarctic ice-shelf calving triggered by the Honshu (Japan) earthquake and tsunami, March 2011. J Glacio 205: 785-788.
- BRYANT E. 2008. Tsunami: The Underrated Hazard. Springer Praxis Books. Springer Berlin Heidelberg.
-
CARVAJAL M, SEPÚLVEDA I, GUBLER A & GARREAUD R. 2022. Worldwide signature of the 2022 Tonga volcanic tsunami. Geophys Res Let 49: e2022GL098153. https://doi.org/10.1029/2022GL098153.
» https://doi.org/10.1029/2022GL098153 -
CHRISTIAN JE, ROBEL AA & CATANIA G. 2022. A probabilistic framework for quantifying the role of anthropogenic climate change in marine-terminating glacier retreats. The Cryosphere 16(7): 2725-2743. https://doi.org/10.5194/tc-16-2725-2022
» https://doi.org/10.5194/tc-16-2725-2022 -
DUNCOMBE J. 2022. The surprising reach of Tonga’s giant atmospheric waves. Eos 103: https://doi.org/10.1029/2022EO220050. Published on January 21, 2022.
» https://doi.org/10.1029/2022EO220050 -
FELIKSON D, NOWICKI S, NIAS I, MORLIGHEM M & SEROUSSI H. 2022. Seasonal tidewater glacier terminus oscillations bias multi-decadal projections of ice mass change. J Geophys Res Earth Surface 127(2): e2021JF006249. https://doi.org/10.1029/2021JF006249.
» https://doi.org/10.1029/2021JF006249 -
FRANCIS D, MATTINGLY KS, LHERMITTE S, TEMIMI M & HEIL P. 2021. Atmospheric extremes caused high oceanward sea surface slope triggering the biggest calving event in more than 50 years at the Amery Ice Shelf. The Cryosp 15: 2147-2165. https://doi.org/10.5194/tc-15-2147-2021.
» https://doi.org/10.5194/tc-15-2147-2021 -
GUSMAN AR ET AL. 2022. The 2022 Hunga Tonga-Hunga Ha’apai Volcano Air-Wave Generated Tsunami. Pure Appl Geophys 179: 3511-3525. https://doi.org/10.1007/s00024-022-03154-1.
» https://doi.org/10.1007/s00024-022-03154-1 -
HARRIS PT, MACMILLAN-LAWLER M, RUPP J & BAKER EK. 2014. Geomorphology of the oceans. Mar Geol 352: 4-24. https://doi.org/10.1016/j.margeo.2014.01.011.
» https://doi.org/10.1016/j.margeo.2014.01.011 - HOFFMAN MJ, ASAY-DAVIS X, PRICE SF, FYKE J & PEREGO M. 2019. Effect of subshelf melt variability on sea level rise contribution from Thwaites glacier, Antarctica. J Geoph Res: Earth Surface 124(12): e2019JF005155.
- HOLDSWORTH G & GLYNN JE. 1978. Iceberg calving from floating glaciers by a vibrating mechanism. Nature 274(5670): 464-466.
- JANSÀ A & RAMIS C. 2021. The Balearic rissaga: From pioneering research to present-day knowledge. Nat Hazards 106: 1269-1297.
-
KULICHKOV SN ET AL. 2022. Acoustic-Gravity Lamb Waves from the Eruption of the Hunga-Tonga-Hunga-Hapai Volcano, Its Energy Release and Impact on Aerosol Concentrations and Tsunami. Pure Appl Geophys 179: 1533-1548. https://doi.org/10.1007/s00024-022-03046-4.
» https://doi.org/10.1007/s00024-022-03046-4 - LEE JS ET AL. 2009. Improved Sigma filter for speckle filtering of SAR imagery. IEEE Trans on Geosc Rem Sens 47(1): 202-213.
- LI T ET AL. 2016. Iceberg calving from the Antarctic Nansen Ice Shelf in April 2016 and its local impact. Sci Bull 61: 1157-1159.
-
LIANG Q, LI T, HOWAT I, XIAO W, HUI F, CHEN Z, ZHENG L & CHENG X. 2023. Ice tongue calving in Antarctica triggered by the Hunga Tonga volcanic tsunami, January 2022. Sci Bull 68: 456-459. https://doi.org/10.1016/j.scib.2023.02.022.
» https://doi.org/10.1016/j.scib.2023.02.022 -
LIN J ET AL. 2022. Rapid conjugate appearance of the giant ionospheric Lamb wave signatures in the northern hemisphere after Hunga-Tonga volcano eruptions. Geoph Res Let 49: e2022GL098222. https://doi.org/10.1029/2022GL098222.
» https://doi.org/10.1029/2022GL098222 -
LYNETT P ET AL. 2022 Diverse tsunamigenesis triggered by the Hunga Tonga-Hunga Ha’apai eruption. Nature 609: 728-733. https://doi.org/10.1038/s41586-022-05170-6.
» https://doi.org/10.1038/s41586-022-05170-6 - LUIS JF. 2007. Mirone: A multi-purpose tool for exploring grid data. Computers & Geosciences 33: 31-41.
-
MATOZA R ET AL. 2022. Atmospheric waves and global seismoacoustic observations of the January 2022 Hunga eruption, Tonga. Science 377(6601): 95-100. https://doi.org/10.1126/science.abo7063.
» https://doi.org/10.1126/science.abo7063 - MONSERRAT S, VILIBIĆ I & RABINOVICH A. 2006. Meteotsunamis: Atmospherically induced destructive ocean waves in the tsunami frequency band. Nat Hazards Earth Syst Sci 6: 1035-1051.
-
NOBLE TL ET Al. 2020. The Sensitivity of the Antarctic Ice Sheet to a ChangingClimate: Past, Present, and Future. Rev Geoph 58: e2019RG000663. https://doi.org/10.1029/2019RG000663.
» https://doi.org/10.1029/2019RG000663 -
OMIRA R ET AL. 2022. Global Tonga tsunami explained by a fast-moving atmospheric source. Nature 609: 734-740. https://doi.org/10.1038/s41586-022-04926-4.
» https://doi.org/10.1038/s41586-022-04926-4 -
RABINOVICH AB, CANDELLA RN & THOMSON RE. 2011. Energy Decay of the 2004 Sumatra Tsunami in the World Ocean. Pure Appl Geophys 168: 1919-1950. https://doi.org/10.1007/s00024-011-0279-1.
» https://doi.org/10.1007/s00024-011-0279-1 -
ROBEL AA, SEROUSSI H & ROE GH. 2019. Marine ice sheet instability amplifies and skews uncertainty in projections of future sea-level rise. Proc of the Natl Acad Sci 116(30):14887-14892. 201904822. https://doi.org/10.1073/pnas.1904822116.
» https://doi.org/10.1073/pnas.1904822116 - SELF S & RAMPINO MR. 1981. The 1883 eruption of Krakatau. Nature 294: 699-704.
-
SERGIENKO O & HASELOFF M. 2023. ‘Stable’ and ‘unstable’ are not useful descriptions of marine ice sheets in the Earth’s climate system. J Glaciol 69(277):1483-1499. https://doi.org/10.1017/jog.2023.40.
» https://doi.org/10.1017/jog.2023.40 -
SIMPSON A, JOHNSON RW & CUMMINS P. 2011. Volcanic threat in developing countries of the Asia-Pacific region: probabilistic hazard assessment, population risks, and information gaps. Nat Hazards 57: 151-165. https://doi.org/10.1007/s11069-010-9601-y.
» https://doi.org/10.1007/s11069-010-9601-y -
THEMENS DR ET AL. 2022. Global propagation of ionospheric disturbances associated with the 2022 Tonga volcanic eruption. Geoph Res Let 49: e2022GL098158. https://doi.org/10.1029/2022GL098158.
» https://doi.org/10.1029/2022GL098158 -
VILIBIĆ I, DENAMIEL C, ZEMUNIK P & MONSERRAT S. 2020. The mediterranean and black sea meteotsunamis: An overview. Nat Hazards 106: 1223-1267. https://doi.org/10.1007/s11069-020-04306-z.
» https://doi.org/10.1007/s11069-020-04306-z -
VILLALONGA J ET AL. 2023. Observational study of the heterogeneous global meteotsunami generated after the Hunga Tonga-Hunga Ha’apai Volcano eruption. Sci Rep 13: 8649. https://doi.org/10.1038/s41598-023-35800-6.
» https://doi.org/10.1038/s41598-023-35800-6 - VOERMANS J ET AL. 2021. Wave Anomaly Detection in Wave Measurements. J Atmos OceanTech 38: 525-536.
- WALKER CC ET AL. 2013. Structural and environmental controls on Antarctic ice shelf rift propagation inferred from satellite monitoring. J Geophys Res Earth 118: 2354-64.
-
ZHANG S-R ET AL. 2022. 2022 Tonga Volcanic Eruption Induced Global Propagation of Ionospheric Disturbances via Lamb Waves. Front Astron Space Sci 9: 871275. https://doi.org/10.3389/fspas.2022.871275.
» https://doi.org/10.3389/fspas.2022.871275