 Addressing Gearbox Health Monitoring Challenges for Helicopters: A Machine Learning Approach
Abstract
The transmission gearbox of military helicopters, such as the H225M, experiences intense dynamic loads, leading to the detachment of ferromagnetic particles, often due to wear or fatigue. This poses safety risks, as excessive particle detachment demands stringent maintenance. To address this, the study applies machine learning algorithms to predict particle detachment using data from the Flight Data Recorder and Health and Usage Monitoring System. The approach aims to mitigate operational challenges faced by the Brazilian H225M fleet while considering aviation safety criteria and the pre-processing needs for an effective machine learning application.
Key words
Machine Learning; flight safety criteria; helicopter transmission system; Airbus H225M; failure prediction
INTRODUCTION
On April 29, 2016, a fatal accident took place in Norway with an EC 225 LP helicopter, produced by Airbus Helicopters, after an in-flight detachment of the main rotor hub from the main gearbox (MGB) (AIBN 2018). Two months after the accident the European Union Aviation Safety Agency (EASA) issued an Airworthiness Directive (AD) to require flight prohibition for all manufacturer serial numbers of helicopters AS 332 L2 and EC 225 LP (EASA 2016b). This precautionary measure was based on the investigation report which indicated metallurgical findings of fatigue and surface degradation of components inside the MGB of the helicopter. EASA authorized the return to operation of these helicopters, after four months, with the accomplishment of several required actions, which included among others the repetitive inspections of MGB particle detectors and oil filter after last flight of the day, or at intervals not to exceed 10 flight hours, whichever occurs first (EASA 2016a).
The extensive and complex investigation conducted by the Accident Investigation Board Norway (AIBN) revealed that the accident was a result of a fatigue fracture in one of the eight second stage planet gears in the epicyclic module of the MGB. According to the investigation report, the fatigue fracture initiated from a surface micro-pit in the upper outer race of the bearing, propagating subsurface while producing a limited quantity of particles from spalling, before turning towards the gear teeth and fracturing the rim of the gear without being detected (AIBN 2018). The detachment of particles from rotating machine components occurs mainly due to wear of the transmission mechanisms in the gearboxes of the helicopter. Not coincidentally, the standards of the Federal Aviation Administration (FAA) set as an airworthiness requirement for rotary-wing aircraft, that rotor drive system transmissions and gearboxes utilizing ferromagnetic materials must be equipped with chip detectors designed to indicate the presence of ferromagnetic particles resulting from damage or excessive wear within the transmission or gearbox (FAA 2022). One of the measures proposed by EASA to control and mitigate the risk of accidents with EC-225 EP helicopters after returning to operation is to collect small particles of detached metal, that is less than 1 millimeter in size and circulate in the oil line of the helicopter MGB. If the detached particles exceed certain criteria, observing their quantity, area, length, shape and material, flights must be interrupted and the MGB of the helicopter should be taken for overhaul, which means the manufacturer can conduct a complete inspection and review of the MGB with the disassembly of its modules (EASA 2016a). Although the inspections of MGB particle detectors and oil filter are recognized as necessary to keep the helicopter flights safe, the MGB overhaul before the Time Between Overhaul (TBO), pose enormous logistical difficulties to operators as they take the aircraft out of service for months prematurely.
Helicopter gearbox fault detection and diagnosis is based on oil analysis and vibration monitoring (Randall 2011). Over time, much research has been carried out involving the analysis of vibrations measured by accelerometers as a way of detecting possible faults in bearings, gears, etc. (Chin et al. 2023, Kirankumar et al. 2018, Yin et al. 2014, Khan 2019). To understand the information carried by vibration, it is necessary to be aware of the relationship between the factors that influence vibration. To diagnose an imminent failure, a good understanding of the evidence related to the failure mode and the methods of collecting and quantifying that evidence is required. Most modern gear diagnostic techniques are based on the analysis of vibration signals captured in the gearbox housing (Dempsey et al. 2007). The common objective is to detect the presence and type of fault at an early stage of development and monitor its evolution, in order to estimate the residual life of the machine and choose an appropriate maintenance plan (Aherwar 2012).
Time-statistical analysis is one of the methods used in rotating machinery fault detection. This type of traditional analysis is typically based on some statistical measurement of vibration energy. There are five different processing subgroups in this analysis category: Raw Signal, Time Synchronous Average Signal, Residual Signal, Difference Signal, and Band-Pass Mesh Signal (Sait & Sharaf-Eldeen 2011). Detecting gearbox faults based on the raw vibration signal is usually difficult and features of vibration such as the Root Mean Square (RMS), Kurtosis, Skewness, etc. are extracted to identify various types of faults (Jammu et al. 1996). Time-domain signal processing techniques are used to compare two signals, returning the likelihood that the two signals have the same probability distribution function, to determine whether the two signals are similar or not. By comparing a given vibration signature with other signatures from known gear conditions it is possible to state which is the most likely condition of the gear under analysis (Andrade et al. 2001). It was recognized that gear faults can generate sharp transients in the vibration signals of gearboxes (Khan 2019). The gearbox vibration signature consists of three significant components: a sinusoidal component due to time-varying loading; a broad-band impulsive component due to impact; and random noise. Under normal operating conditions, each gearbox component produces vibrations at specific frequencies that are related to the rotational frequency of the component, then the sinusoidal component dominates in a healthy gearbox. Furthermore, the sinusoidal component shows signs of modulation and reduction in amplitude. Moreover, both the broadband impulsive component and the random noise are also present in these signals. The trends displayed by the sinusoidal components are more observable in the frequency domain while the trends displayed by the broad-band impulsive components are more observable in the time domain (Sait & Sharaf-Eldeen 2011). Time-frequency analysis has become popular as another useful technique for gear fault detection. The vibration generated by the defective component will be different from normal vibration, reflected in the component’s rotational frequency and its harmonics. In frequency analysis faults such as eccentricity or local tooth damage can often be identified by the appearance of modulation sidebands in the vibration spectrum, separated from the gear teeth meshing frequency and its harmonics by multiples of the gear rotation frequency. However, the recognition of modulation sidebands in the vibration spectrum of a complex gearbox containing many gears can be made difficult by the large number of components in the spectrum and the high background noise level. Recognition of the sidebands produced by local defects such as early fatigue cracks may be particularly difficult because of the very short duration of the modulation, leading to yield sidebands that extend over a broad frequency range but have a very low amplitude (Randall 1982).
The helicopter’s design already includes accelerometers mounted on the MGB housing as part of the Health and Usage Monitoring System (HUMS) (Hünemohr et al. 2022). The HUMS is responsible for the condition monitoring of the helicopter powertrain in general. HUMS originated from the need for precise diagnostics and prognostics on offshore platforms and has gained significant acceptance in rotary-wing aircraft due to its capability to monitor vibrations and detect faults in critical rotating systems. HUMS meets the airworthiness qualification criteria included in Aeronautical Design Standard 79 (ADS-79) (USA Army 2013). ADS-79’s Appendices D and I govern the qualification of classifiers, known as Condition Indicators (CIs). The primary method for qualifying the classifiers described in Appendix A is by demonstrating an acceptable Bernoulli trial from field or laboratory data. ADS-79 makes fundamental assumptions regarding classifiers, namely, they are physics-based algorithms developed during the engineering design process and qualified through aircraft flight testing or laboratory failure testing. Engineers who have developed diagnostics in recent decades have approached problems from a physics-based perspective (Wade et al. 2015).
Obtained from a HUMS report Figure 1 depicts the graph of the evolution of one MGB’s condition indicator over flight hours (AIBN 2018). It presents the root mean square acceleration (grms) of the upper planetary carrier, as well as the thresholds for amber and red alerts. Crossing the amber line provides an early warning for the aircraft pilots to be alert of the necessity of a specific visual inspection of the MGB. On the other hand, crossing the red line indicates the aircraft’s integrity must be restored as a priority before the next flight.

Vibration measured from an EC 725 AP HUMS. It presents the root mean square acceleration (grms) of the upper planetary carrier (green), and the thresholds for amber and red alert (AIBN 2018).
The HUMS raw data is used to extract the spectral signature of a given gear for analyzing if it is defective or not. While this approach is technically feasible, at times, the amplitude of the frequency spectrum does not offer a definitive insight into a gear’s condition. Zhou et al. (2019), in their analysis of the planetary gears in the epi-cyclic module of the second stage of the SA 330 aircraft’s MGB (similar to the EC 725’s MGB), observed that raw spectral data do not always clearly reflect gear conditions. Furthermore, the software used to extract the data collected by the HUMS does not allow for bulk exportation of the vibration data from each flight. These two challenges inevitably lead to the exploration of other ways of identifying the need for aircraft maintenance. Despite recognizing the importance of HUMS, Hünemohr et al. (2022) propose an alternative methodology based on flight data for supporting the maintenance service schedule, regardless of the analysis by HUMS.
Other studies indicate promising, albeit challenging, ways to conduct predictive maintenance approaches using Machine Learning techniques (Adryan & Sastra 2021, Ersöz et al. 2022, Azyus et al. 2023, Khattak et al. 2024). Those works explore the use of machine learning for predictive maintenance in aircraft and a data-driven approach to analyze aircraft system health, indicating a trend towards leveraging extensive datasets for maintenance prediction.
In our search of the main scientific databases, however, no work was found that uses a decision tree algorithm to assist in the early identification of particle detachment. Our work depicts a novel approach that might offer unique insights or efficiency benefits compared to the neural network-based methods commonly used in the field. Furthermore, the high resolution of the analyzed data may offer more predictive insights compared to studies with less frequent or less detailed data collection. We utilized data from the Flight Data Recorder (FDR) of the military version of the EC-225 AP, currently called Airbus Helicopter H225M, to analyze the correlation between flight parameters and particle detachment. In order to mitigate the premature overhaul of the MGB based on oil analysis, this work aims to use a Machine Learning approach to identify one or more flight parameters that may be correlated with the excessive detached particles.
The remainder of this paper is structured as follows: Section 2 discusses the evolution of cracks in helicopter gearboxes, emphasizing the dynamic loads leading to fatigue failures in critical components. It provides a detailed analysis of the fatigue phenomenon and its progression stages, illustrating the complexities of crack evolution through the case study of an EC 225 LP helicopter accident. Section 3 outlines the criteria set by regulatory bodies for flight interruption based on particle detachment metrics, highlighting the stringent safety standards aimed at mitigating catastrophic failures.
In Section 4, we introduce our machine learning method and flight data analysis, detailing the challenges faced in data collection and pre-processing. This section also discusses the decision tree algorithm used for our study, its rationale, and the benefits over traditional data analysis techniques. We explain our methodology for identifying flight parameters correlated with premature particle detachment, addressing data imbalance and transformation challenges to refine our predictive model.
Section 5 presents the results of our predictive approach, demonstrating the effectiveness of the decision tree algorithm in distinguishing flights with potential gearbox issues. This section validates our model’s accuracy and discusses the implications of identifying the maximum oil temperature of the MGB as a critical parameter for gearbox health monitoring.
Finally, Section 6 concludes our study by summarizing our findings and their significance in enhancing gearbox health monitoring practices. We reflect on the implications of our work for predictive maintenance strategies and propose future research directions to further improve the reliability and safety of helicopter operations.
ABBREVIATIONS
AD – Airworthiness Directive
ADS – Aeronautical Design Standard
AH -Airbus Helicopters
AIBN – Accident Investigation Board Norway
CAPES - Coordination for Higher Education Staff Development
CI – Condition Indicators
CNPq - National Council for Scientific and Technological Development
EASA – European Union Aviation Safety Agency
FAA – U.S. Federal Aviation Administration
FADEC - Full Authority Digital Engine Control
FDR – Flight Data Recorder
GRMS – Root mean square acceleration
HUMS – Health and Usage Monitoring System
IFI - Industrial Fostering and Coordination Institute
MGB – Main Gearbox
ML – Machine Learning
RMS – Root Mean Square
TBO – Time Between Overhauls
TSN – Time Since New
MATERIALS AND METHODS
Crack evolution
The generation of lift via rotary wings produces a loading environment that is ruled by large dynamic loads that are applied at a high rate. In terms of fatigue, therefore, rotors, engines, and transmissions are the components that experience the majority of fatigue failures in helicopters and consequently, most of the research is concentrated in these three components (Lombardo 1993). The fatigue phenomenon is a progressive, localized, and permanent structural change occurring in a structure subjected to conditions that produce fluctuating stresses and deformations at some points, which can culminate in cracks or complete fractures after a sufficient number of fluctuations (ASTM 2000).
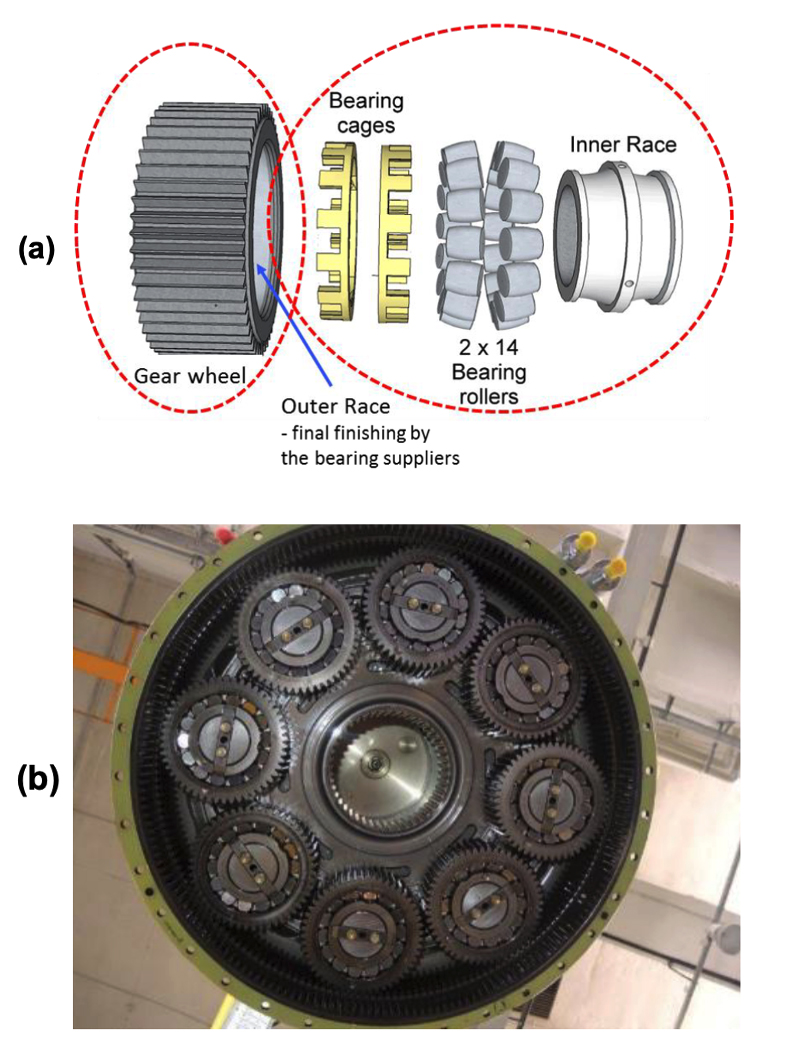
Particularly in the case of the EC 225 LP helicopter’s accident, one of the eight planetary gears of the epi-cyclic module of the second stage had its crack initiated from a micro-cavity in the contact region between the bearings and the gear wheel, the so-called outer race region (AIBN 2018). Figures 2a and 2b, respectively, illustrate an exploded isometric view of a planetary gear and the arrangement of the eight gears of this type in the epicyclic module of the second stage of the MGB.

(a) Exploded view of a planetary gearset. (b) Planetary gears of the epicyclic module from the second stage. Adapted from AIBN (2018).
The crack’s evolution led to the fracture of the planetary gear wheel, as illustrated in Figure 3, culminating in the catastrophic event that separated the main rotor from the aircraft. The images of the figure were collected from the video published by Airbus, which presents the accident investigation (Airbus 2017).

(a) Micro-cavity in the outer race; (b) beginning of propagation from the microcavity; (c) crack evolution along the radial direction of the gear; (d) onset of fracture at the root of the gear tooth; (e) fracture of the planetary gear wheel. Extracted from AIRBUS (2017).
As load cycles increase, surface scratches deepen, and imperfections and intrusions become cracks. This phenomenon marks the start of Stage I of the crack (or fissure) development. Stage I is characterized by the crack growth rate being slower, approximately 0.1 nm/cycle, and the cracks tend to follow crystallographic slip planes, resulting in less distorted fracture surfaces. The transition from Stage I to Stage II is typically triggered when a crack on the slip plane encounters an obstacle, such as a grain boundary. Stage II, in contrast to Stage I, has a much higher growth rate (on the order of micrometers per cycle), and the fracture surfaces are typically more distorted due to the less directed path of the cracks. These stages differ significantly, considering that the growth rate in Stage II is about 10,000 times faster than in Stage I. The importance of this differentiation is notable, given the large discrepancy in the progression rate between the two stages (Abbaschian et al. 2009).
However, the crack size in the transition between stages remains uncertain and is often a matter of perspective of the evaluator and the scale of the component being studied. To a researcher with access to microscopy equipment, this could be an imperfection in the crystal structure, a dislocation, or a 0.1 mm crack. On the other hand, to a field inspector, this could refer to the smallest crack detectable by nondestructive inspection equipment. Nonetheless, it is crucial to distinguish between the duration of the initiation and propagation phases. At low strain levels, up to 90% of the lifespan can be spent on initiation, while at high levels, most of the lifespan can be spent on crack propagation (Bannantine et al. 1990). From an operational standpoint, it is unfeasible to accurately determine the transition from Stage I to Stage II, even approximately. On a microscopic level, fatigue fracture requires that aircraft maintenance manuals establish limits for the number of dislodged particles that can potentially be below the theoretically safe level.
Flight interruption criteria
According to FAA regulations, in transport helicopters with a mass over 7000 pounds, like the EC 725 AP, a catastrophic failure is an event that could result in the loss of the rotor, fatalities among passengers, fatalities among the crew, and/or incapacitation of the crew (FAA 2018). Flight safety can be certified when, among other obligations, the aircraft manufacturer demonstrates that the probability of catastrophic failure of all its coupled systems and/or subsystems is less than or equal to the order of magnitude 10−9.
To maintain the occurrence probability of a catastrophic event on the order of 10−9, Airbus Helicopters has adopted a series of safety conditions regarding the particles collected in the oil line of the EC 725 AP. Depending on the type, material, time window of collection, dimensions, or quantity of the particles collected in the magnetic plugs and the MGB sump, different actions must be taken by the aircraft operators. This work focuses only on swarf-type particles. Table 1 presents the criteria by which the MGB must be removed in this case: if 20 particles of any size or any particle thicker than 0.8 mm are found in an inspection.
Swarf-type particles can be originated from various sources. They present as a short, curved strip spanning a few millimeters in length when not manipulated by moving through gears. Swarf might manifest as rolls or coils. The internal side showcases creases, whereas the smoother external side bears linear tooling marks. Additionally, swarf can fragment into tiny shards. Figure 4 shows an example of a swarf.

The excess occurrence of swarf particles associated with the conditions presented in Table I greatly affects the availability of the Brazilian EC 725 AP fleet. In this sense, identifying the flight parameters correlated with the detachment of particles helps determine the problem’s root cause.
Hypotheses for MGB removal. The acronyms TSO and TSN, respectively, are Time Since Overhaul and Time Since New. Adapted from AIRBUS (2018) & AIRBUS (2020).
Machine learning method and flight data analysis
A database refers to an organized collection of information. Typically, this organized set manifests as a table wherein each column signifies an attribute, and each row denotes the values of these attributes for a specific observation. In the context of this study, the database comprises indirect measurements, i.e., statistics, of values computed by the Flight Data Recorder (FDR) over numerous flight days. Additionally, the final column of the database contains the target attribute, initially determined by the number of detached particles, the values of which were manually recorded by the aircraft maintenance departments. The intricacies of the database composition will be delved into in greater detail in the ensuing sections.
Upon establishing the database, the task remains to identify any patterns, should they exist, that correlate the value of the target attribute with a combination of values from other attributes. The nature of the data in this research does not allow for a definitive inference regarding the optimal method for pattern identification; the selection of a machine learning (ML) method, as opposed to traditional data analysis techniques, is informed by the capability of this approach to discern intricate non-linear relationships and interactions between variables, which are often elusive when employing conventional statistical methods (Bishop 2006). In contrast to statistical modeling, ML probes the system’s structure under investigation without making prior assumptions about the data’s characteristics. ML algorithms aim to construct an empirical model that enhances predictive accuracy. The vast majority of these algorithms autonomously and comprehensively scrutinize potential non-linear relationships.
The decision tree algorithm, for instance, is attuned to nuances in the data that might be overlooked in rudimentary analytical approaches (Aaboub et al. 2023). Furthermore, databases with dozens of attributes present a multifaceted scenario that ML is particularly adept at navigating. Thus, the ML method choice is rationalized by the requirement for a model proficient in processing such intricacy and extracting salient patterns that can augment the understanding of particle detachment in EC 725 AP aircraft.
According to the Aircraft Maintenance Manual (Airbus 2020), it is mandatory to record the number of particles shed, their area, and the date of the flight in which the shedding occurred. Thus, the database of this study includes flight records from 10 different aircraft computed from 2017 to 2020.
To compile the training data set, there were several associated challenges, as listed:
-
The target attribute, that is, the number of particles sheds, as prescribed by the Aircraft Maintenance Manual, is only computed at the end of the day;
-
On the same day when particle shedding occurred, there may have been one or more flights, each with a duration varying from 10 minutes to just over 5 hours;
-
Extracting data from the FDR is a relatively slow process, taking more than a minute for each flight;
-
Also, regarding the FDR, the process is not highly automated, as each extraction is limited to one flight at a time, after manual selection; and
-
The number of flights without particle shedding is dozens of times greater than those with particle shedding, leading to an imbalance between target attribute hypotheses.
Furthermore, concerning problems (a) and (b) mentioned above, the FDR saves data at a frequency of 4 Hz. Thus, for a 2-hour flight, for example, there are 4×3600×2 = 7200 data acquisitions from various sensors throughout the entire flight. And, despite the temporality of data acquisition, the association with the target attributes is, hypothetically, timeless, meaning all data collected at the end of the day (which may include one or more flights) correspond to just one target attribute. Regarding the issue described in items (c) and (d), it should be noted that the software used for reading and extracting flight data, prescribed by Airbus Helicopters (AH), was the PGS Vision 100-0100 (Airbus 2020). The slow and minimally automated nature of the process is inherent to the software’s design, which, despite these limitations, remains the only tool capable of effectively performing this specific task. As for item (e), a possible hypothesis for the observed discrepancy between flights with and without particle shedding may be related to the inherent resistance and durability of the gears in the helicopter’s gearbox. Under normal operating conditions, it is expected that the gears will withstand wear and be capable of functioning over a large number of flights without significant particle shedding. However, abnormal or excessive load conditions, variations in lubrication, foreign debris, or even manufacturing defects may result in particle shedding in fewer flights, leading to an imbalance between the target attribute hypotheses.
In order to address these difficulties, the proposal of this study was devised as follows:
-
Even considering all aircraft, the number of days recorded with particle shedding is small (33 days). Thus, initially, flight data from another 33 days when no particle shedding occurred were taken. This strategy addresses problems (c), (d), and (e) simultaneously, at the cost of not collecting flight data from many other days without shedding incidents.
-
When more than one flight occurred on days recorded with particle shedding, the data from these flights were concatenated. This happens because particle counting occurs at the end of the day, not at the end of each flight. Therefore, the target attribute, the number of particles, began to be associated with the data of all flights on a certain date and not necessarily with just one specific flight.
-
This association raised another issue: how to compare data from dates when particle shedding occurred with dates when it did not? To address this, leveraging the abundance of flight days without particle shedding, days were selected without particle shedding when flights of the same duration as their counterparts with shedding occurred. In other words, if on day X, particle shedding was recorded, and there were three flights (of 1, 2, and 3 hours, for example), in response, a day Y with flights of approximately 1, 2, and 3 hours without particle shedding was chosen.
-
Regarding problem (a), statistics were taken for each flight attribute, making it possible to associate the data of a day containing one or more flights from the same aircraft to the target attribute, that is, the number of particles shed. Since the flight data, concatenated or not, has an approximately equal number of rows distributed between flights with and without shedding, it is expected that the resulting statistical observations will not be biased toward flight times. Figure 5 illustrates the flow of associating flight data with a target attribute. Firstly, the time series of each flight parameter is reduced to a statistic set. Each acquisition comprises 322 attributes. Subsequently, the computed values are associated with the target attribute.

Defective gear detection can be carried out using vibration data from rotating components. According to Li et al. (2021) and Zhang et al. (2024), through the frequency spectrum of the monitored gear, an objective possibility for fracture identification is to compare the energy of the peaks of the now detected characteristic harmonics with the peaks of the harmonics for the gear in healthy conditions, that is, without cracks.
When converting data, as illustrated in Figure 5, the assumption that each flight day constitutes an independent observation is implicit. In this example, we used ‘AVERAGE.AEO’ to represent the average value of the ‘AEO’ attribute; ‘MAX.ALTRATE’ to represent the maximum value of the ‘ALTRATE’ attribute; ‘MIN.BLEED2’ to represent the minimum value of the ‘BLEED2’ attribute; and ‘DFT1.COLL PITCH’ represents the frequency with the highest magnitude in the Discrete Fourier Transform applied to the ‘COLL PITCH’ data series. At first glance, although this hypothesis does not seem inherently valid for evaluating a component’s fatigue, it is important to emphasize: that between any two flights where particle shedding occurred, flights (in varying numbers) without shedding can be observed. However, under varying stress amplitudes, the crack may stop spreading when the stress is low and continue growing when the stress increases. This alternation between periods of rapid growth with periods of slow or nonexistent growth changes the friction degree with which the surfaces experience cracks (Abbaschian 2009). Therefore, the following simplification was adopted in dealing with the problem: the events of flight days are independent of each other.
Exploratory data analysis
The first step in building the observation base was to define relevant statistics for each attribute. For this purpose, data from 14 flight days were concatenated, meaning a sample of about 20% of the database, such that there was no particle shedding in the first seven days and it occurred in the last seven days.
Based on the format of the graph of each of the 322 attributes over the 14 days of flights, one or more statistics were selected from the following options: Mean (mean); Median (median); Maximum value (max); Minimum value (min); Vibration frequency of maximum amplitude (f1); and Vibration frequency of the 2nd highest amplitude (f2).
Figures 6 and 7 exemplify the logic adopted for two flight attributes in choosing the appropriate statistic. Figure 6 shows an attribute where the oscillation frequency at the right side of the graph corresponds to flights with particle shedding and the left side of the graph corresponds to flights without particle shedding. For this attribute, the Vibration Frequency of Maximum Amplitude statistic was adopted. Figure 7 shows an attribute with strong discriminatory power. The left side of the graph corresponds to flights without particle shedding and shows no signs that the Full Authority Digital Engine Control - FADEC acted on engine 2.

Example of an attribute in which the oscillation frequency of the right side of the graph, corresponding to flights with detachment, appears to be higher than that of the left side, corresponding to flights without detachment. The Magnitude relates to the percentage of maximum frequency and the Time axis is expressed in seconds. For this attribute, the Maximum Amplitude Vibration frequency statistic was adopted.

Example of an attribute with high discriminative power. The left side of the graph, which corresponds to flights without particle separator performance, did not register signs that the Full Authority Digital Engine Control - FADEC has acted on engine 2. The Magnitude relates to the percentage of FADEC actuation, which is 100% if an action was required and 0% if no action was required. The Time axis is expressed in seconds. For this attribute, the Maximum Value statistic was adopted.
Pre-processing
The pre-processing tasks of the flight data were performed as described in Table II.
Manual attribute selection
After establishing the statistics for each flight attribute, manual attribute selection was applied to reduce dimensionality, i.e., the number of columns in the database. For this purpose, two criteria were used: flight parameters with no known definition were discarded, and flight parameters potentially uncorrelated with particle shedding were discarded.
The data tables exported by the FDR have columns with abbreviated titles in acronyms and abbreviations with limited ease of association with the respective flight parameters.
The aircraft manufacturer, AH, provided a list with a brief description of the flight attributes exported by the FDR. Despite this generous contribution, the provided list also had a few minor inconsistencies, like missing attributes, for example. Hence, attributes with no clear title and absence from the manufacturer’s document were disregarded for this study.
Regarding the potentially uncorrelated flight parameters, parameters such as latitude, longitude, amount of fuel, date, etc., were discarded.
After the aforementioned discards, conducted with the contribution of two engineers from IFI and two pilots, 53 selected attributes remained, see Table III.
Data balancing
Initially, to balance the classes in the database, considering that the total number of days without particle detachment was 33, 66 flight days were taken to compose the database: on 33 days, there was particle detachment, and on the other 33 days, there was none. However, this proportion taken does not accurately reflect the reality of the frequency of occurrence of the events, given that the number of days without detachment is tens of times greater than the recorded number of days with detachment. Table IV depicts the Degree of Imbalance classification used by this work.
Classification of the degree of imbalance between data classes. Adapted from Tahvili & Hatvani (2022).
In cases of extreme imbalance, one of the possible applicable techniques is the reduction of sampling of the majority class (Faceli et al. 2011), commonly referred to as downsampling or random under-sampling (Tahvili & Hatvani 2022). On the other hand, matching the samples of the class with detachment to the class without detachment implies two burdens:
• Only 66 observations, a relatively small amount considering the number of attributes; and
• The machine learning result will present a non-realistic bias to the class with detachment.
To mitigate the aforementioned problems, therefore, another 33 days of flights without particle detachment were added to the database.
The database, therefore, started to have 99 observations: on 33, there was particle detachment, and on the other 66, there was none. Finally, it should be noted that class imbalance is an open problem in the machine learning field (Niaz et al. 2022). The persistent challenge, still without an ideal solution, is how to effectively train a machine learning model so that it is not only sensitive to class imbalance but also capable of making accurate predictions in all classes, regardless of size.
Data transformation
Data transformation is a pre-processing technique whose application depends on the employed machine learning algorithm (Faceli et al. 2011). Originally, this work applied the supervised multilayer artificial neural networks technique (Bishop 1995), in which the target attribute was the number of detached particles. The dataset was randomly divided into training, validation, and test sets.
The results obtained with this technique, however, were not satisfactory. When evaluated based on the test set and considering different hyperparameters, the trained network’s performance showed an average relative difference of 50% between the actual and predicted number of detached particles. That is, on average, the prediction provided by the network for the number of detached particles from a given observation (set of 53 attributes) differed from the actual amount by about 50%.
The results remained unsatisfactory when adopting not the number of detached particles as a target attribute but only whether there was detachment or not.
From this point on, the following hypotheses were listed and evaluated:
-
The detachment might not have a strong correlation with the chosen flight parameter statistics;
-
The dataset might be insufficient to train the neural network;
-
The applied technique, neural networks, might not be the most suitable for this problem; and
-
The number of detached particles might not have been a viable choice as a target attribute.
Regarding machine learning, although many concepts are already consolidated, certain parameters lack absolute rules, making it impossible to state, with current theories, which hypothesis or combination of hypotheses prevented a consistent result when using artificial neural networks.
Hypothesis (a), if true, concludes a potentially weak relation of flight parameters to the detachment event. While not absolutely excluding any correlation, it favors the hypothesis that detachment is more related to maintenance actions.
Hypothesis (b), if true, presents a technical limitation that is difficult to handle, as adding more data necessarily implies a greater imbalance between classes.
Thus, the difficulty in addressing hypotheses (a) and (b) led to hypotheses (c) and (d) being further explored in the search for higher and consistent accuracy rates, that is, under various random distributions of training, validation, and test sets, the accuracy rate exceeds at least 70%.
Thus, regarding hypothesis (c), considering that artificial neural network algorithms are of the “black-box” type (Faceli et al. 2011) and objective identification of flight parameters correlated to detachment is relevant for investigating the root cause of the problem, the decision tree algorithm was chosen.
Decision tree
Decision tree algorithms are a popular technique in supervised machine learning. They are employed to tackle both classification and regression problems, proving especially useful when dealing with large datasets and numerous attributes (Faceli et al. 2011).
The decision tree algorithm operates by constructing a tree-like structure that partitions the data into smaller, more homogeneous subsets based on a series of inquiries concerning the attributes. The tree commences with a root node symbolizing the entirety of the dataset. Subsequently, the algorithm poses a succession of questions to dissect the data into smaller subsets predicated on distinct features. Each node within the tree signifies a query regarding an attribute, and its emanating edges represent potential responses to said query. As the algorithm navigates through the tree, it partitions the data into progressively smaller and more homogeneous subsets until all data are categorized into terminal leaves.
Once the tree has been constructed, it can classify novel data. The algorithm traverses the tree, posing questions and following the edges until it reaches a terminal leaf, which signifies the final classification of the data. Decision trees can be utilized with either categorical or numerical data and are frequently employed in exploratory data analyses due to their relative interpretability.
In the case of flight data, due to the format exported by the FDR itself, the attributes will be divided based on numerical criteria. However, revisiting the question regarding the choice of the target attribute in light of the objective of this work, which is focused on revealing flight parameters susceptible to decisively favoring particle detachment, it was decided to adopt two classes, namely:
-
Very likely: for flight days in which three or more particles detached and
-
Unlikely: for flight days in which two or fewer particles detached.
By adopting this nomenclature for the classes, it becomes explicit that a given set of parameters will likely result in particle detachment while another set will not. Table V shows how we proceeded with the transformation of the target attribute applied to the dataset. In this example, ‘f1.WindSpeed’ represents the Maximum Amplitude Vibration Frequency of attribute ‘WindSpeed’; ’f1.YawPedalPosition’ represents the Maximum Amplitude Vibration Frequency of attribute ‘YawPedalPosition’; and ‘f2.YawPedalPosition’ represents the Vibration Frequency of the Second Highest Amplitude of attribute ‘YawPedalPosition’. The column ’Number of particles’ does not represent an attribute, but instead depicts the number of detached particles found in the related inspection, and column ‘Class’ follows accordingly the observed likelihood.
Although this treatment increased the difference between the quantities of target attributes, the dataset remained with a mild imbalance degree, with the minority class proportion being 22% of the data, as shown in the classification presented in Table IV. Therefore, no further balancing was performed. With this final step, the dataset pre-processing was concluded.
For the algorithm’s execution, a code was used in the R language within the Google Collaboratory environment, transcribed in Appendix A. The dataset was split into 80% for training and 20% for testing, a typical partition in machine learning (Geron 2017). To prevent overfitting, 100 random splits of the dataset into training and test sets were performed. In each split, the 80-20 ratio was maintained for training and testing respectively. This is a conventional choice in machine learning (Geron 2017).
After the 100 executions of the code (one for each train-test split), it was observed that the attribute statistic “maximum oil temperature of the MGB above 109 degrees Celsius” appeared more than 50 times as the root node of the decision tree. This suggests a potential relationship between this parameter and the occurrence of particle detachment. Figure 8 illustrates the result of one of the executions.

RESULTS AND DISCUSSION
The primary result obtained from the algorithm’s application is the decision tree diagram itself, as shown in Figure 8.
Although the random separation of the training, validation, and test sets is automatically performed by the Caret library (Kuhn 2008), it is appropriate to test other seed values for generating random training and test sets to mitigate the hypothesis that the max MGBT parameter was found by chance.
Thus, by arbitrarily considering 101 possible distributions between training and test sets, varying the seed parameter from 0 to 100, and preserving the rest of the code, we have the following results, expressed in Table VI. This table clearly shows the prevalence of the max MGBT parameter in the 101 random distributions of training and test sets. In other words, the max MGBT parameter, which represents the maximum oil temperature of the MGB, can often distinguish between highly likely and less likely cases.
Figure 9 summarizes the distribution of the parameters presented in Table VI. The model’s accuracy is determined by the fraction of cases correctly identified by the decision tree over the total number of cases in the test set. For the 52 cases where the max MGBT parameter was prevalent, the average accuracy calculated was approximately 76%. Other studies using decision trees also came to similar results. For instance, Kumar (2022) got an 85.5% accuracy when using decision trees in health diagnosis. In another example, Abdullah et al. (2017) reached an accuracy of 71.42% while trying to determine the best variant of decision tree algorithms to deal with medical data problems.

Distribution of parameter frequency in 101 random splits of training and test sets. The acronym NA stands for Not Available and refers to the case where the resulting decision tree could not expand beyond the root node. This situation occurs when the randomly generated training set does not contain sufficient representation of both classes or the variation within the minority class is insufficient to justify a split.
Finally, the temperature of 113°C was found through the weighted average of each maximum temperature identified by the decision tree, see the 4th column of Table VI. The weights assigned were the accuracies, the 3rd column of Table VI. The average temperature found was Tm ≈ 113°C. This study was then concluded by the identification of this single threshold that was capable of accurately distinguishing between flights experiencing particle detachment and those without, achieving a reasonable precision rate.
CONCLUSIONS
The detachment of particles occurs mainly due to fatigue fractures. Such fractures cause imbalances responsible for increasing the vibration amplitude of the gears. The cycle perpetuates itself as the gear subjected to vibration may shed more particles due to the cyclic variation of induced stress.
Moreover, the evolution of these fatigue fractures has a strongly nonlinear nature. The end of the aforementioned cycle occurs with the failure of the gear, culminating in the already experienced catastrophic event. To maintain the probability of occurrence of the catastrophic event in the order of magnitude 10−9, AH published a series of thresholds, i.e., criteria, related to the characteristics of the particles shed in the MGB oil line. If such thresholds were exceeded, the aircraft should cease its flights, and the manufacturer should review the MGB.
These criteria caused several aircraft to have their operations prematurely halted to have their MGBs reviewed. The investigation into a root cause that could explain such disparity led to the search for a pattern between the occurrence of particle detachment and flight parameters. For this purpose, thousands of data from the parameters exported by the FDR were concentrated into some relevant statistics. Associating such statistics from 99 flights of 10 different aircraft with the number of particles shed, a database was composed for applying a machine learning algorithm.
Initially, the neural network algorithm was used on the dataset. The results of the application of this algorithm showed low accuracy, in the order of 50%, opting to change the machine learning algorithm to the decision tree algorithm.
Among other advantages, for the purpose of this work, decision trees have greater interpretability and allow visualizing the decision-making process of the resulting model and understanding which attributes were more important in its construction.
Finally, the parameter found by the decision tree algorithm was the maximum oil temperature of the MGB above 113°C. This single threshold could correctly discriminate flights in which there was and was not particle detachment with an accuracy rate of approximately 76%.
Although this work has pointed out the maximum oil temperature of the MGB as a parameter correlated to particle detachment, the root cause of the problem still requires further investigation. In this sense, it is necessary to evaluate the specifications of the oil used in cases with and without detachment and consider other hypotheses that could raise the oil temperature, such as excessive torque application when fixing gears.
In addition, the method can be replicated with relative ease to search for correlation of flight parameters with any other problems, just define them and concentrate them in convenient statistics, and then apply the decision tree algorithm.
ACKNOWLEDGMENTS
The author Airton Nabarrete is grateful to the CNPq for funding his research, grant no. 317388/2021-5. This study was financed in part by the Coordenação de Aperfeiçoamento de Pessoal de Nível Superior (CAPES) - Brazil. Finance code 001.
REFERENCES
- AABOUB F, CHAMLAL H & OUADERHMAN T. 2023. Statistical analysis of various splitting criteria for decision trees. J Algorithms Comput Technol 17: 17483026231198181.
- ABBASCHIAN R, ABBASCHIAN L & REED-HILL RE. 2009. Physical Metallurgy Principles, 4th ed., Cengage Learning, Stamford.
- ABDULLAH AS, SELVAKUMAR S, KARTHIKEYAN P & VENKATESH M. 2017. Comparing the efficacy of decision tree and its variants using medical data. Ind J Sci Technol 10(18): 1-8.
- ADRYAN F & SASTRA K. 2021. Predictive maintenance for aircraft engine using machine learning: trends and challenges. Avia 3(1).
- AHERWAR A. 2012. An investigation on gearbox fault detection using vibration analysis techniques: A review. Aust J Mech Eng 10(2): 169-183. DOI:10.7158/M11-830.2012.10.2.
-
AIBN. 2018. Report on the air accident near Turøy, Øygarden municipality, Hordaland county, Norway 29 April 2016 with Airbus helicopters EC 225 LP, LN-OJF, operated by CHC Helikopter Service AS. Tech. Rep. SL 2018/04, Lillestrøm, Norway. Available at: https://www.nsia.no/Aviation/Published-reports/2018-04 Accessed on: 18 Apr. 2024.
» https://www.nsia.no/Aviation/Published-reports/2018-04 -
AIRBUS. 2017. H225 LN-OJF accident investigation status. Video. Available at: https://www.youtube.com/watch?v=KvBLadpVscY Accessed on: 18 Apr. 2024.
» https://www.youtube.com/watch?v=KvBLadpVscY - AIRBUS. 2018. Standard Practices Manual, 7th ed., Airbus Helicopters, Marignane Cedex - FR.
- AIRBUS. 2020. Aircraft Maintenance Manual, 21st ed., Airbus Helicopters, Itajubá.
-
ANDRADE F, ESAT I & BADI M. 2001. A new approach to time-domain vibration condition monitoring: Gear tooth fatigue crack detection and identification by the kolmogorov–smirnov test. J Sound Vib 240(5): 909-919. DOI: https://doi.org/10.1006/jsvi.2000.3290.
» https://doi.org/10.1006/jsvi.2000.3290 - ASTM. 2000. Standard terminology relating to fatigue and fracture: In testing ASTM designation E1823, vol 03.01, p. 1034-1035.
- AZYUS AF, WIJAYA SK & NAVED M. 2023. Prediction of remaining useful life using the cnn-gru network: A study on maintenance management. Softw Impacts 17: 100535.
- BANNANTINE J, COMER J & HANDROCK J. 1990. Fundamentals of Metal Fatigue Analysis. Prentice Hall.
- BISHOP CM. 1995. Neural networks for pattern recognition. Oxford University Press.
- BISHOP CM. 2006. Pattern recognition and machine learning. Springer, vol 2, p. 5-43.
- CHIN ZY, BORGHESANI P, SMITH WA, RANDALL RB, MAO Y & PENG Z. 2023. Comparison of vibration and transmission error in gear crack diagnostics. In: 20th Australian International Aerospace Congress, Engineers Australia, Melbourne, p. 538-544.
- DEMPSEY PJ, LEWICKI DG & LE DD. 2007. Investigation of current methods to identify helicopter gear health. In: 2007 IEEE Aerospace Conference, IEEE, p. 1-13.
-
EASA. 2016a. Emergency airworthiness directive, ad no.: 2016-0199, issued: 07 October 2016. Tech Rep 2016-0199. Available at: https://ad.easa.europa.eu/ad/2016-0199 Accessed on: 18 Apr. 2024.
» https://ad.easa.europa.eu/ad/2016-0199 -
EASA. 2016b. Emergency airworthiness directive, ad no.: 2016-0104-e, issued: 02 June 2016. Tech Rep 2016-0104-E. Available at: https://ad.easa.europa.eu/ad/2016-0104-E Accessed on: 18 Apr. 2024.
» https://ad.easa.europa.eu/ad/2016-0104-E - ERSÖZ OO, INAL AF, AKTEPE A, TÜRKER AK & ERSÖZ S. 2022. A systematic literature review of the predictive maintenance from transportation systems aspect. Sustainability 14(21): 14536.
-
FAA. 2018. Advisory circular 29-2c. Available at: https://www.faa.gov/documentLibrary/media/Advisory_Circular/AC_29-2C_with_changes_1-8.pdf
» https://www.faa.gov/documentLibrary/media/Advisory_Circular/AC_29-2C_with_changes_1-8.pdf -
FAA. 2022. Part 29: Airworthiness standards: Transport category rotorcraft. Available at: https://www.ecfr.gov/current/title-14/chapter-I/subchapter-C/part-29/subpart-F/subject-group-ECFR12da8eabf96ea03/section-29.1337 Accessed on: 18 Apr. 2024.
» https://www.ecfr.gov/current/title-14/chapter-I/subchapter-C/part-29/subpart-F/subject-group-ECFR12da8eabf96ea03/section-29.1337 - FACELI K, LORENA AC, GAMA J & DE LEON FERREIRA DE CARVALHO ACP. 2011. Inteligência artificial: uma abordagem de aprendizado de máquina, 1st ed., LTC, Rio de Janeiro.
- GERON A. 2017. Hands-On Machine Learning with Scikit-Learn and TensorFlow, 1st ed., O’Reilly Media, Inc., Gravenstein Highway North, Sebastopol.
- HÜNEMOHR D, LITZBA J & RAHIMI F. 2022. Usage monitoring of helicopter gearboxes with ads-b flight data. Aerospace 9(11): 647. DOI:10.3390/aerospace9110647.
- JAMMU V, DANAI K & LEWICKI D. 1996. Unsupervised pattern classifier for abnormality-scaling of vibration features for helicopter gearbox fault diagnosis, p. 154-162.
- KHAN N. 2019. Vibration response of a gearbox having gear with teeth root cracks. Int J Res Appl Sci Eng Technol 7(6): 2015-2020.
- KHATTAK WR, SALMAN A, GHAFO Heliyon 10(3): e25120. OR S & LATIF S. 2024. Multi-modal lstm network for anomaly prediction in piston engine aircraft. Heliyon 10(3).
- KIRANKUMAR M, LOKESHA M, KUMAR S & KUMAR A. 2018. Review on condition monitoring of bearings using vibration analysis techniques. In: IOP Conference Series: Materials Science and Engineering, vol. 376, IOP Publishing, p. 012110.
- KUHN M. 2008. Building predictive models in R using the caret package. J Stat Softw 28(5): 1-26. doi:10.18637/jss.v028.i05.
- KUMAR G. 2022. Analysis of accuracy in heart disease diagnosis system using decision tree classifier over logistic regression based on recursive feature selection. ECS Transactions 107(1): 15661.
- LI X, CHEN K, HUANGFU Y, MA H, ZHAO B & YU K. 2021. Vibration characteristic analysis of spur gear systems under tooth crack or fracture. J Low Freq Noise Vib Act Control 40(1): 135-153. doi:10.1177/1461348419879550.
- LOMBARDO D. 1993. Helicopter structures - a review of loads, fatigue design techniques and usage monitoring. Tech Rep AR-007-137, Victoria, Australia.
- NIAZ NU, SHAHARIAR KN & PATWARY MJ. 2022. Class imbalance problems in machine learning: A review of methods and future challenges. In: Proceedings of the 2nd International Conference on Computing Advancements, p. 485-490.
-
RANDALL RB. 1982. A New Method of Modeling Gear Faults. J Mech Des 104(2): 259-267. doi:10.1115/1.3256334. Available at: https://doi.org/10.1115/1.3256334.
» https://doi.org/10.1115/1.3256334 -
RANDALL RB. 2011. Vibration-based Condition Monitoring: Industrial, Aerospace and Automotive Applications. John Wiley & Sons, Ltd. doi:10.1002/9780470977668. Available at: https://doi.org/10.1002/9780470977668
» https://doi.org/10.1002/9780470977668 - SAIT AS & SHARAF-ELDEEN YI. 2011. A review of gearbox condition monitoring based on vibration analysis techniques diagnostics and prognostics. In: Proulx T (Ed.), Rotating Machinery, Structural Health Monitoring, Shock and Vibration, vol. 5, Springer, New York, NY, p. 307-324.
- TAHVILI S & HATVANI L. 2022. Artificial Intelligence Methods for Optimization of the Software Testing Process: With Practical Examples and Exercises, Uncertainty, Computational Techniques, and Decision Intelligence. Elsevier Science.
- USA ARMY. 2013. ADS-79D-HDBK - Aeronautical Design Standard Handbook for Condition Based Maintenance Systems for US Army Aircraft. Technical Report.
- WADE D, LUGOS R & SZELISTOWSKI M. 2015. Using machine learning algorithms to improve hums performance. In: Proceedings of the 5th American Helicopter Society CBM Specialists Meeting, Huntsville, AL.
- YIN J, WANG W, MAN Z & KHOO S. 2014. Statistical modeling of gear vibration signals and its application to detecting and diagnosing gear faults. Inf Sci 259: 295-303.
- ZHANG J, ZHANG Q, QIN X & SUN Y. 2024. A novel performance degradation assessment method for rotating machinery based on the fault information and the dynamic simulation. Meas Sci Technol 35: 066107.
- ZHOU L, DUAN F, CORSAR M, ELASHA F & MBA D. 2019. A study on helicopter main gearbox planetary bearing fault diagnosis. Appl Acoust 147(11-13): 4-14.
Appendix A. Implemented Algorithm Code
1 # install.packages(“caret”) # Necessary only on 1st time
2 library(caret)
3 library(readr)
4 # load database
5 database <- read_csv(“sample_data/Fight_Data_99.csv”, show_col_types = TRUE)
6 # separates the database in training and testing data sets
7 # p represents the percentage of data dedicated to training
8 # 1 - p, therefore, represents the percentage of data dedicated to testing
9 set.seed(0)
10 train.indices <- createDataPartition(database$Class, p = 0.8, list = FALSE)
11 database.train <- database[train.indices, ]
12 database.test <- database[-train.indices, ]
13 # prints general information about the total data set, training and testing
14 summary(database)
15 summary(database.train)
16 summary(database.test)
17 # install required package
18 library(rpart)
19 # tree construction
20 fit <- rpart(Class ~ ., data=database.train, method=”class”)
21 par(xpd = TRUE)
22 plot(fit,compress=TRUE, uniform=TRUE, branch = 0, main=”Decision Tree EC 725 AP”)
23 text(fit)
24 # Tests the success rate of the algorithm against the test partition
25 prediction <- predict(fit, database.test, type = “class”)
26 t <- table(database.test$Class,prediction)
27 ac <- sum(diag(t))/sum(t)
28 ac