Abstract
Abstract: The mechanism behind exercise-induced fatigue is a significant topic in the field of sports physiology. Therefore, establishing and evaluating an acute exercise-induced fatigue animal model that explores the limits of the motor system may provide greater insight into these mechanisms. Heart rate is an important quantitative parameter that accurately reflects the immediate change in physical function due to exercise load. And there is likely to be an important correlation between heart rate and behavioral performance. In this study, changes in heart rate and behavioral indexes during exercise-induced fatigue were quantitatively analyzed in rats using heart rate telemetry and video methods respectively. The behavioral indexes were used as independent variables and the degree of fatigue was used as the forecast value. Ternary quadratic function curve fitting was used to deduce a formula to calculate a fatigue score: Y = 15.2548+0.4346∙xa-0.1154∙xb+0.6826∙xc+0.0044∙xa∙xb-0.0021∙xb∙xc-0.0013∙xc∙xa-0.0023∙xa2-0.0016∙xb2 (r2=0.906). It identified a linear relationship between heart rate and exercise intensity, with a plateau in heart rate occurring during difference periods. It will serve as an effective reference for the modeling of exercise-induced fatigue. In addition, it also provides a theoretical method for analyzing the correlation between peripheral and central parameters.
Key words
exercise-induced fatigue; animal model; treadmill running; heart rate
INTRODUCTION
Exercise-induced fatigue is a common phenomenon in athletics and a key factor that restricts an athlete’s performance level (KnuttgenKNUTTGEN HG. 1983. Biochemistry of Exercise. Human Kinetics Publishers. Glossary of Exercise Terminology. 1983). The term “exercise-induced fatigue” refers to a state in which the physiological systems of the body cannot continue to function at the required level, or the individual cannot maintain a predetermined exercise intensity. Professor Mosso pioneered the research on exercise-induced fatigue in 1891 and subsequently introduced multiple hypotheses, including that “muscle fatigue is a peripheral phenomenon independent of the nervous system,” “carbon dioxide and lactic acid metabolites are the main factors that reduce muscle contractility,” and “fatigue is an alert signal for the body’s self-protection.” At the Fifth International Exercise Biochemistry Conference held in 1982, the term was finally defined as “the body’s physiological processes that cannot maintain its functions at a particular level and/or cannot maintain predetermined exercise intensity,” as mentioned above.
In recent years, with the rapid theoretical and technological developments in the field of neuroscience, the central nervous system (CNS) has been known to play an important role in moderating exercise-induced fatigue. For example, once exercise-induced fatigue appears, nerve conduction velocity decreases, the concentration of 5-hydroxy tryptamine (5-HT) neurotransmitter in the CNS increases, and the excitability of neurons in the cerebral cortex decreases (TanakaTANAKA M, NAKAMURA F, MIZOKAWA S, MATSUMURA A, NOZAKI S and WATANABE Y. 2003. Establishment and assessment of a rat model of fatigue. Neurosci Let 352(3): 159-162. et al. 2003, TianTIAN Y and GAO T. 1995. The Establishment of Exercise-induced Fatigue Models in Rats. J of Beijing University of Physical Education 18(4): 49-53. and Gao 1995, Li et al. 2008LI JY, KUO TB, HSIEH SS and YANG CC. 2008. Changes in electroencephalogram and heart rate during treadmill exercise in the rat. Neurosci Let 43499(2): 175-178.). In addition, it is proposed that exercise-induced fatigue is the result of cerebral protective inhibition, and that the associated reduction in muscle contractility is the result of functional failure of the CNS. It is presumed that exercise-induced fatigue occurs due to changes in the electrical activities of neurons in the cerebral cortex and basal ganglia. However, owing to the lack of quantitative methods to evaluate exercise-induced fatigue in animals, it is difficult to obtain conclusive experimental results, and further research is required to deduce the mechanisms behind exercise-induced fatigue. In the present study, the degree of exercise-induced fatigue was evaluated by observing the running distance and posture of rats, which are not fully quantitative parameters. In exercise physiology, heart rate is an important quantitative parameter that accurately reflects the immediate change in physical function due to exercise load. Behavioral indexes, such as running distance and posture, may reflect the overall condition of experimental animals (KrukKRUK MR. 1997. Measuring behavior into the twenty-first century. TINS 20(5): 187-189. 1997). Therefore, there is likely to be an important correlation between heart rate and behavioral performance.
In this study, changes in heart rate and behavioral indexes during exercise-induced fatigue were quantitatively analyzed in rats using heart rate telemetry and video methods, respectively. The behavioral indexes were used as independent variables and the degree of fatigue was used as the forecast value. Ternary quadratic function curve fitting was used to deduce a formula, and evaluation of the degree of exercise-induced fatigue was performed to provide a reference for future exploration of physiological, biochemical, and neurobiological mechanisms of exercise-induced fatigue.
MATERIALS AND METHODS
ANIMALS USED IN THIS STUDY
Twelve male Wistar rats (Beijing Vital River Laboratory Animal Technological Company, Beijing, China) at 8-10 weeks of age (weighing 280 ± 20 g) were used in this study. All rats were randomly divided into two groups with three rats to a cage. The animals were maintained on a 12-h light/dark cycle and given food and water ad libitum. The rats were maintained in an environment with a relative huHU Y, LIU X and QIAO D. 2013.The modulatory effect of ‘SNr-VL-SMA’ pathway during the exhaustive exercises in rats. J of shanghai university of sport 37(5): 57-62.midity of 40–60% and room temperature of 20–25°C. All experimental procedures were approved by the Ethics Committee of Beijing Normal University (LUNLI20130901).
FATIGUE MODEL ESTABLISHMENT AND ETHOLOGICAL INDICES OBSERVATION
After being fed in the laboratory for 3 days, the rats were subjected to 5-days of adaptive treadmill training. A modified Bedford treadmill exercise with a progressively increasing load was used for the exercise-induced fatigue model (LiuLIU X, LUO Y and QIAO D. 2012. Establishment and dynamic evaluation of a rat model of one single bout of exhaustive exercise on treadmill. Acta Lab Anim Sci Sin 20(3) 25-28. et al. 2012). There were three load levels. Level I: 8.2 m/min, lasting for 15 min; level II: 15 m/min, lasting for 15 min; level III: 20 m/min, lasting until exhaustion. The criteria used to indicate exercise-induced fatigue were as follows: the running posture shifted from thrusting against the ground to prostration, the rat stayed at the end of the treadmill without the ability to continue running, and the rat was unable to be driven to continue running even with sound or electrical stimulation.
A transparent polymethylmethacrylate enclosure was placed over the treadmill, and a scale was marked below the two sides of the enclosure. The midpoint of each rat’s body and the root of the tail were marked in red. Two cameras were placed on each side of the treadmill to record the data which was to be analyzed later. If the marked point of the root of the tail was ≥ 34 cm away from the board in front of the treadmill, sound stimulation was applied; if the marks were ≥ 39 cm away from the board, electrical stimulation was applied. Meanwhile, if the midpoint of the rat was ≥ 39 cm away from the board for > 0.5 s during a 1 s period, the rat was considered to have slipped off the treadmill belt.
ELECTRODE IMPLANTATION AND HEART RATE COLLECTION DURING EXERCISE
The electrode for heart rate telemetry was implanted the day after the adaptive treadmill training finished. For the electrophysiological recording, the rats were anesthetized with 10% chloral hydrate (0.35 mL/100 g) and placed on a stereotaxic frame. The fur above the left side of the chest and right side of the neck was removed (approximately 2 cm × 1 cm), and a heart rate telemetry electrode vest was affixed to each rat. A 0.8 cm incision was made in the skin, and the electrode was implanted subcutaneously with the positive electrode near the heart, in the left side of the chest, and the negative electrode implanted in the right side of the neck, at the same level as the positive electrode. The wound was then sutured. Before the treadmill exercise, a battery-operated transmitter was attached to the vest, and the electrode was connected to the transmitter. While the rats were performing the Bedford treadmill exercise, their heart rate was measured by the wireless animal heart rate telemetry system and the behavioral changes were observed at the same time, by video (Figure 1).

DATA COLLECTION AND PRESENTATION
Five behavioral indexes were selected based on previous preliminary experiments: the relative velocity of the rat, relative position on the treadmill, sound stimulation time (as a percentage of the total time) electrical stimulation time (as a percentage of the total time), and slippage time (as a percentage of the total time).
The method by which relative velocity was measured varied according to the following three scenarios. First method: when the marked midpoint of the rat’s body was < 39 cm away from the board in front of the treadmill (measured using the scale marked on the enclosure), velocity was equal to the change in distance of the midpoint of the rat between the 10th frame and 1st frame photographed, over time. Second method: if a rat slipped off the treadmill, the calculated velocity was equal to the actual velocity of the rat minus the velocity of the treadmill belt. When there were > 5 frames with a marked midpoint distance ≥ 39 cm from the board (out of the 10 frames photographed in 1 second), velocity needed to be calculated. The first method was applied to frames when the rat’s marked midline distance was < 39 cm from the board in front of the treadmill, while the second method was used in frames where the rat’s midline distance was ≥ 39 cm from the board. The weighted average of the proportion of the number of frames to total frames was then calculated. The ratio of the number of frames to total frames was then calculated in accordance with the weighted average method.
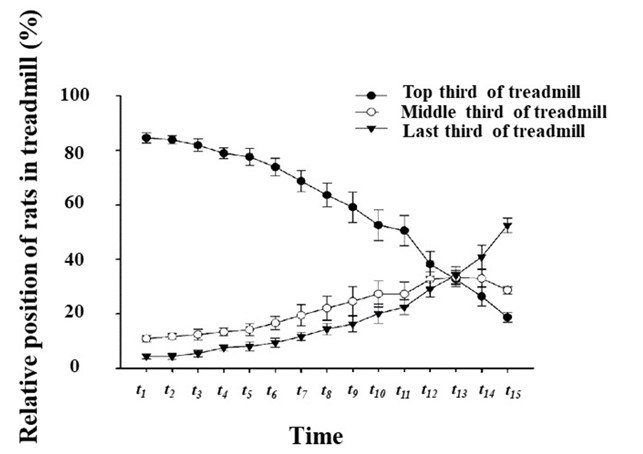
The relative position of the rat on the treadmill was divided into three parts, as shown in Figure 1. If the midpoint of the rat was within range a, the rat was considered to be in the front third of the treadmill. If the midpoint was within range b, the rat was considered to be in the central third of the treadmill. Finally, if the midpoint was within range c, the rat was considered to be in the rear third of the treadmill. The lengths of a, b and c were equal to (the total length of the treadmill – the rat’s body length) divided by 3.
The sound stimulation time as a percentage of the total time = (sound stimulation duration/total duration) × 100. The same calculation method was used to determine the percentage time of electrical stimulation and the percentage time of slippage, by substituting the value of sound stimulation duration for the value of electrical stimulation duration or slippage duration.
DATA ANALYSIS
KMPlayer (Pandora TV) was used to capture the video images at a frequency of 10 frames/sec, so that the positions of the marked midpoint and tail roots of the rats could be recorded for each screenshot. The relative velocity, sound stimulation, electrical stimulation, and number of slippage frames in each second were calculated using the marked midpoint position. SPSS Statistics 19.0 was used to analyze the statistical data, the results of which are shown as mean ± standard deviation. Repeated-measures analysis of variance and the least significant differences test were performed to identify significant differences in heart rate. The relative position of the rat in relation to the treadmill, during each time period, was compared using the Chi-square test, and P values < 0.05 indicated a significant difference. The mathematical formula was established using the polynomial curve fitting method.
RESULTS
DIVISION OF EXERCISE-INDUCED FATIGUE BY TIME
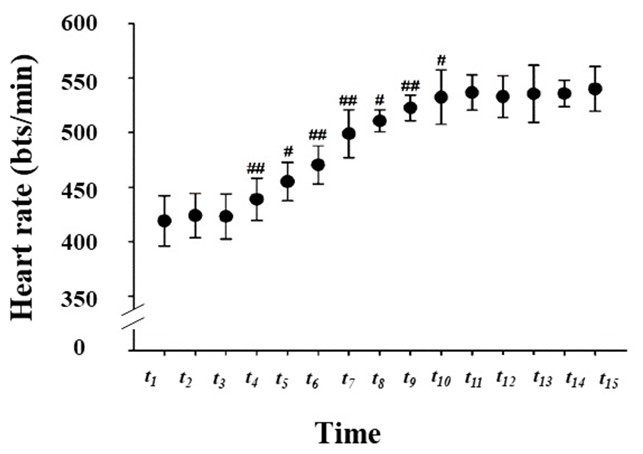
Since the exercise-induced fatigue time varied among rats, we divided the duration of exercise-induced fatigue into 15 time periods to facilitate statistical analysis. We defined the total exercise time as t. The loading time of levels I and II were both 15 min. The exercise time of each rat was identical (5 min), as represented by t1, t2, t3, t4, t5, and t6. When rats were subjected to the level III load, the exercise time of each rat was divided into nine periods represented by t7-t15.
CHANGES IN HEART RATE OF THE RATS DURING EXERCISE-INDUCED FATIGUE
The study results show that the rat’s average resting heart rate was 398 beats/min. Throughout the study, the minimum heart rate (419 ± 23 beats/min) was seen in period t1, while the maximum value (540 ± 21 beats/min) appeared in period t15. During the development of exercise-induced fatigue, there were no significant fluctuations in heart rate in periods t1–t3. When the load changed from level I to level II (that is, during periods t4–t6), the heart rate tended to increase rapidly to start with and became more stable at later points. During periods t4–t6, heart rate significantly increased from one time period to the subsequent time period (P < 0.05). The reason for this phenomenon may be that the treadmill velocity was low during periods t1–t3 (8.2 m/min), and therefore in period t1, the cardiac output could be increased to match the body’s needs. Due to the great increase in treadmill velocity starting in the t4 period, the exercise intensity increased significantly; thus, heart rate significantly increased as well (P < 0.05). However, the physiological requirements could not be supported by a single increase in heart rate. Hence, the heart rates were constantly increasing during periods t4–t6. As the treadmill velocity further increased at period t7, there were statistically significant differences in the heart rate between each time period and the subsequent time period (P < 0.01). In addition, this upward trend in heart rate continued to period t10. During periods t11–t15, the heart rate remained relatively stable, indicated by a plateau on the image. This might be because the increase in heart rate had reached its limit and the cardiac input had therefore reached its maximum. If heart rate continued to increase, it may cause a decline in cardiac output because of the decreasing stroke volume. Regarding two adjacent periods, there was a statistically significant increase in heart rate when comparing t4, t6, t7, and t9with t3, t5, t6, and t8, respectively (P < 0.01). Statistical significance was also identified when comparing t5, t8, and t10with t4, t7, and t9(P < 0.05), as shown in Figure 2.

By calculating the heart rate in each period as a percentage of the mean maximum heart rate over the entire experiment, the results showed that the heart rate during periods t1–t6increased from 77.59% to 87.22% of the maximum. In period t7, the heart rate began to exceed 90% of the maximum and continued to increase until period t11. During periods t11–t15, the heart rate remained at > 98% of the maximum (TableⅠ).
CHANGES IN BEHAVIORAL INDEXES DURING TREADMILL RUNNING
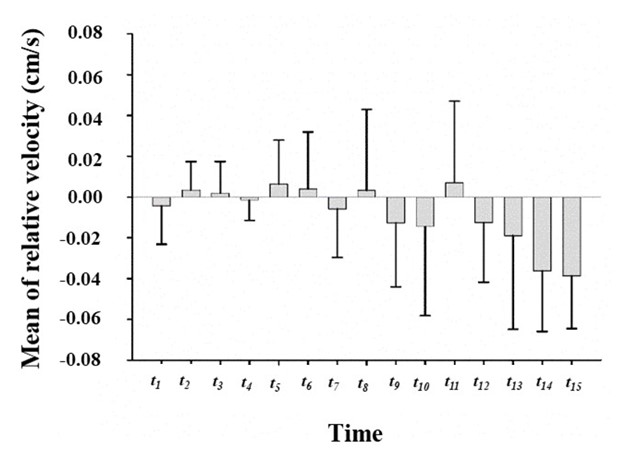
Changes in relative velocity
Significant time-dependent differences were found when studying relative velocity. During periods t1–t6, the relative velocity fluctuates only slightly, indicating relative stability. As exercise time increased, the exercise capacity of the rats gradually decreased. Moreover, the fluctuations in relative velocity became increasingly large with time.
To develop a clearer understanding of the relative velocity in rats at different time points, we conducted further statistical analyses. The results in Figure 3 demonstrate the relative velocity of the rats during each time period. During periods t1–t6, the velocity of rats was higher than the treadmill velocity, except for minor decreases in periods t1(-0.0043 cm/s) and t4(-0.0015 cm/s). The reasons for these slight decreases may be that the rats were temporarily unable to keep up with the treadmill due to the rapid changes in velocity. Large positive and negative fluctuations in the velocities of rats appeared in period t7, with most fluctuations being negative. As exercise time increased, the velocity of the rats further decreased until exhaustion. The maximum value of relative velocity, which was 0.0071 cm/s, appeared in period t11. The minimum relative velocity, which was -0.0387 cm/s, appeared in period t15.

These results suggest that the rats were in good physical condition during the initial exercise stage and that fatigue had not yet been reached; however, as the exercise continued, rats could not keep up with the treadmill, and the fatigue accumulated. Period t7was the point at which exercise-induced fatigue began to accumulate.
Changes in the positions of rats relative to the treadmill
The positions of the rats relative to the treadmill changed significantly as exercise time increased. When the exercise began, the rats mostly stayed in the front and middle thirds of the treadmill. As the exercise progressed, the percentage of rats in the rear third of the treadmill gradually increased, showing a highly negative correlation (r2 = 0.960). We used the Chi-square test to compare the relative positions of the rats in the different time periods with the corresponding position in period t1. The results showed that the relative positions of the rats after period t6were significantly different to those in t1(P < 0.05). After period t7the relative position of the rats was significantly different to their initial position, and there was a significant decline in the physical condition of the rats in period t7. Thereafter, exercise-induced fatigue began to accumulate. Meanwhile, the results showed no significant difference between the two groups in terms of the positions of the rats in relation to the treadmill, except in periods t12versus t11, and t9versus t8(P < 0.01). This indicates that the exercise-induced fatigue of rats accumulated step by step over the majority of periods, and that quantitative changes correlated with qualitative changes. In certain periods, fatigue accumulated rapidly, while in other periods, it was more gradual (Figure 4).

Sound stimulation, electrical stimulation, and slippage time as percentages of the total experimental time
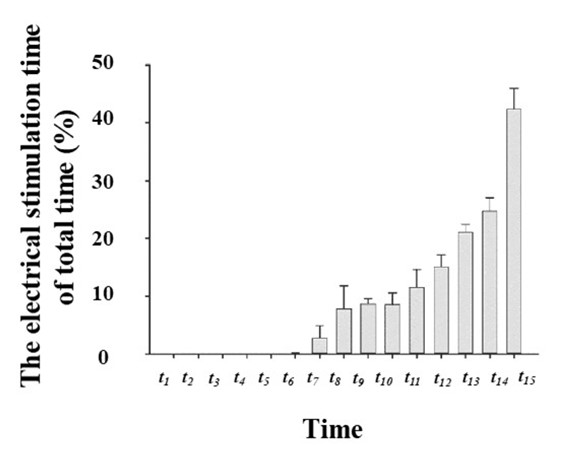
Sound and electrical stimulations are frequently used on animal treadmills to motivate rats to keep exercising. The principle behind this is that the animal’s instinctive fear of sounds and electrical shocks causes them to continue running. In the early stages of exercise-induced fatigue, the rat’s response to electrical shock was to immediately accelerate forward to rapidly escape from the electrical stimulation area. As exercise time increased, the degree of fatigue increased. Accordingly, the rats could not escape before they slipped into the electrical stimulation area. This period was called the slippage time. Electrical stimulation was accompanied by sound stimulation when the rats slipped further behind (when the marked point of the root of the tail was ≥ 34 cm away from the board in front of the treadmill). Compared with physiological and biochemical indicators, the behavioral indexes mentioned above may more accurately reflect the physical conditions of the experimental animals.
Our study results showed that the duration of sound and electrical stimulation, as well as slippage time, all gradually increased with exercise time. Among them, the duration of sound stimulation time, as a percentage of the total time, was 0.364% in period t1and 70.159% in period t15(Figure 5). In addition, rats were not subjected to electrical stimulation during periods t1–t4. By period t15, the electrical stimulation time accounted for 45.808% of the total time (Figure 6). Finally, no rat slipped off the treadmill during periods t1–t5. However, by period t15, the proportion of slippage time reached 33.947% (Figure 7).


In this study, these three parameters reflected the progressive increase in the fatigue levels of the rats. Sound stimulation was the first one to be triggered, followed by electrical stimulation, and finally slippage.
ANALYSIS OF CORRELATIONS BETWEEN HEART RATE, EXERCISE LOAD AND BEHAVIORAL INDEXES
Correlation analysis of heart rate, exercise load and behavioral indexes is shown in Figure 8. The correlation between heart rate and relative velocity (r2 = -0.37,P < 0.05), heart rate and exercise load (r2 = 0.85,P < 0.05), heart rate and total time of sound stimulation (r2 = 0.63,P < 0.05), heart rate and total time of electrical stimulation (r2 = 0.53,P < 0.05), and heart rate and total slippage time (r2 = 0.41,P < 0.05) is shown in a, b, c, d and e, respectively.

DISCUSSION
The mechanism behind exercise-induced fatigue is a significant topic in the field of sports physiology. Some studies have indicated that fatigue during prolonged exercise may be influenced by the activity of the brain serotonergic system, and this is referred to as the “central fatigue hypothesis” (NewsholmeNEWSHOLME EA, BLOMSTRAND E and EKBLOM B. 1992. Physical and mental fatigue: metabolic mechanisms and importance of plasma amino acids. Br Med Bull 48(3): 477-495. et al. 1992). Other studies suggest that the mechanism is similar to that of neuromuscular fatigue, which is a reversible, time-dependent decline in the maximal force-generating capacity of a muscle (VernilloVERNILLO G, TEMESI J, MARTIN M and MILLET GY. 2018. Mechanisms of fatigue and recovery in upper versus lower limbs in men. Med Sci Sports Exerc 50(2): 334-343. et al. 2018, GandeviaGANDEVIA SC. 2001. Spinal and supraspinal factors in human muscle fatigue. Physiol Rev 81(4): 1725-1789. 2001, KennedyKENNEDY DS, MCNEIL CJ, GANDEVIA SC and TAYLOR JL. 2016. Effects of fatigue on corticospinal excitability of the human knee extensors. Exp Physiol 101(12): 1552-1564. et al. 2016). Therefore, establishing and evaluating an acute exercise-induced fatigue animal model that explores the limits of the motor system may provide greater insight into these mechanisms. An accurate model might indicate how the motor system deteriorates during sustained activity, and how the CNS might cope with this reduction in motor performance during exercise-induced fatigue (RodriguesRODRIGUES JP, MASTAGLIA FL and THICKBROOM GW. 2009. Rapid slowing of maximal finger movement rate: fatigue of central motor control. Exp Brain Res 196(4): 557-563. et al. 2009). Frequently used models include increased loading swimming exercise, or a single bout of exhaustive exercise on a treadmill (HouHOU L, CHENG J, WANG X , ZHANG S, LIU X and QIAO D. 2017. Exercise-induced fatigue influenced striatal neuron’s synaptic ultrastructure and D2DR intervention role in rat. China Sport Science 37(06): 62-68. et al. 2005, LiuLIU X, SHI K and QIAO D. 2014. Effects of exercise on striatum’s neuronal activity in rats with Parkinson’s disease. J of Beijing Sport University 5(37): 57-61. et al. 2012). In addition, some models were not restricted to studies of fatigue. An 8-week, middle intensity voluntary wheel study has been used to investigate depressive-like behavior, and a treadmill model has been used to study the effects of exercise on striatum neuronal activity in rats with Parkinson’s Disease (Liu et al. 2014, TangTANG W, MCDOWELL K, LIMSAM M, NEERCHAL NK, YAROWSKY P and TASCH U. 2010. Locomotion analysis of Sprague-Dawley rats before and after injecting 6-OHDA. Behav Brain Res 210(1): 131-133. et al. 2010, MadeteMADETE JK, KLEIN A, DUNNETT SB and HOLT CA. 2011. Three-dimensional motion analysis of postural adjustments during over-ground locomotion in a rat model of Parkinson’s disease. Behav Brain Res 220(1): 119-125. et al. 2011, AsakawaASAKAWA T et al. 2016. Animal behavioral assessments in current research of Parkinson’s disease. Neurosci Biobehav Rev 65: 63-94. et al. 2016). Other studies have used voluntary wheel running exercise to study depressive-like behavior and rehabilitation (ZhaoZHAO Y and FU Y. 2017. Effects of voluntary wheel running exercise on depressive-like behavior and circadian rhythmic alterations of neuroendocrine induced by chronic unpredictable mild stress in rats. Chin J Pathophys 33(10): 1751-1758. and Fu 2017); rat or dog models to study spinal cord injury (JinJIN Y, BOUYER J, SHUMSKY JS, HAAS C and FISCHER I. 2016. Transplantation of neural progenitor cells in chronic spinal cord injury. Neuroscience 320: 69-82. et al. 2016, SunSUN Y, LIU D, SU P, LIN F and TANG Q. 2016. Changes in autophagy in rats after spinal cord injury and the effect of hyperbaric oxygen on autophagy. Neurosci Lett 618: 139-145. et al. 2016, LeeLEE SH, KIM Y, RHEW D, KUK M, KIM M, KIM WH and KWEON OK. 2015. Effect of the combination of mesenchymal stromal cells and chondroitinase ABC on chronic spinal cord injury. Cytotherapy 17(10): 1374-1383. et al. 2015); and rodent models to study arthritic disorders (LakesLAKES EH and ALLEN KD. 2016. Gait analysis methods for rodent models of arthritic disorders: reviews and recommendations. Osteoarthritis Cartilage 24(11): 1837-1849. and Allen 2016). All in all, establishing a model to study the effect of exercise-induced fatigue on physical and biochemical indexes may help to reveal the mechanisms behind it development (WenWEN X, PAN H and FENG Y. 2009. Establishment of a rat model of Exercise-Induced fatigue. Acta Lab Anim Sci Sin 17(5): 368-373. et al. 2009).
Heart rate is an important indicator of physiological response in vivo, and can reflect a variety of physiological changes. Changes in heart rate during exercise indicate acute responses, as well as long-term adaptations of the body. Due to the linear relationship between heart rate and exercise intensity (PortierPORTIER H, LOUISY F, LAUDE D, BERTHELOT M and GUÉZENNEC CY. 2001. Intense endurance training on heart rate and blood pressure variability in runners. Med Sci Sports Exerc 33(7): 1120-1125. et al. 2001, JamesJAMES DV, BARNES AJ, LOPES P and WOOD DM. 2002. Heart rate variability: response following a single bout of interval training. Int J Sports Med 23(4): 247-251. et al. 2002), an increase in exercise intensity results in an increase in the body’s energy consumption and subsequent oxygen demand. An increase in cardiac output is then necessary to supply oxygenated blood to the tissues of the body in order to meet this demand. As such, heart rate is both a physiological and prognostic indicator of health (OlivaOLIVA F et al. 2018. Heart rate as a prognostic marker and therapeutic target in acute and chronic heart failure. Int J Cardiol 15(253): 97-104. et al. 2018). A simple and accurate marker of exercise status, such as heart rate, would be a valuable tool for indicating the level of recovery or adaptation of an athlete, recognizing exercise-induced fatigue, and for facilitating adjustments in training load (BellengerBELLENGER CR, THOMSON RL, HOWE PR, KARAVIRTA L and BUCKLEY JD. 2016. Monitoring athletic training status using the maximal rate of heart rate increase. J Sci Med Sport 19(7): 590-595. et al. 2016, TrounsonTROUNSON KM, ROBERTS S, BALLOCH A and WARMINGTON SA. 2017. Light exercise heart rate on-kinetics: a comparison of data fitted with sigmoidal and exponential functions and the impact of fitness and exercise intensity. Physiol Rep 5(12): 13312-13340. et al. 2017). There is also a significant link between heart rate and behavior, as demonstrated by the rat model presented here. Furthermore, heart rate is a particularly crucial parameter in the evaluation of sports training. An exercise with an inappropriate range of heart rate can cause damage to the human body and even lead to overtraining syndrome (JeukendrupJEUKENDRUP AE, HESSELINK MK, SNYDER AC, KUIPERS H and KEIZER HA. 1992. Physiological changes in male competitive cyclists after two weeks of intensified training. Int J Sports Med 13(7): 534-541. et al. 1992, LehmannLEHMANN M, BAUMGARTL P, WIESENACK C, SEIDEL A, BAUMANN H, FISCHER S, SPÖRI U, GENDRISCH G, KAMINSKI R and KEUL J. 1992. Training-over-training: influence of a defined increase in training volumes vs training intensity on performance, catecholamine and some metabolic parameters in experienced middle and long-distance runners. Br J Sports Med 26(4): 233-242. et al. 1992, Lehmann et al. 1991). It is therefore essential to use heart rate to monitor exercise load (HofmannHOFMANN P and TSCHAKERT G. 2011. Special needs to prescribe exercise intensity for scientific studies. Cardiol Res Pract (10): 1-10. and Tschakert 2011). Researchers have compared the accuracy of some heart rate monitoring devices, such as the Polar M600 optical heart rate sensor, and electrocardiogram during various physical activities to establish which device provides the most precise measurement of heart rate (HortonHORTON JF, STERGIOU P, FUNG TS and KATZ L. 2017. Comparison of polar M600 optical heart rate and ECG Heart rate during exercise. Med Sci Sports Exerc 49(12): 2600-2607. et al. 2017, MedinaMEDINA QUERO J, FERNÁNDEZ OLMO MR, PELÁEZ AGUILERA MD and ESPINILLA ESTÉVEZ M. 2017. Real-time monitoring in home-based cardiac rehabilitation using wrist-worn heart rate devices. Sensors (Basel) 17(12): 2892-2928. Quero et al. 2017).
The study presented here indicates that changes in heart rate during exercise are not consistent between different time periods. There were no significant fluctuations in heart rate during periods t1–t3. During periods t4–t6the heart rate tended to increase rapidly to begin with, and then be maintained later. During periods t11–t15, heart rate remained relatively stable, indicating a plateau phase. The heart rates generally increased with exercise intensity, until this plateau was reached. Moreover, to correlate the behavioral and heart rate changes in rats during the exercise-induced fatigue process, the duration of sound stimulation, electrical stimulation, and slippage times within 60 s (1 min), 300 s (5 min), and 600 s (10 min), were collected to produce a function fit curve. The results showed that the goodness-of-fit for results obtained over 600 s was optimal. Thus, 600 s was chosen as the time cycle. We developed the following formula, using these parameters, to calculate a fatigue score:
xa represents the cumulative duration of sound stimulation (in seconds) within 600 s; xb represents the cumulative duration of electrical stimulation (in seconds) within 600 s; xc represents the cumulative slippage time (in seconds) within 600 s; and y represents the fatigue score within 600 s. By substituting the experimental data into the formula, we obtained the fatigue score.
Our laboratory used a model which has been utilized by a number of researches. Exercise-induced fatigue has been found to decrease the total exercise distance of rats (Hou et al. 2017), as well as reduce the levels of lactate dehydrogenase, BU, MDA, GLU and reduce the activity of superoxide dismutase. The activity of creatine kinase in peripheral blood has been found to increase with exercise-induced fatigue (Liu et al. 2012). A study recording the spontaneous activities of external segments of the Globus pallidus (GPe) neurons in rats after one-time exhaustive exercise, by extracellular measurements and glass microelectrode, found that HFP neuron percentage significantly decreased, while LFB neuron percentage significantly increased (Hou et al. 2015). In addition, the dorsolateral striatum synaptic density of fatigued rats decreased (Hou et al. 2017). The M1 and striatum α and β band power spectral density was higher than the control group, and the expression of dopamine receptor D2 (D2DR) protein decreased (Hou et al. 2018). However, administering a D2DR agonist increased the exhaustion time (Hou et al. 2017). Another study investigating the concentration of GABA,Glu, the expression of GABAARα1 and GluR2 in rat Globus pallidus (GP) during one-time exhaustive exercise, found that the concentrations of these proteins were significantly increased during fatigue state, in comparison with resting state (QiaoQIAO D, ZHANG J, HOU L and LIU X. 2015. Regulation effect of GABA and Glu in rat Globus pallidus during exhaustive exercise. J of Shenyang Sport University 34(2): 82-86. et al. 2015). The same trend was observed in another study investigating the modulatory effect of the ‘SNr-VL-SMA’ pathway during exhaustive exercises. At the beginning of the fatigue period and exhaustive stage, the dominant frequency of SNr increased and the amplitude decreased. The power of the α band increased significantly and the neural activity increased (Hu et al. 2013). Both the peripheral and central nervous system of animals can reach a state of fatigue. The exercise-induced fatigue model developed in this study can establish and evaluate acute exercise-induced fatigue in rats.
CONCLUSION
Heart rate is a valuable parameter for evaluating the physiological changes resulting from fatigue development. This study identified a linear relationship between heart rate and exercise intensity, with a plateau in heart rate occurring during later periods. Moreover, we compared heart rate with behavioral indexes to successfully establish a simple nonlinear regression formula to evaluate the degree of fatigue in rats using a mathematical modeling method of polynomial fitting. We believe that the results shown here will serve as an effective reference for the modeling of exercise-induced fatigue. In addition, this study also provides a theoretical method for analyzing the correlation between peripheral and central parameters.
ACKNOWLEGMENTS
This study was supported by the National Natural Science Foundation of China (31401018, 31971095), National Education Science Planning Fund (GLA102002), and Fundamental Research Funds for the Central Universities (SKZZB2014025).
REFERENCES
- ASAKAWA T et al. 2016. Animal behavioral assessments in current research of Parkinson’s disease. Neurosci Biobehav Rev 65: 63-94.
- BELLENGER CR, THOMSON RL, HOWE PR, KARAVIRTA L and BUCKLEY JD. 2016. Monitoring athletic training status using the maximal rate of heart rate increase. J Sci Med Sport 19(7): 590-595.
- GANDEVIA SC. 2001. Spinal and supraspinal factors in human muscle fatigue. Physiol Rev 81(4): 1725-1789.
- HOFMANN P and TSCHAKERT G. 2011. Special needs to prescribe exercise intensity for scientific studies. Cardiol Res Pract (10): 1-10.
- HORTON JF, STERGIOU P, FUNG TS and KATZ L. 2017. Comparison of polar M600 optical heart rate and ECG Heart rate during exercise. Med Sci Sports Exerc 49(12): 2600-2607.
- HOU L, CHENG J, WANG X , ZHANG S, LIU X and QIAO D. 2017. Exercise-induced fatigue influenced striatal neuron’s synaptic ultrastructure and D2DR intervention role in rat. China Sport Science 37(06): 62-68.
- HOU L, LIN R, LIU X and QIAO D. 2015. Changes of spontaneous Activity of external segments of globus pallidus neurons in rat after exhaustive exercise. J of Xi’an physical education University 32(2): 196-200.
- HOU L, LIU X and QIAO D. 2005. The establishment of exercise-induced fatigue model in rats. Laboratory Animal Science 22(1): 1-3.
- HOU L, WANG X, CHENG J, LI K, SHI K, ZHANG J, LIU X and QIAO D. 2018. Influence of exercise-induced fatigue on LFPs oscillation activity of M1-striatum pathway and DA signals on rats. China Sport Science 38(04): 45-53.
- HU Y, LIU X and QIAO D. 2013.The modulatory effect of ‘SNr-VL-SMA’ pathway during the exhaustive exercises in rats. J of shanghai university of sport 37(5): 57-62.
- JAMES DV, BARNES AJ, LOPES P and WOOD DM. 2002. Heart rate variability: response following a single bout of interval training. Int J Sports Med 23(4): 247-251.
- JEUKENDRUP AE, HESSELINK MK, SNYDER AC, KUIPERS H and KEIZER HA. 1992. Physiological changes in male competitive cyclists after two weeks of intensified training. Int J Sports Med 13(7): 534-541.
- JIN Y, BOUYER J, SHUMSKY JS, HAAS C and FISCHER I. 2016. Transplantation of neural progenitor cells in chronic spinal cord injury. Neuroscience 320: 69-82.
- KENNEDY DS, MCNEIL CJ, GANDEVIA SC and TAYLOR JL. 2016. Effects of fatigue on corticospinal excitability of the human knee extensors. Exp Physiol 101(12): 1552-1564.
- KNUTTGEN HG. 1983. Biochemistry of Exercise. Human Kinetics Publishers. Glossary of Exercise Terminology.
- KRUK MR. 1997. Measuring behavior into the twenty-first century. TINS 20(5): 187-189.
- LAKES EH and ALLEN KD. 2016. Gait analysis methods for rodent models of arthritic disorders: reviews and recommendations. Osteoarthritis Cartilage 24(11): 1837-1849.
- LEE SH, KIM Y, RHEW D, KUK M, KIM M, KIM WH and KWEON OK. 2015. Effect of the combination of mesenchymal stromal cells and chondroitinase ABC on chronic spinal cord injury. Cytotherapy 17(10): 1374-1383.
- LEHMANN M, BAUMGARTL P, WIESENACK C, SEIDEL A, BAUMANN H, FISCHER S, SPÖRI U, GENDRISCH G, KAMINSKI R and KEUL J. 1992. Training-over-training: influence of a defined increase in training volumes vs training intensity on performance, catecholamine and some metabolic parameters in experienced middle and long-distance runners. Br J Sports Med 26(4): 233-242.
- LEHMANN M, DICKHUTH HH, GENDRISCH G, LAZAR W, THUM M, KAMINSKI R, ARAMENDI JF, PETERKE E, WIELAND W and KEUL J. 1991. Training-over-training: a prospective, experimental study with experienced middle- and long-distance runners. Int J Sports Med 12(5): 444-452.
- LI JY, KUO TB, HSIEH SS and YANG CC. 2008. Changes in electroencephalogram and heart rate during treadmill exercise in the rat. Neurosci Let 43499(2): 175-178.
- LIU X, LUO Y and QIAO D. 2012. Establishment and dynamic evaluation of a rat model of one single bout of exhaustive exercise on treadmill. Acta Lab Anim Sci Sin 20(3) 25-28.
- LIU X, SHI K and QIAO D. 2014. Effects of exercise on striatum’s neuronal activity in rats with Parkinson’s disease. J of Beijing Sport University 5(37): 57-61.
- MADETE JK, KLEIN A, DUNNETT SB and HOLT CA. 2011. Three-dimensional motion analysis of postural adjustments during over-ground locomotion in a rat model of Parkinson’s disease. Behav Brain Res 220(1): 119-125.
- TANAKA M, NAKAMURA F, MIZOKAWA S, MATSUMURA A, NOZAKI S and WATANABE Y. 2003. Establishment and assessment of a rat model of fatigue. Neurosci Let 352(3): 159-162.
- MEDINA QUERO J, FERNÁNDEZ OLMO MR, PELÁEZ AGUILERA MD and ESPINILLA ESTÉVEZ M. 2017. Real-time monitoring in home-based cardiac rehabilitation using wrist-worn heart rate devices. Sensors (Basel) 17(12): 2892-2928.
- NEWSHOLME EA, BLOMSTRAND E and EKBLOM B. 1992. Physical and mental fatigue: metabolic mechanisms and importance of plasma amino acids. Br Med Bull 48(3): 477-495.
- OLIVA F et al. 2018. Heart rate as a prognostic marker and therapeutic target in acute and chronic heart failure. Int J Cardiol 15(253): 97-104.
- PORTIER H, LOUISY F, LAUDE D, BERTHELOT M and GUÉZENNEC CY. 2001. Intense endurance training on heart rate and blood pressure variability in runners. Med Sci Sports Exerc 33(7): 1120-1125.
- QIAO D, ZHANG J, HOU L and LIU X. 2015. Regulation effect of GABA and Glu in rat Globus pallidus during exhaustive exercise. J of Shenyang Sport University 34(2): 82-86.
- RODRIGUES JP, MASTAGLIA FL and THICKBROOM GW. 2009. Rapid slowing of maximal finger movement rate: fatigue of central motor control. Exp Brain Res 196(4): 557-563.
- SUN Y, LIU D, SU P, LIN F and TANG Q. 2016. Changes in autophagy in rats after spinal cord injury and the effect of hyperbaric oxygen on autophagy. Neurosci Lett 618: 139-145.
- TANG W, MCDOWELL K, LIMSAM M, NEERCHAL NK, YAROWSKY P and TASCH U. 2010. Locomotion analysis of Sprague-Dawley rats before and after injecting 6-OHDA. Behav Brain Res 210(1): 131-133.
- TIAN Y and GAO T. 1995. The Establishment of Exercise-induced Fatigue Models in Rats. J of Beijing University of Physical Education 18(4): 49-53.
- TROUNSON KM, ROBERTS S, BALLOCH A and WARMINGTON SA. 2017. Light exercise heart rate on-kinetics: a comparison of data fitted with sigmoidal and exponential functions and the impact of fitness and exercise intensity. Physiol Rep 5(12): 13312-13340.
- VERNILLO G, TEMESI J, MARTIN M and MILLET GY. 2018. Mechanisms of fatigue and recovery in upper versus lower limbs in men. Med Sci Sports Exerc 50(2): 334-343.
- WEN X, PAN H and FENG Y. 2009. Establishment of a rat model of Exercise-Induced fatigue. Acta Lab Anim Sci Sin 17(5): 368-373.
- ZHAO Y and FU Y. 2017. Effects of voluntary wheel running exercise on depressive-like behavior and circadian rhythmic alterations of neuroendocrine induced by chronic unpredictable mild stress in rats. Chin J Pathophys 33(10): 1751-1758.
Publication Dates
-
Publication in this collection
02 Dec 2019 -
Date of issue
2019
History
-
Received
17 Sept 2018 -
Accepted
23 Jan 2019