Abstract
The materials that compose a construction system influence directly the acoustic performance of buildings.In masonry systems, through experiments, the geometry of the blocks and the types of coating were perceived as fundamental factors on the acoustic performance of walls. Therefore, this study intends to enrich the database and promote analysis for the civil construction industry by evaluating the airborne sound reduction of masonry walls composed by ceramic blocks with and without mortar coating. Accordingly, different partitions made of different ceramic blocks were built to determine the performance discrepancies in the partitions’ behavior due to physical characteristics and the influence of the mortar coating. These analyses were made in laboratory. As a result, without coating, the highest sound reduction was observed in the samples with more bulk mass and higher Aliq/At ratio (relationship between the net and gross areas of the ceramic blocks). Then, with the mortar coating, the coating improved the sound reduction. Moreover, the bulk mass was the most influential characteristic in comparison to the Aliq/At ratio, even though the best results were obtained in the samples with higher Aliq/At ratios.
Keywords:
Sound reduction index; Masonry wall systems; Acoustic performance; Ceramic blocks geometry
Resumo
Os materiais que compõem um sistema construtivo influenciam diretamente no desempenho acústico de edificações. Em sistemas de alvenaria, por meio de experimentos, a geometria dos blocos e os tipos de revestimento foram elencados como os fatores fundamentais no desempenho acústico de paredes. Portanto, este estudo tem o objetivo de enriquecer tal base de dados e promover análises para a indústria da construção civil por meio da avaliação da redução aos sons aéreos de paredes de alvenaria em blocos cerâmicos com e sem a aplicação de revestimento em argamassa. Para tal, diferentes sistemas de parede, compostos por blocos cerâmicos distintos, foram construídos para a determinação das diferenças de desempenho e comportamento dos sistemas devido às suas características físicas e a influência do revestimento em argamassa. Estas análises foram feitas em ambiente laboratorial. Como resultado, sem o revestimento, a maior redução sonora foi obtida nas amostras com maior massa superficial e maior relação A liq /A t (relação entre a área líquida e bruta dos blocos cerâmicos). Com o revestimento em argamassa a redução sonora foi aumentada. Neste caso, a massa superficial foi a característica mais influente, em comparação à relação A liq /A t , apesar de que os melhores resultados foram encontrados em amostras de maior relação A liq /A t .
Palavras-chave:
Índice de redução sonora; Sistemas de parede de alvenaria; Desempenho acústico; Geometria de blocos cerâmicos
Introduction
The acoustic performance of building construction materials is basically characterized by the capacity they have to reduce airborne or structure-borne sound transmission. Regarding the reduction against airborne noise, this feature is strongly dependent on the inertia, surface mass, stiffness and internal damping. This means it is expected that the use of heavy and robust systems, as concrete or masonry walls opposed to gypsum drywalls, will result in satisfactory sound insulation. Nevertheless, sound transmission through masonry walls is complex and careful attention to details is needed in order to avoid sound reduction deficiencies (HENDRY, 2001HENDRY, E. A. Masonry walls: materials and construction. Construction and Building Materials, v. 15, p. 323-330, 2001.; HOPKINS, 2007HOPKINS, C. Sound Insulation. Burlington: Elsevier, 2007.; JONES, 2009JONES, D. Acoustical treatment for indoor areas. In: BALLOU, G. M. Hanbook for Sound Engineers. 4th. ed. Oxford: Elsevier, 2009.; PATRICIO, 2010PATRICIO, J. Acústica nos edifícios. Lisbon: Verlag Dashofer, 2010.; SCHIAVONI et al., 2016SCHIAVONI, S. et al. Reduction materials for the building sector: a review and comparative analysis. Materials for Renewable and Sustainable Energy, v. 62, p. 988-1011, 2016. ).
In hollow blocks, the purpose of the holes is to increase the thermal reduction of vertical partitions and to lighten/facilitate the blocks´ handling, thus also reducing the buildings structural loads. The use of hollow elements also reduces the costs of materials in comparison with solid blocks. However, the core holes in the blocks can also increase the internal acoustic resonances within the blocks which´, in association with their lower surface mass, contribute to substantially diminish the sound reduction of the system. The geometry of the holes also influences the sound reduction index and can be checked by the ratio between the net and gross areas of the blocks as well as by their mass ratio which generate different sound transmission reduction curves (FRINGUELLINO; SMITH, 1999FRINGUELLINO, M.; SMITH, S. Sound transmission through hollow brick walls. Building Acoustics, v. 6, n. 3/4, p. 211-224, 1999.).
A precise estimation of the acoustic parameters of a wall composed of hollow ceramic bricks or blocks presents a number of difficulties. First, different clay compositions and curing processes change the material properties of the block or brick. Second, the block itself has several geometric diversities. Finally, the masonry walls as a whole built from the modular assembling of blocks and coated with plaster or mortar may suffer variations due to their compositions, workmanship and additives (JACQUS et al., 2011JACQUS, G. et al. A homogenised vibratory model for predicting the acoustic properties of hollow brick walls. Journal of Sound and Vibration, v. 330, p. 3400-3409, 2011.).
Literature review
The sound transmission loss of a masonry wall varies according to the frequency range and depends on the mass, inertia, internal damping and stiffness of the system. At low frequencies, where the first resonance frequency occurs, the wall vibrates as a whole and the corresponding sound reduction lies on the dimensions and stiffness of the wall. Then, in the medium frequency bands a wide frequency range is controlled by the surface mass of the system. This band range is known as the mass law and has a linear relationship between the sound transmission loss and the system mass. Therefore, within this range the sound transmission loss is determined considering an increase of 6 dB per octave band. At the end of the mass-controlled region the coincidence effect occurs at the critical frequency of the system and increases the sound transmission since the vibration velocity of the wall is equal to the sound wave speed in the air. In this range (medium to high frequency brands) the impingent sound waves easily transmit energy through the wall decreasing drastically the airborne sound insulation of the system. At high frequencies the sound transmission loss is controlled by the internal damping and increases 9 dB per octave band (WATTERS, 1959WATTERS, B. G. Transmission loss of some masonry walls. Journal of the Acoustical Society of America, v. 31, p. 989-911, 1959.; BARRON, 2003BARRON, R. F. Industrial Noise Control and Acoustics. New York: Marcel Dekker Inc., 2003.; BIES; HANSEN, 2009BIES, D. A.; HANSEN, C. H. Engineering Noise Control: theory and practice. 4th. ed. New York: Spon Press, 2009.; EVEREST; POHLMANN, 2015EVEREST, F. A.; POHLMANN, K. C. Master Handbook of Acoustics. 6th.ed. New York: McGraw-Hill Education, 2015.).
Accordingly, the sound reduction characteristics of hollow blocks are considered to be complex due to their alveolar structure. A wall composed of hollow blocks presents strong anisotropy, depending on the block design, showing different values of stiffness in each main direction. As in homogeneous systems where the coincidence effect occurs centrally at the critical frequency (fc) and within 2 or 3 octave adjacent frequency bands (characterizing a plateau effect) it is expected great losses in the sound insulation of the system. Due to the stiffness variation between the two main axes of masonry walls, the critical frequency has to be obtained for them both in order to investigate the probable range of frequencies affected by the coincidence effect. In general, the thinner the wall thickness higher will be the critical frequency and lower the general reduction (FRINGUELLINO; SMITH, 1999FRINGUELLINO, M.; SMITH, S. Sound transmission through hollow brick walls. Building Acoustics, v. 6, n. 3/4, p. 211-224, 1999.; HOPKINS, 2007HOPKINS, C. Sound Insulation. Burlington: Elsevier, 2007.; PATRICIO, 2010PATRICIO, J. Acústica nos edifícios. Lisbon: Verlag Dashofer, 2010.).
The final thickness of a wall ranges usually from 0.10 m to 0.40 m differing from internal and external walls and on the specific requirements for their use. As a consequence of greater dimensions, masonry walls with hollow elements may present a low sound reduction due to internal resonances. Generally, a deeper cavity associated with a greater mass result in a lower resonant frequency which commonly means an increase in sound reduction. However, this tendency has an exception at frequencies around 100 Hz where the sound reduction of the cavity surface diminishes in relation to the surface mass of the unfinished block. The resonant frequency in the mass-air-mass system is a specific frequency at which two layers of construction material separated by a space of air resound (WATTERS, 1959WATTERS, B. G. Transmission loss of some masonry walls. Journal of the Acoustical Society of America, v. 31, p. 989-911, 1959.; FRINGUELLINO; SMITH, 1999FRINGUELLINO, M.; SMITH, S. Sound transmission through hollow brick walls. Building Acoustics, v. 6, n. 3/4, p. 211-224, 1999.; HOPKINS, 2007HOPKINS, C. Sound Insulation. Burlington: Elsevier, 2007.; GUILLEN et al., 2008GUILLEN, I. et al. On the sound reduction of masonry wall façades. Building and Environment, v. 43, p. 523-529, 2008.).
Many blocks and bricks are considered heterogeneous and non-isotropic due to their internal cavities. These cavities reduce the mass per unit area, resulting in an orthotropic or anisotropic behavior, and establish sound fields of one, two or three dimensions in the plate. The cavities inside blocks and bricks are generally so small that such units do not originate modes within the usual frequency ranges of building acoustics. This behavior is characterized by a sharp sound reduction drop at the first resonance frequency occurring at low frequencies and a wider insulation loss at medium and high frequency bands at the coincidence region (HOPKINS, 2007HOPKINS, C. Sound Insulation. Burlington: Elsevier, 2007.; GUILLEN et al., 2008GUILLEN, I. et al. On the sound reduction of masonry wall façades. Building and Environment, v. 43, p. 523-529, 2008.; BIES; HANSEN, 2009BIES, D. A.; HANSEN, C. H. Engineering Noise Control: theory and practice. 4th. ed. New York: Spon Press, 2009.; PETERS; SMITH; HOLLINS, 2013PETERS, R. J.; SMITH, B. J.; HOLLINS, M. Acoustics and noise control. 3rd. ed. New Jersey: Taylor & Francis Group, 2013.; FAHY; THOMPSON, 2015FAHY, F.; THOMPSON, D. Fundamentals of sound and vibration. Boca Raton: Taylor & Francis Group, 2015.).
Likewise, the relationship between the stiffness and the critical frequency of a plate is established according to the velocity of bending waves in the plate, which depends on the bending stiffness and frequency. Therefore, at any given frequency the bending wave velocity is as much greater as the stiffness of the plate increases. This means that for a stiffer plate the frequency at which the waves on the plate reach the speed of sound in air is lower than for a less stiffer plate. In other words, the critical frequency decreases as the stiffness of the plate increases. For ceramics, the critical frequency of a plate with density of 1600 kg/m3 is the quotient of the constant 22.1 by the material thickness (HOPKINS, 2007HOPKINS, C. Sound Insulation. Burlington: Elsevier, 2007.; PETERS; SMITH; HOLLINS, 2013PETERS, R. J.; SMITH, B. J.; HOLLINS, M. Acoustics and noise control. 3rd. ed. New Jersey: Taylor & Francis Group, 2013.).
The types of mortar joints used in the laying of hollow blocks also influence the acoustic performance. For example, applying mortar joints on two faces of the blocks, instead of four, improves the work productivity but reduces sound reduction. Therefore, filling the horizontal and vertical joints of the blocks that compose the masonry wall is essential to guarantee an adequate soundproofing. This improves the airtightness of the system and can be reinforced by the use of plaster in both sides of the walls which fills the reminiscent voids and increase their surface mass and stiffness (FRINGUELLINO; SMITH, 1999FRINGUELLINO, M.; SMITH, S. Sound transmission through hollow brick walls. Building Acoustics, v. 6, n. 3/4, p. 211-224, 1999.; FERREIRA NETO; BERTOLI, 2010FERREIRA NETO, M. de F.; BERTOLI, S. R. Acoustic performance of ceramic brick and block walls: a comparative study between Brazil and Portugal. Ambiente Construído, Porto Alegre, v. 10, n. 4, p. 169-180, out./dez. 2010.; MAEKAWA; RINDEL; LORD, 2011MAEKAWA, Z.; RINDEL, J. H.; LORD, P. Environmental and Architectural Acoustics. 2nd .ed. New York: Taylor & Francis Group, 2011.; HOPKINS, 2017HOPKINS, C. Sound Insulation in Buildings. In: XIANG, N. Architectural Acoustics Handbook. Plantation: J. Ross Publishing, 2017.; RINDEL, 2018RINDEL, J. H. Sound Insulation in Buildings. Boca Raton: Taylor & Francis Group , 2018.).
Consequently, this study aims to expose the acoustic behavior and the performance of walls made with different geometry hollow ceramic structural blocks and the influence of mortar coating in relation to sound reduction against airborne noise. Furthermore, this paper evaluates the relationship between the geometry and typology of blocks as well as the changes caused by the mortar coating of the walls in the acoustic performance. In addition, the aim is to enrich the database and promote analysis that can help acoustic engineers in the prescription and development of this type of construction system.
Method
The study started by characterizing the blocks and the mortar used in the construction of the samples (walls). The sound transmission loss tests were conducted in laboratory and the samples were built in movable frames. The blocks were laid with horizontal and vertical mortar joints having a thickness of 1.0 cm. The wall samples had a curing time of 14 days before performing any test. After performing the sound reduction tests on the uncoated samples, a 2.0 cm of mortar layer was applied on each wall face, also with a curing time of 14 days until the tests have been done again.
The use of a movable frame in the construction of the samples allowed the curing of the mortar joints and coating outside the reverberation rooms, thus avoiding a humidity increase inside the rooms and providing an efficient curing process. The tests were conducted with similar environmental conditions and same construction method for all samples.
The fundamental variable considered in the tests was the type of ceramic blocks used in the confection of each sample. Each block sample had different raw materials, curing temperature, geometry and resistance which consequently varied their physical, mechanical and geometrical properties. In total, 7 samples composed of different types of hollow structural ceramic blocks were tested with and without mortar coating.
Ceramic blocks
Tests were conducted according to C67 (AMERICAN…, 2017AMERICAN SOCIETY FOR TESTING AND MATERIALS. C67: standard test methods for sampling and testing brick and structural clay tile. West Conshohocken, 2017.) to characterize the properties of the blocks. The area of the core holes inside the blocks was measured in order to determine the ceramic-only cross-section area of each block (net area - Aliq). This area was compared with the total area occupied by the external dimensions of each block section (gross area - At), as shown in Figure 1, by the means of the Aliq/Atratio which promotes the comparison between blocks with different cross section dimensions.
The adopted nomenclature, layout, dimensions and compressive strength of the blocks as well as the surface mass of the systems with and without mortar coating are shown in Table 1.
A prediction of the expected drop in the sound reduction spectrum caused by the coincidence effect which is related to the web thickness of the blocks, their hollow structure, surface mass and bending stiffness with and without coating was made. In order to estimate the frequency bands where the coincidence effect may probably occur the critical frequency (fc) was predicted by Equation 1 which considers the lowest incidental sound wave angle possible (most unfavorable case) and a diffuse sound field (WATTERS, 1959WATTERS, B. G. Transmission loss of some masonry walls. Journal of the Acoustical Society of America, v. 31, p. 989-911, 1959.; FRINGUELLINO; SMITH, 1999FRINGUELLINO, M.; SMITH, S. Sound transmission through hollow brick walls. Building Acoustics, v. 6, n. 3/4, p. 211-224, 1999.; BARRON, 2003BARRON, R. F. Industrial Noise Control and Acoustics. New York: Marcel Dekker Inc., 2003.; PATRICIO, 2010PATRICIO, J. Acústica nos edifícios. Lisbon: Verlag Dashofer, 2010.).
Where fc is the critical frequency, c is the speed of the sound in air, m is the surface mass of the system and D is the flexural bending stiffness of the system (obtained by the product of the moment of inertia and the elastic modulus of the materials that compose the system).
The critical frequency was calculated for the two main directions of the cross section of the systems, providing a lower and an upper limit frequency band, resulting in a range of frequency bands where the coincidence effect will probably occur. The critical frequencies of each sample with and without the mortar coating obtained by both main axes of their cross sections are showed by Table 2.
Mortar
The same stabilized mortar, with a workable window of 36 hours and composed by 1:5 (cement: sand, in volume) with 0.35% of air incorporator additive and 1.00% of handle retarder plasticizer additive (dosed upon the cement mass), was used for laying the blocks and coating. The mortar was characterized both in fresh and hardened conditions according to EN 1015-3 (EUROPEAN…, 1999aEUROPEAN STANDARD. EN 1015-3: methods of test for mortar for masonry: part 3: determination of consistence of fresh mortar (by flow table). Brussels, 1999a.), EN 1015-6 (EUROPEAN…, 1998EUROPEAN STANDARD. EN 1015-6: methods of test for mortar for masonry: part 6: determination of bulk density of fresh mortar. Brussels, 1998.), EN 1015-10 (EUROPEAN…, 1999bEUROPEAN STANDARD. EN 1015-10: methods of test for mortar for masonry: part 10: determination of dry bulk density of hardened mortar. Brussels, 1999b.) and EN 1015-11 (EUROPEAN…, 1999cEUROPEAN STANDARD. EN 1015-11: methods of test for mortar for masonry: part 11: determination of flexural and compressive strength of hardened mortar. Brussels, 1999c.) and the corresponding results are shown in Table 3.

Sound reduction tests
The sound reduction tests were performed in the reverberation rooms of the Acoustics Laboratory at itt Performance (Performance and Civil Construction Technological Institute), Unisinos University, in accordance with ISO 10140-5 (INTERNATIONAL…, 2010aINTERNATIONAL ORGANIZATION FOR STANDARDIZATION. ISO 10140-5: acoustics: laboratory measurement of sound reduction of building elements: part 5: requirements for test facilities and equipment. Geneva, 2010. ). In the facility, the source room had a volume of 62.3 m³ and the receiving room 59.1 m³. The receiving room had diffusers on the ceiling and the test specimen was 10.8 m² (Figure 2). The wall samples were made in removable test frames and placed between the two reverberation rooms without any rigid connection to either room. The test facility, the measurement techniques and equipment were certified by the requirements of ISO 17025 (INTERNATIONAL…, 2017INTERNATIONAL ORGANIZATION FOR STANDARDIZATION. ISO 17025: general requirements for the competence of testing and calibration laboratories. Geneva, 2017.) and ISO 12999-1 (INTERNATIONAL…, 2014INTERNATIONAL ORGANIZATION FOR STANDARDIZATION. ISO 12999-1: acoustics: determination and application of measurement uncertainties in building acoustics: part 1: sound reduction. Geneva, 2014.) through inter-laboratorial, reproducibility and repeatability tests.
Regarding the methods, the sound reduction tests were conducted according to ISO 10140-2 (INTERNATIONAL…, 2010bINTERNATIONAL ORGANIZATION FOR STANDARDIZATION. ISO 10140-2: acoustics: laboratory measurement of sound reduction of building elements: part 2: measurement of airborne sound reduction. Geneva, 2010.) and ISSO 10140-4 (INTERNATIONAL…, 2010cINTERNATIONAL ORGANIZATION FOR STANDARDIZATION. ISO 10140-4: acoustics: laboratory measurement of sound reduction of building elements: part 4: measurement procedures and requirements. Geneva, 2010.) in 1/3 octave bands between 100 and 5000 Hz. The measurements were taken in 12 different microphone positions and 2 distinct sound source positions for each parameter. Also, the measurement duration in each receiving position was 10 seconds for the determination of source and receiving rooms sound pressure levels. The reverberation time was obtained by the interrupted method with 3 decays per position. The weighted sound reduction index of the test samples was obtained by the method prescribed in ISO 717-1 (INTERNATIONAL…, 2013INTERNATIONAL ORGANIZATION FOR STANDARDIZATION. ISO 717-1: acoustics: rating of sound reduction in buildings and of building elements: part 1: airborne sound reduction. Geneva, 2013.).
The equipment used in the measurements was from Brüel&Kjaer and consisted of a dodecahedral loudspeaker type 4292-L, a power amplifier type 2734-A, a sound calibrator type 4231, an analyzer type 2270 and a microphone type 4189 with a pre-amplifier type ZC-0032. All the equipment had valid calibration certificates.
Results and discussion
Sound reduction index in 1/3 octavebands
The samples were compared on the basis of their similarities in block geometry, influencing the Aliq/At ratios, bending stiffness, critical frequencies and surface mass. The results obtained with the sound reduction tests performed on the samples without mortar coating are shown in Figure 3, in 1/3 octave bands, as well as the weighted sound reduction indexof each wall samples.
The samples 2U and 3U were made of blocks with the same Aliq/At ratio and similar surface mass varying only in the configuration of the cores. They presented an increase in sound reduction from 100 to 125 Hz, in the stiffness-controlled region, and a drop from 125 to 315 Hz. This drop was more evident in sample 3U probably due to the lack of damping caused by the filled external walls of the block. However, they show a broad frequency sound reduction dip as expected for hollow masonry walls (FRINGUELLINO; SMITH, 1999FRINGUELLINO, M.; SMITH, S. Sound transmission through hollow brick walls. Building Acoustics, v. 6, n. 3/4, p. 211-224, 1999.; HOPKINS, 2007HOPKINS, C. Sound Insulation. Burlington: Elsevier, 2007.; PATRICIO, 2010PATRICIO, J. Acústica nos edifícios. Lisbon: Verlag Dashofer, 2010.). In the mass-controlled region both samples show an unexpected behavior and the sample 3U had a greater sound reduction within the whole range. In sample 2, the drop in the reduction curve caused by the coincidence effect occurs within the range from 1250 to 1600 Hz, whereas in sample 3U this effect occurs from 1600 to 2000 Hz, being both inside the range predicted by the calculation of the critical frequency. Moreover, in the damping-controlled region the sample 3U had a greater sound reduction and differs from 2U in up to 5 dB. In conclusion, both walls had weighted sound reduction indexes that differ only 1 dB from each other.


When analyzing the samples 1U and 7U both blocks had similar geometric characteristics in terms of cores, however, they differ in the geometry of the hollow elements which yields for the sample 1U to have a greater flexural bending stiffness. Furthermore, both samples had a similar surface mass but differ in their Aliq/At ratio where the sample 1U has a 5% higher ratio. Comparing the sound reduction indexes of both samples the walls differ in 9 dB at 100 Hz where the sample 1U shows greater sound reduction which can be related to its higher bending stiffness. At 125 Hz the samples show similar sound reduction being the difference between them of only 2 dB. Subsequently, both samples sound reductions drop and present distinctive resonant frequencies: 200 Hz in the sample 1U and 250 Hz for sample 7U. Such behavior at the frequency bands around 100 Hz is explained in previous studies being a function of the stiffness, damping at the block boundaries and the resonance of the deepest air cavity. In the region controlled by the mass law sample 7U presents a better result in terms of sound reduction at most frequency bands. The coincidence effect occurred from 1250 up to 2500 Hz in the sample 1U, outstanding the upper limit predicted by the calculations and evidencing the complex behavior of non-homogenous systems. For the sample 7U the coincidence effect occurred at 1600 Hz being inside the predicted range for the critical frequency bands. Then, in the region controlled by the damping effect, the sample 7U presents a strong sound reduction increase. Therefore, these differences result in a 1 dB higher weighted sound reduction index for sample 7U (WATTERS, 1959WATTERS, B. G. Transmission loss of some masonry walls. Journal of the Acoustical Society of America, v. 31, p. 989-911, 1959.; HOPKINS, 2007HOPKINS, C. Sound Insulation. Burlington: Elsevier, 2007.; GUILLEN et al., 2008GUILLEN, I. et al. On the sound reduction of masonry wall façades. Building and Environment, v. 43, p. 523-529, 2008.; PETERS; SMITH; HOLLINS, 2013PETERS, R. J.; SMITH, B. J.; HOLLINS, M. Acoustics and noise control. 3rd. ed. New Jersey: Taylor & Francis Group, 2013.; FAHY; THOMPSON, 2015FAHY, F.; THOMPSON, D. Fundamentals of sound and vibration. Boca Raton: Taylor & Francis Group, 2015.).
Moreover, comparing the samples 4U, 5U and 6U which present a great number of cores and have Aliq/At ratios, surface masses and stiffness growing from sample 4U to 6U, in the stiffness-controlled region sample 6U shows better sound reduction than the others which can be explained by its higher stiffness. The resonant frequency can be spotted at the sharp dip at 250 Hz for sample 4U, 160 Hz for 5U and 315 Hz for 6U. In the mass-controlled zone the samples had similar sound reduction from 400 to 800 Hz. Above, in the mass-controlled range, sample 6U increases in sound reduction until 1250 Hz and 5U until 2000 Hz. For the sample 4U the coincidence effect can be detected on the basis of the accentuated dip from 1250 to 1600 Hz, being inside the predicted range of the critical frequency. For the sample 5U the coincidence effect occurred at 3150 Hz, being outside the predicted critical frequency range, and is slightly spotted at 1600 Hz in sample 6U (inside the predicted range). Then, the samples had the expected gain in terms of sound reduction in the damping-controlled region with no more than 2 dB difference between them. For these three samples the greatest weighted sound reduction index was obtained by sample 6U.
Furthermore, the Aliq/At ratio, bending stiffness and the surface mass of the blocks are greater in sample 7U. Both samples present equal sound reduction at 100 Hz but at 125 Hz the sample 7U, which is stiffer, had nearly a 6 dB increase, decreasing afterwards up to 250 Hz where both samples had the same resonant frequency. In the mass-controlled region, the behavior of both samples differs, with sample 7U having a higher sound reduction at almost all the frequency bands. The coincidence effect can be identified due to the sound reduction loss from 1250 to 1600 Hz in sample 4U and at 1600 Hz in sample 7U (as predicted by the estimation of the critical frequencies for both samples). Later, the samples show the expected gains in the damping-controlled region. In conclusion, sample 7U had the greatest sound reduction in the majority of the frequency bands which can be associated to its higher stiffness and Aliq/At ratio resulting in the greatest weighted sound reduction index.
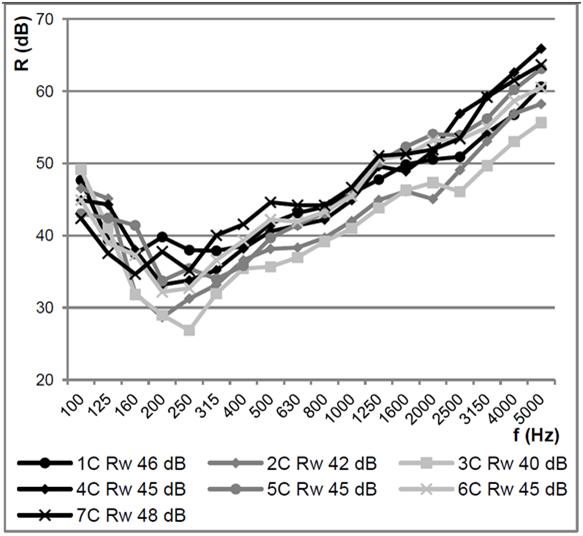
Likewise, the coated samples were evaluated and the results are shown in Figure 4. The same sample comparison was used with the coated samples.
For the mortar coated samples, comparing 2C and 3C, both present a decreasing sound reductionstarting at just 100 Hz and going until the resonant frequency, 200 Hz for the sample 2C and 250 Hz for 3C which can be related to the higher stiffness of sample 2C. In the mass-controlled region both samples show an expected and similar behavior but sample 2C presents a greater sound reduction throughout this whole range of frequency bands. Then the coincidence effect occurred at 2000 Hz for sample 2C and at 2500 Hz for sample 3C, being both inside the predicted range of occurrence of the critical frequency. In the damping-controlled region sample 2C reveals a greater sound reduction throughout the whole range. From these differences the sample 2C presents a 2 dB higher weighted sound reduction index.

Through the analysis of samples 1C and 7C coated with mortar, the sound reduction indexes of 1C was 5 dB at 100 Hz to 3 dB at 250 Hz higher probably by its higher stiffness. The resonant frequency occurred from 160 to 250 Hz for both samples and had a stronger insulation reduction on sample 7C. In the mass-controlled region sample 7C obtained higher sound reduction indexes despite having a non-linear behavior. The coincidence effect occurred inside the predicted frequency range and can be slightly spotted from 1600 to 2500 Hz in sample 1C and 1250 to 2500 Hz for 7C. In the damping-controlled region, sample 7C still had the greatest sound reduction gains. This resulted in a 2 dB higher weighted sound reduction index for sample 7C.
Subsequently, comparing samples 4C, 5C and 6C with the mortar coating, at 100 Hz the samples 4C and 6C had the same sound reduction index. The first resonant frequency occurred at 200 Hz in all samples. Then, in the mass-controlled region from 315 to 500 Hz sample 6C had the greatest results and 5C the lowest. From 500 to 1250 Hz the samples had the same behavior and very similar values. The coincidence effect caused a higher sound reduction loss for sample 4C, at 1600 Hz, in comparison with the other two, where it occurred at 2500 Hz. All the three samples had sharp sound reduction losses and were inside the predicted range of occurrence of the critical frequency. In the damping-controlled region all the samples had an expected behavior and 4C had the highest sound reduction. These differences and similarities yield the three samples to show the same weighted sound reduction index.
Between 4C and 7C coated samples, sample 4C, despite having less bending stiffness, obtained a greater sound reduction from 100 to 160 Hz. The effects of the first resonant frequency are present in a wide dip for sample 4C, with a maximum sound reduction loss at 200 Hz, and from 160 to 250 Hz for sample 7C. With the greatest surface mass sample 7C had the greatest sound reduction indexes in the mass-controlled region from 250 to 1600 Hz. Then, in the transference between regions where the coincidence effect is expected, sample 4C had a dip at 1600 Hz and sample 7C from 1250 to 2000 Hz, both inside the predicted critical frequency range. Subsequently, in the damping-controlled region sample 4C presented a greater reduction throughout the whole frequency range and coincides with the sample 7C only at 3150 Hz. Such differences yield for a 3 dB greater weighted sound reduction index for sample 7C.
Relationship between Rw, Aliq/At ratio and the surface mass of the systems
In order to better visualize the influence of the physical differences between the blocks that compose the samples, and the impact of the mortar coating, a comparative analysis was conducted between the values of the weighted sound reduction index (Rw), the surface mass of the walls and the Aliq/Atratio of the blocks. Figure 5 shows the results for weighted sound reduction indexes, Aliq/Atratio and surface mass of the uncoated and coated samples.
By analyzing the weighted sound reduction indexes results of the uncoated samples it can be seen that all the systems, excluding sample 3U, got results that tend to follow, although not in a linear way, the variations of the surface mass of the samples. In this case, the highest surface mass values resulted in the highest weighted sound reduction indexes. Also, disregarding sample 1Uthat had a lower result than expected, and sample 3U that had a 1 dB higher weighted sound reduction index when compared to sample 2U (had the same Aliq/At ratio and similar surface mass), the highest values of the Aliq/At ratio resulted in highest values of weighted sound reduction index.
In addition, considering the samples coated with mortar, two of the systems with highest surface mass and Aliq/At ratio, 1C and 7C, had the highest weighted sound reduction indexes. Differing from 6C which had the second highest Aliq/At ratio and the highest surface mass, showing that this discrepancy can be due to the configuration of the blocks. In this case, the cross section of the sample 6C blocks had small perforations in their external walls which filled samples 1C and 7C, evidencing the complexity associated with this type of system (WATTERS, 1959WATTERS, B. G. Transmission loss of some masonry walls. Journal of the Acoustical Society of America, v. 31, p. 989-911, 1959.; FRINGUELLINO; SMITH, 1999FRINGUELLINO, M.; SMITH, S. Sound transmission through hollow brick walls. Building Acoustics, v. 6, n. 3/4, p. 211-224, 1999.; HOPKINS, 2007HOPKINS, C. Sound Insulation. Burlington: Elsevier, 2007.; GUILLEN et al., 2008GUILLEN, I. et al. On the sound reduction of masonry wall façades. Building and Environment, v. 43, p. 523-529, 2008.; FAHY; THOMPSON, 2015FAHY, F.; THOMPSON, D. Fundamentals of sound and vibration. Boca Raton: Taylor & Francis Group, 2015.).
To visualize the physical discrepancies of the samples in relation to their overall sound reduction the correlation and determination factors were calculated with a moderate degree of dependence between the variables and resulted in the relation between Aliq/At ratio and Rw(Figure 6), and surface mass and Rw(Figure 7) (MASON; GUNST; HESS, 2003MASON, R. L.; GUNST, R. F.; HESS, J. L. Statistical design and analysis of experiments: with applications to engineering and science. 2nd.ed. New Jersey: John Wiley & Sons, 2003.; RATNER, 2009RATNER, B. The correlation coefficient: its values ranger between +1/-1, or do they? Journal of Targeting, Measurement and Analysis for Marketing, v. 17, n. 2, p. 139-142, 2009.; LARSON; FARBER, 2015LARSON, R.; FARBER, B. Elementary statistics: picturing the world. 6. ed. Boston: Pearson Education, 2015.; MONTGOMERY, 2017MONTGOMERY, D. C. Design and analysis of experiments. 9th. ed. Hoboken: John Wiley & Sons, 2017. ).
Analyzing the uncoated samples, shown in Figure 6, the correlation factor between the relation of Aliq/At ratio and the Rw was +0.59. This evidences a moderate correlation with an upward behavior, and the determination factor states that 40.89% of the variations are explained by the present data. For the coated samples, the correlation factor dropped to +0.22, rated as a weak correlation, with an even smaller determination factor of 3.42%, reinforcing an unexpected behavior in the sound reduction results of some samples. Despite the variations in both coating cases the regression lines had an upward behavior, with similar slopes, showing that an increase in sound reduction is expected when raising the Aliq/At ratios.


When comparing the results of Rw and the surface mass, illustrated by Figure 7, considering the samples without the mortar coating their correlation factor was +0.75 (better than when comparing Aliq/At ratio and the Rw) indicating a strong relation with a crescent behavior between the variables, although with a reduced determination factor (10.83%). With the samples coated with mortar the correlation factor dropped to +0.30, remaining crescent but considered as a weak-to-moderate correlation, evidencing a big discrepancy in the results, confirmed by the reduced determination factor of 8.52%. Again, the weaker correlation factors reinforce an unexpected behavior, not explained by the considered variables, corroborating to the complexity in the acoustic prediction of hollow systems or by the occurrence of defects in the construction of the samples (WATTERS, 1959WATTERS, B. G. Transmission loss of some masonry walls. Journal of the Acoustical Society of America, v. 31, p. 989-911, 1959.; FRINGUELLINO; SMITH, 1999FRINGUELLINO, M.; SMITH, S. Sound transmission through hollow brick walls. Building Acoustics, v. 6, n. 3/4, p. 211-224, 1999.; HOPKINS, 2007HOPKINS, C. Sound Insulation. Burlington: Elsevier, 2007.; GUILLEN et al., 2008GUILLEN, I. et al. On the sound reduction of masonry wall façades. Building and Environment, v. 43, p. 523-529, 2008.; FAHY; THOMPSON, 2015FAHY, F.; THOMPSON, D. Fundamentals of sound and vibration. Boca Raton: Taylor & Francis Group, 2015.).
In general, for both comparisons despite the discrepancies due to the applied mortar coating, when analyzing the regression lines, the sound reduction tends to increase with the increase of their physical characteristics. However, that does not happen for the surface mass and Rw comparison. As can be seen, the correlation between obtained results show that the surface mass follows a more linear trend than the relation between Aliq/At ratio and Rw.
Conclusions
The tests showed the sound reduction results of seven types of hollow ceramic building blocks used to build masonry walls with and without mortar coating on both faces. The variations in the 1/3 octave bands and weighted sound reduction indices of each sample were analyzed together with the physical characteristics of each considered block.
As expected, the response to the sound excitation by the different block compositions has led to discrepancies in the sound reduction behavior between each sample. This reinforces the difficulty in the prediction of the acoustic performance of heterogeneous systems and the influence of the mortar coating, in altering the bending stiffness and surface mass, resulting in the modification of the resonant and critical frequencies.
These behavior discrepancies can be seen with the uncoated and coated samples where compositions with the same surface mass and Aliq/At ratio, with only different internal configurations, had different curves and weighted results.
In general, for the uncoated samples the Aliq/At ratio and the surface mass of the systems had a similar correlation in terms of their impact in the overall sound reduction of the systems. But the relation between Rw and the surface mass presented a more grouped and linear correlation. And considering the coated samples, despite the samples with the greater surface mass and Aliq/At ratio having good results the correlation of the Aliq/At and surface mass with the values of Rw was very weak due to performance discrepancies in some of the samples. This reinforces the complexity in the acoustic behavior of the samples when changing some of their physical characteristics.
Although the discrepancies in the results of sound reduction by the modification of the physical characteristics of the samples, it can be stated by the crescent behavior of the regression lines, with different slopes between cases, that an increase in sound reduction is expected when raising the surface mass of the systems and the net to gross ratio of blocks.
With the database and analysis that this study contains it can be used as a reference for design proposes of more efficient walls in terms of performance and constructive impacts, including loads in the structures and the amount of raw materials used for the same performance class. In conclusion, considering the sound reduction stated by the tested samples, this article provides an analysis and acoustic data from typical civil construction materials for material prescription and development of new system compositions.
Acknowledgements
The authors are very thankful to the Acoustics Laboratory at ittPeformance (Performance and Civil Construction Technological Institute), Unisinos University, as well as for the companies Construrohr, Cerâmica City and one another industry that preferred not to be identified, for providing the ceramic blocks.
References
- AMERICAN SOCIETY FOR TESTING AND MATERIALS. C67: standard test methods for sampling and testing brick and structural clay tile. West Conshohocken, 2017.
- BARRON, R. F. Industrial Noise Control and Acoustics. New York: Marcel Dekker Inc., 2003.
- BIES, D. A.; HANSEN, C. H. Engineering Noise Control: theory and practice. 4th ed. New York: Spon Press, 2009.
- EUROPEAN STANDARD. EN 1015-10: methods of test for mortar for masonry: part 10: determination of dry bulk density of hardened mortar. Brussels, 1999b.
- EUROPEAN STANDARD. EN 1015-11: methods of test for mortar for masonry: part 11: determination of flexural and compressive strength of hardened mortar. Brussels, 1999c.
- EUROPEAN STANDARD. EN 1015-3: methods of test for mortar for masonry: part 3: determination of consistence of fresh mortar (by flow table). Brussels, 1999a.
- EUROPEAN STANDARD. EN 1015-6: methods of test for mortar for masonry: part 6: determination of bulk density of fresh mortar. Brussels, 1998.
- EVEREST, F. A.; POHLMANN, K. C. Master Handbook of Acoustics. 6thed. New York: McGraw-Hill Education, 2015.
- FAHY, F.; THOMPSON, D. Fundamentals of sound and vibration. Boca Raton: Taylor & Francis Group, 2015.
- FRINGUELLINO, M.; SMITH, S. Sound transmission through hollow brick walls. Building Acoustics, v. 6, n. 3/4, p. 211-224, 1999.
- GUILLEN, I. et al On the sound reduction of masonry wall façades. Building and Environment, v. 43, p. 523-529, 2008.
- HENDRY, E. A. Masonry walls: materials and construction. Construction and Building Materials, v. 15, p. 323-330, 2001.
- HOPKINS, C. Sound Insulation in Buildings. In: XIANG, N. Architectural Acoustics Handbook. Plantation: J. Ross Publishing, 2017.
- HOPKINS, C. Sound Insulation. Burlington: Elsevier, 2007.
- INTERNATIONAL ORGANIZATION FOR STANDARDIZATION. ISO 10140-2: acoustics: laboratory measurement of sound reduction of building elements: part 2: measurement of airborne sound reduction. Geneva, 2010.
- INTERNATIONAL ORGANIZATION FOR STANDARDIZATION. ISO 10140-4: acoustics: laboratory measurement of sound reduction of building elements: part 4: measurement procedures and requirements. Geneva, 2010.
- INTERNATIONAL ORGANIZATION FOR STANDARDIZATION. ISO 10140-5: acoustics: laboratory measurement of sound reduction of building elements: part 5: requirements for test facilities and equipment. Geneva, 2010.
- INTERNATIONAL ORGANIZATION FOR STANDARDIZATION. ISO 12999-1: acoustics: determination and application of measurement uncertainties in building acoustics: part 1: sound reduction. Geneva, 2014.
- INTERNATIONAL ORGANIZATION FOR STANDARDIZATION. ISO 17025: general requirements for the competence of testing and calibration laboratories. Geneva, 2017.
- INTERNATIONAL ORGANIZATION FOR STANDARDIZATION. ISO 717-1: acoustics: rating of sound reduction in buildings and of building elements: part 1: airborne sound reduction. Geneva, 2013.
- JACQUS, G. et al A homogenised vibratory model for predicting the acoustic properties of hollow brick walls. Journal of Sound and Vibration, v. 330, p. 3400-3409, 2011.
- JONES, D. Acoustical treatment for indoor areas. In: BALLOU, G. M. Hanbook for Sound Engineers. 4th ed. Oxford: Elsevier, 2009.
- LARSON, R.; FARBER, B. Elementary statistics: picturing the world. 6. ed. Boston: Pearson Education, 2015.
- MAEKAWA, Z.; RINDEL, J. H.; LORD, P. Environmental and Architectural Acoustics. 2nd .ed. New York: Taylor & Francis Group, 2011.
- MASON, R. L.; GUNST, R. F.; HESS, J. L. Statistical design and analysis of experiments: with applications to engineering and science. 2nded. New Jersey: John Wiley & Sons, 2003.
- MONTGOMERY, D. C. Design and analysis of experiments. 9th ed. Hoboken: John Wiley & Sons, 2017.
- FERREIRA NETO, M. de F.; BERTOLI, S. R. Acoustic performance of ceramic brick and block walls: a comparative study between Brazil and Portugal. Ambiente Construído, Porto Alegre, v. 10, n. 4, p. 169-180, out./dez. 2010.
- PATRICIO, J. Acústica nos edifícios. Lisbon: Verlag Dashofer, 2010.
- PETERS, R. J.; SMITH, B. J.; HOLLINS, M. Acoustics and noise control. 3rd ed. New Jersey: Taylor & Francis Group, 2013.
- RATNER, B. The correlation coefficient: its values ranger between +1/-1, or do they? Journal of Targeting, Measurement and Analysis for Marketing, v. 17, n. 2, p. 139-142, 2009.
- RINDEL, J. H. Sound Insulation in Buildings. Boca Raton: Taylor & Francis Group , 2018.
- SCHIAVONI, S. et al Reduction materials for the building sector: a review and comparative analysis. Materials for Renewable and Sustainable Energy, v. 62, p. 988-1011, 2016.
- WATTERS, B. G. Transmission loss of some masonry walls. Journal of the Acoustical Society of America, v. 31, p. 989-911, 1959.
Publication Dates
-
Publication in this collection
05 Mar 2021 -
Date of issue
Apr-Jun 2021
History
-
Received
14 June 2020 -
Accepted
17 Dec 2020