 Surface Urban Heat Island for the Cities of Asunción and Montevideo During 2001-2016
Abstract
This contribution estimates the Surface Urban Heat Island (SUHI) intensity during the period 2001-2016 for the Metropolitan Areas of Asunción (AMA) and Montevideo (AMM), located in Paraguay and Uruguay respectively. To quantify the SUHI, the quantile method was used at 0.05° resolution, obtained from the MODerate resolution Imaging Spectroradiometer (MODIS) sensor on board the TERRA and AQUA satellites. The daytime SUHI intensity, obtained with the quantile method in the AMA and AMM, shows the maximum value in December, 4.5 ºC and 0.5 ºC respectively. The quantile method proves to be a robust approach for estimating SUHI intensity, as it is independent of terrain geometry and topography. The analysis defined urban, transitional, and rural areas using the International Geosphere-Biosphere Programme (IGBP) method, and was conducted at a scale temporal monthly. Results indicate a consistent increase in urban surface temperatures, particularly in rapidly growing cities, intensifying thermal stress. This study contributes by analyzing the increase in surface temperature, providing a reliable framework for SUHI assessment and supporting targeted urban planning strategies.
Keywords:
Vegetation index; Microclimate; Land use
Resumo
Esta contribuição estima a Intensidade da Ilha de Calor Urbana de Superfície (ICUSU) durante o período de 2001-2016 para a Áreas Metropolitanas de Assunção (AMA) e Montevidéu (AMM), localizadas no Paraguai e Uruguai, respectivamente. Para quantificar a intensidade da ICUS, foi utilizado o método dos quantis com resolução de 0,05°, obtido do sensor MODerate resolution Imaging Spectroradiometer (MODIS) a bordo dos satélites TERRA e AQUA. A intensidade da ICUS diurna, obtida com o método quantílico na AMA e AMM, mostra o valor máximo em dezembro, 4,5 °C e 0,5 °C, respectivamente. O método dos quantis demonstra ser uma abordagem robusta para estimar a intensidade da intensidade da ICUS, uma vez que é independente da geometria e topografia do terreno. A análise definiu áreas urbanas, de transição e rurais utilizando o método International Geosphere-Biosphere Programme (IGBP) e foi conduzida em escala temporal mensal. Os resultados indicam um aumento consistente nas temperaturas da superfície urbana, particularmente em cidades de rápido crescimento, intensificando o estresse térmico. Este estudo contribui ao analisar o aumento da temperatura da superfície, fornecendo uma estrutura confiável para a avaliação da ICUS e apoiando estratégias de planejamento urbano direcionadas.
Palavras-chave:
Índice de vegetação; Microclima; Uso do solo
1 Introduction
1.1 SUHI and Remote Sensing
Accompanying rapid urbanization, the proportion of the global urban population increased from 45% in 1995 to 54% in 2015, and is projected to reach 66% by 2045 (United Nations 2014). This rapid urban growth has led to several environmental challenges, among which the urban heat island (UHI) effect stands out. UHI refers to the phenomenon in which urban areas exhibit higher temperatures than their rural surroundings, particularly during nighttime (Oke 1988).
Urban heat islands can be classified into two types: atmospheric UHI, measured using meteorological stations, and surface urban heat island (SUHI), derived from remote sensing observations (Zhou et al. 2014a). SUHI is defined as the difference in land surface temperature (LST) between urban and adjacent rural areas (Hu et al. 2022). Remote sensing techniques provide consistent and reliable measurements of SUHI across multiple spatial and temporal scales (Si et al. 2022), contributing to its widespread application in urban climate studies (Li et al. 2022; Mehmood et al. 2023; Peng et al. 2012). Furthermore, strong correlations have been identified between LST and near-surface air temperature, reinforcing the relevance of SUHI as an indicator of urban thermal conditions (Marzban, Sodoudi & Preusker 2018).
1.2 Vegetation and Urban Thermal Regulation
Vegetation plays a key role in regulating urban thermal environments. Through evapotranspiration processes, vegetation contributes to surface cooling and helps mitigate the intensity of the UHI effect (Peng et al. 2012; Zhou et al. 2014b). The Normalized Difference Vegetation Index (NDVI), derived from remote sensing data, is widely used to characterize vegetation dynamics and assess its relationship with land surface temperature. NDVI is associated with factors such as plant biomass and water stress (Nayak & Fulekar 2017), and has become a standard tool for analyzing spatiotemporal patterns of land use and land cover (LULC) (Sultana et al. 2014). Its application allows for the identification of vegetation distribution and its influence on urban thermal behavior.
Montevideo is the capital, main port, and largest city of Uruguay. It has a population of 1,319,108 inhabitants (INEI 2007) and is located in the Montevideo department (530 km²), on the northeastern coast of the Río de la Plata. Despite being the smallest administrative division in the country, it represents a major economic center, generating more than 50% of the national GDP (Apud et al. 2020). The city has experienced continuous spatial expansion over rural land, even though population growth has remained relatively stable (Apud et al. 2020). This expansion has contributed to changes in land cover and urban morphology, which are key factors influencing surface temperature patterns and SUHI dynamics.
1.3 Research Gap
Despite the growing number of studies on the surface urban heat island (SUHI) using remote sensing, important gaps remain. There is limited application of distribution-based methods, such as quantile approaches, to better capture the thermal heterogeneity within urban areas. Additionally, the relationship between SUHI intensity and vegetation indices is often analyzed using simplified approaches, without adequately addressing their spatial and temporal variability. Furthermore, comparative studies between South American cities with different urban development patterns such as Montevideo and Asunción are still scarce, limiting the understanding of how urban form and vegetation influence SUHI dynamics in this region.
Therefore, this work includes the estimation of the intensity of urban heat islands for the metropolitan areas of Montevideo and Asunción and their relationship with vegetation indices for the period 2001 to 2016.
2 Materials and Methods
2.1 Site and Location
The Montevideo department is divided in 62 neighbourhoods (INEI 2007) (Figure 1) with diverse degrees of urbanization and social- ecological conditions. The study areas correspond to the metropolitan regions of Montevideo and Asunción, two representative South American cities with contrasting urban and climatic conditions. Montevideo, located in southern Uruguay along the Río de la Plata, exhibits a humid subtropical climate (Cfa, Köppen-Geiger climate classification), with moderate temperatures, relatively uniform precipitation, and strong coastal influence (Peel et al. 2007). Its urban structure is relatively compact and planned, with gradual transitions toward peri-urban areas (UN-Habitat 2012). In contrast, Asunción, located on the eastern bank of the Paraguay River in Paraguay, experiences higher average temperatures and greater seasonal variability under the same humid subtropical classification (Peel et al. 2007). The city has undergone rapid and largely unplanned urban expansion, generating heterogeneous land cover patterns and pronounced urban-rural contrasts (Seto et al. 2011; United Nations 2019). These differences in geographic setting, climate, and urbanization processes make both cities suitable for comparative analyses of surface urban heat island dynamics and their relationship with land use and urban morphology.

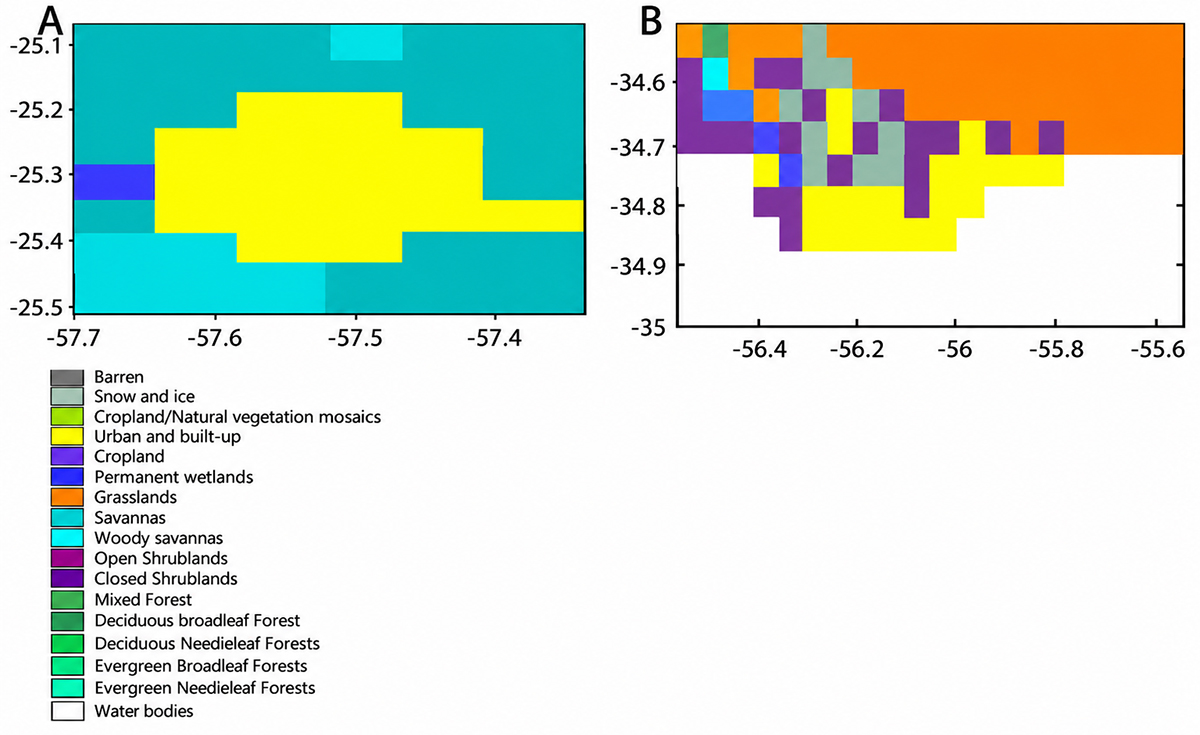
The classification was based on the IGBP methodology as shown in Figure 2. A dynamic urban mask was used, and urban expansion was explicitly incorporated by updating the classification at different time intervals (2001-2016), allowing changes in land use to be reflected in the analysis at a spatial resolution of 0.05°.

2.2 MODIS Data
MODIS sensors aboard the AQUA and TERRA satellites were used to obtain Land Surface Temperature (LST) data, following the approach of Dousset and Gourmelon (2003). Monthly mean LST values were generated at a spatial resolution of 5 km in order to evaluate the influence of spatial rescaling on LST statistical patterns. These results were subsequently compared with the MOD11C3 Global CMG product.
Urban and rural areas were identified using the MODIS MCD12C1 land cover product, which provides annual land cover information at a spatial resolution of 0.05° based on the International Geosphere-Biosphere Programme (IGBP) classification scheme. The IGBP system defines 17 land cover categories. In this study, the urban class corresponded to the “Urban and Built-up Lands” category (IGBP class 13), while rural areas included surrounding non-urban classes, mainly croplands, grasslands, and mixed vegetation classes, following the methodology proposed by Schneider et al. (2003).
The urban transition zone was defined as the interface between urban pixels and adjacent non-urban pixels within the study domain. Spatial separation between urban and rural areas was performed using a regular grid of 0.05°, consistent with the native spatial resolution of the MCD12C1 product. To match the 5 km LST dataset with the land cover information, the land cover data were resampled using the nearest-neighbor algorithm in order to preserve the original categorical values and avoid class mixing during the spatial aggregation process (Figure 2).
2.3 Relationship Between LST and NDVI and EVI
The Normalized Difference Vegetation Index (NDVI) is recognized as the most commonly applied indicator for assessing vegetation. This index was developed based on the observation of albedo variations between bare soil characterized by relatively constant reflectance in the red (0.62-0.75 μm) and near-infrared (NIR, 0.75-1.4 μm) bands and vegetated surfaces, which exhibit a marked increase in NIR reflectance compared to the visible spectrum. Conversely, the Enhanced Vegetation Index (EVI) provides a more refined vegetation signal by enhancing sensitivity in areas with dense biomass and improving vegetation monitoring. It achieves this by minimizing atmospheric influences and isolating canopy reflectance from background signals, as described in Equations 1 and 2 (Flores et al. 2016).
Where, red (0.62-0.75 μm), NIR (0.75-1.4 μm), and blue (0.459-0.479 μm) are surface reflectance’s that are corrected or partially corrected for atmospheric effects; L is the canopy background adjustment (nonlinear and differential transfer of red and NIR from the canopy); C1 and C2 are coefficients of the aerosol resistance term, which, adapted to MODIS-EVI, are: G (gain factor), C1 = 6, C2 = 7.5, and L = 1.
The monthly time series was constructed by aggregating the original MODIS data into monthly values using, ensuring temporal consistency across the study period.
2.4 SUHI Estimation
2.4.1 Quantile Method
The Surface Urban Heat Island (SUHI) intensity was estimated using a quantile-based approach in order to reduce the influence of anomalous temperature values and spatial heterogeneity commonly observed in medium-resolution MODIS products. In this study, the SUHI magnitude for a 0.05° resolution was defined as Equation 3:
Where 𝑄 5 𝑢𝑟𝑏𝑎𝑛 is the 0.95 quantile of the LST distribution over the urban area and 𝑄 3 𝑟𝑢𝑟𝑎𝑙 is the median of the LST distribution over the rural area, both with a resolution of 0.05°. The 0.95 quantile was selected to represent the upper tail of the LST distribution in urban areas, capturing the hottest pixels while reducing the influence of extreme outliers. For rural areas, the median was used as a robust baseline, less sensitive to skewed distributions. This distribution-based approach provides a more reliable characterization of the intensity of the urban heat island effect (UHI) in heterogeneous environments, which is advantageous for capturing intra-urban thermal contrasts (Flores et al. 2016). This configuration was selected because it captures the highest thermal expression of consolidated urban areas while using the rural median as a stable background reference less affected by extreme rural temperature variability. The use of the method quantile configuration is particularly suitable for cities such as Asunción and Montevideo, where urban morphology is spatially heterogeneous and characterized by mixed land cover, fragmented urban structures, and transitional peri-urban zones. Under these conditions, mean-based approaches may underestimate urban thermal intensity due to the inclusion of mixed or partially urbanized pixels. The upper urban quantile better represents the thermal core of the cities, while the rural median minimizes bias associated with isolated hot rural surfaces or seasonal variability.
The sensitivity of the method to spatial class definition was also considered. Urban and rural masks were derived from the MODIS MCD12C1 land cover product using the IGBP classification system, and the quantile calculations were restricted to pixels consistently classified during the study period. In addition, transition pixels located at the urban-rural interface were excluded from the analysis to reduce uncertainty associated with mixed land cover conditions. To address spectral mixing in heterogeneous pixels, particularly those containing combinations of vegetation, impervious surfaces, and bare soil, a nearest-neighbor resampling approach was applied during spatial harmonization between the land cover and LST datasets. This method preserves the original categorical information and avoids artificial averaging of land cover classes. Furthermore, pixels showing ambiguous or fragmented classification patterns were removed from the final quantile estimation to improve the robustness of the SUHI analysis.
2.5 Statistical Analysis
Descriptive statistics and the coefficient of determination (R²) were used to assess the relationships between variables (LST vs NDVI and EVI).
3 Results
3.1 Urban Surface Heat Island
To illustrate seasonal variations in the Surface Urban Heat Island (SUHI) effect for the Metropolitan Areas of AMA and AMM, Figure 3 displays the temporal evolution of Land Surface Temperature (LST) during both daytime and nighttime across three land cover types: urban, transitional (boundary), and rural areas. The graphs show long-term average LST values and standard deviations over the period 2001-2016 for each location.
In both AMA and AMM (Figures 3A and 3B), LST demonstrates a clear seasonal pattern, with the greatest thermal amplitudes occurring in the urban centers and the lowest in rural zones. For AMA, daytime LST peaks in January at 34°C in the urban core, 31°C in transitional zones, and 32°C in rural areas. Minimum daytime temperatures occur in July, with values of 21°C (urban), 20°C (boundary), and 20°C (rural).
At night, AMA also shows seasonal variability with relatively consistent thermal amplitudes across all zones (Figure 3A). Maximum nighttime LSTs occur in January, reaching 25°C in urban areas, 23°C in transitional zones, and 24°C in rural zones. Minimum values are observed in July: 15°C (urban), 14°C (boundary), and 14°C (rural).
In the case of AMM, maximum daytime LSTs in January are 32°C for urban areas and 31.5°C for both boundary and rural zones (Figure 3B). Minimum daytime temperatures are recorded in July at 11°C across all three locations.
During the nighttime period, AMM shows a similar seasonal trend, with January maxima of 19°C (urban), 18°C (boundary), and 17°C (rural), and July minima of 5°C (urban), 4°C (boundary), and 4°C (rural).

Temporal evolution of Land Surface Temperature (LST) (°C) during daytime and nighttime for the urban center (black line), boundary zone (blue line), and rural area (red line) in: A. AMA; B. AMM.
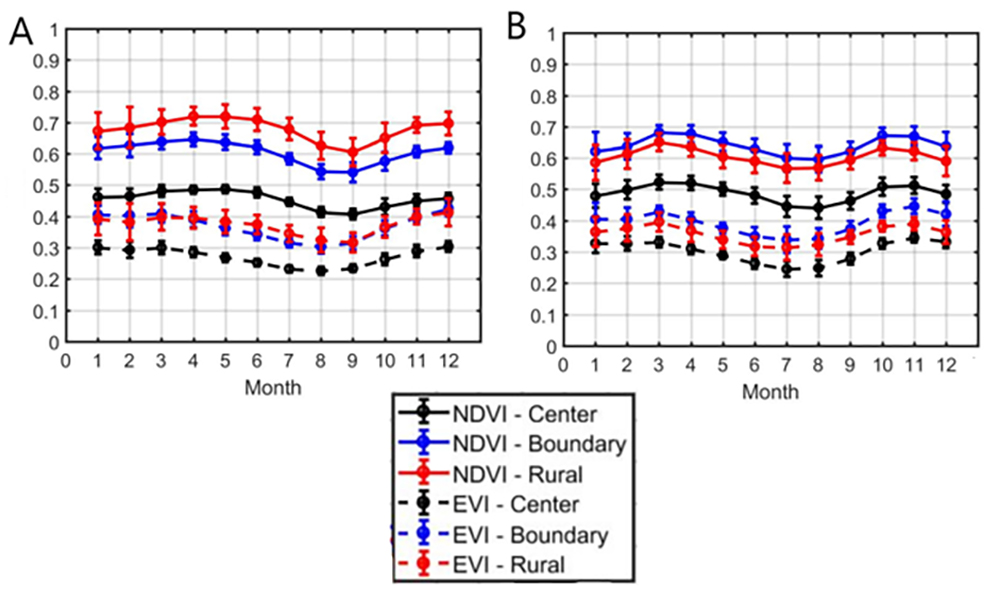
To understand the processes behind the formation of SUHI and potential changes in intensity due to climate and urban expansion, the relationships between LST and vegetation indices (NDVI and EVI) were analyzed for three cities: AMA and MAM. Specifically, the temporal evolution of monthly long-term vegetation indices (2001-2016) for NDVI and EVI at three different locations urban, border, and rural; are presented in Figures 4A and 4B, respectively. As anticipated, the highest values for the vegetation indices are found in the rural areas, while the lowest values correspond to the most urbanized areas.

Time evolution of NDVI and EVI of the urban center (black line), border (blue line) and rural (red line) for the: A. AMA; B. AMM.
3.2 Daytime and Nighttime SUHI Intensity
The results for long-term daytime Surface Urban Heat Island (SUHI) magnitudes from 2001 to 2016 across all months for both AMA (Figure 5A) and AMM (Figure 5B) show notable differences. In the AMA, the highest daytime SUHI value was recorded in December (4.5°C), while the lowest occurred in July (1°C). In contrast, the daytime SUHI in the AMM remained relatively stable throughout the year, with values around 0.5°C. During the nighttime period, the highest SUHI magnitude in the AMA was observed in January (2.5°C), and the lowest in July (2°C). For the AMM, the maximum nighttime SUHI occurred in January (3°C), while the minimum was recorded in August (1°C).

Temporal evolution from 2001 to 2016 of mean monthly daytime LST (°C) with standard deviation for daytime period of urban LST (Q5) (°C) and rural LST (Q3) (°C), intensity of SUHI (°C) for: A. AMA; B. AMM.
When comparing vegetation indices during daytime periods, it is observed that urban areas with lower vegetation cover show higher surface temperatures. Furthermore, a regression analysis was conducted between NDVI and LST, as well as between EVI and LST, for the period 2001-2016. This analysis included slopes, intercepts, and correlation coefficients (R²) for the MAM and AMA regions. In the urban areas of AMA and MAM, strong negative correlations were detected between land surface temperature (LST) and vegetation indices such as EVI (Figures 6 and 7), with R² values of 0.41 and 0.40, respectively. Similarly, strong negative correlations were found between LST and NDVI (Figures 8 and 9), with R² values of 0.55 and 0.59, respectively.

Long term (2001-2016) scatterplots of diurnal LST(°C) vs EVI for urban and rural areas of the AMA in: A.B. January; C.D. February; E.F. March.

Long term (2001-2016) scatterplots of diurnal LST (°C) vs EVI for urban and rural areas of the AMM in: A.B. January; C.D. November; E.F. December.

Long term (2001-2016) scatterplots of diurnal LST (°C) vs NDVI for urban and rural areas of the AMA in: A.B. January; C.D. February; E.F. March.

Long term (2001-2016) scatterplots of diurnal LST(°C) vs NDVI for urban and rural areas of the AMM: A.B. January; C.D. November; E.F. December.
4 Discussion
The results obtained in this study are consistent with previous findings that link urban expansion with increasing surface temperatures and declining vegetation cover. For instance, studies have reported significant reductions in vegetation alongside increases in built-up areas, reinforcing the role of land cover change in SUHI intensification (Duan et al. 2025; Lins 2024). In this context, urban surfaces act as primary sources of heat accumulation, while vegetation contributes to temperature regulation through processes such as evapotranspiration (Frasca 2022).
The relationship between vegetation indices and LST further supports this interpretation. In line with previous research, NDVI shows a negative association with LST, while built-up indices (e.g., NDBI) exhibit a positive relationship (Duan et al. 2025). However, the coefficients of determination obtained in this study (R² ≈ 0.40-0.59 for NDVI and EVI) indicate a moderate relationship rather than a strong one, reflecting the spatial and temporal variability inherent in urban environments. These results suggest that, although vegetation plays a significant role in mitigating SUHI, other factors such as urban morphology and surface materials also contribute to thermal patterns. Differences in SUHI behavior between cities can also be explained by variations in urban structure, vegetation distribution, and climatic conditions. Previous studies have shown that SUHI intensity varies according to land cover composition and seasonal dynamics, with stronger daytime effects and greater influence of surrounding rural land types (Wu et al. 2019). Similarly, long-term assessments have highlighted the role of urban configuration in shaping SUHI patterns at local scales (Orlando & Berazategui 2024).
Despite these advances, it is important to recognize the limitations of the data used. The spatial resolution of MODIS products may smooth fine-scale thermal variability, limiting the detection of micro-urban heat patterns. This constraint may partially explain the moderate correlations observed and should be considered when interpreting SUHI intensity. Overall, the findings confirm that SUHI is driven by the interaction between urban expansion, land cover change, and vegetation dynamics. While the results are consistent with global trends of increasing SUHI intensity over time (Yuan et al. 2025), they also highlight the importance of local urban characteristics in modulating thermal behavior.
In Montevideo, a SUHI assessment based on Landsat data identified clear spatial variability in surface temperatures, with higher values associated with densely built areas and lower temperatures in zones with greater vegetation cover (Orlando & Berazategui 2024). These findings are in agreement with the moderate negative relationship observed in this study between NDVI and LST. Although fewer studies are available for Asunción, research in cities with similar climatic and urbanization conditions has reported higher SUHI intensities linked to rapid and less regulated urban expansion, reduced vegetation cover, and increased impervious surfaces (Duan et al. 2025; Lins 2024). In this context, the higher SUHI intensity observed in Asunción is consistent with patterns described in the literature, where urban growth dynamics and land cover changes play a key role in amplifying thermal contrasts. Overall, the comparison suggests that while both cities exhibit SUHI effects driven by vegetation and land cover, differences in urban morphology and expansion processes are critical in explaining the variability in SUHI magnitude.
5 Conclusion
This study estimated the surface urban heat island (SUHI) intensity for the metropolitan areas of Asunción and Montevideo during the period 2001-2016 at a spatial resolution of 0.05°. The results show clear temporal variability in SUHI intensity, with higher daytime values in Asunción, reaching up to 4.5 °C in December, and lower values in winter months (~1 °C). Nighttime SUHI exhibited less variability but remained consistently present. In contrast, Montevideo showed lower SUHI intensities, with daytime values around 0.5 °C and moderate nocturnal variation (1-3 °C).
These differences reflect the influence of urban morphology, vegetation cover, and geographic context on urban thermal behavior. The quantile-based method proved effective in capturing SUHI intensity without being constrained by terrain characteristics, allowing a consistent comparison between cities.
The relationships observed between vegetation and temperature indicate that areas with higher vegetation cover tend to present lower surface temperatures, although with moderate correlation values, suggesting that additional factors such as urban structure and surface materials also play a significant role.
Limitations related to the spatial resolution of MODIS data may reduce the detection of fine-scale thermal variability. Future research should incorporate higher-resolution datasets and expand comparative analyses to better understand intra-urban patterns and their drivers.
6 Acknowledgments
This article corresponds to the postdoctoral research carried out within the framework of the Postdoctoral Program in Epistemología Social e Investigación Social (cohorte 2025-2026), taught by the Universidad Nacional del Centro del Perú (UNCP), Perú and Centro de Estudios Latinoamericanos de Educación Inclusiva (CELEI), Chile.
7 References
-
Apud, A., Delgado, J. & de la Barrera, F. 2020, ‘Suitability analysis and planning of green infrastructure in Montevideo, Uruguay’, Sustainability, vol. 12, no. 22, art. 9683, DOI: 10.3390/su12229683
» https://doi.org/10.3390/su12229683 -
Dousset, B. & Gourmelon, F. 2003, ‘Satellite multi-sensor data analysis of urban surface temperatures and land cover’, ISPRS Journal of Photogrammetry and Remote Sensing, vol. 58, no. 1-2, pp. 43-54, DOI: 10.1016/S0924-2716(03)00016-9
» https://doi.org/10.1016/S0924-2716(03)00016-9 -
Duan, X., Haseeb, M., Tahir, Z., Mahmood, S.A., Tariq, A., Jamil, A., Ullah, S. & Abdullah-Al-Wadud, M. 2025, ‘A geospatial and statistical analysis of land surface temperature in response to land use land cover changes and urban heat island dynamics’, Scientific Reports, vol. 15, no. 1, art. 4943, DOI: 10.1038/s41598-025-89167-x
» https://doi.org/10.1038/s41598-025-89167-x -
Frasca, D. & Amorim, T. 2022, ‘Multicriteria Spatial Modeling: Methodological Contribution to the Analysis of Atmospheric and Surface Heat Islands in Presidente Prudente, Brazil’, Climate, vol. 10, no. 4, art. 56, DOI: 10.3390/cli10040056
» https://doi.org/10.3390/cli10040056 -
Hu, J., Yuan, L., Li, X., Chen, Z., Wang, C., & Dai, Y. 2022, ‘Spatial patterns and temporal variations of footprint and intensity of surface urban heat island in 141 China cities’, Sustainable Cities and Society, vol. 77, art. 103585, DOI: 10.1016/j.scs.2021.103585
» https://doi.org/10.1016/j.scs.2021.103585 -
INEI (Instituto Nacional de Estadística e Informática) 2007, Dinâmica poblacional, INEI, Lima, http://proyectos.inei.gob.pe/web/biblioineipub/bancopub/Est/Lib0901/cap0
» http://proyectos.inei.gob.pe/web/biblioineipub/bancopub/Est/Lib0901/cap0 -
Li, D. & Bou-Zeid, E. 2013, ‘Synergistic interactions between urban heat islands and heat waves: The impact in cities is larger than the sum of its parts’, Journal of Applied Meteorology and Climatology, vol. 52, no. 9, pp. 2051-2064, DOI: 10.1175/JAMC-D-13-02.1
» https://doi.org/10.1175/JAMC-D-13-02.1 -
Li, Y., Feng, Z., Li, L., Li, T., Guo, F., Wei, J., Yan, Y., & Wang, L. 2022, ‘Surface urban heat islands in 932 urban region agglomerations in China during the morning and before midnight: spatial-temporal changes, drivers, and simulation ’, Geocarto International, vol. 37, no. 26, pp. 13689-13710, DOI: 10.1080/10106049.2022.2082552
» https://doi.org/10.1080/10106049.2022.2082552 -
Lins Leonardo, H.R.de A., Almeida, D.N.O.de, Amorim, A.R.de, Paiva, A.L.R.de, Oliveira, L.M.M.de & Santos, S.M.dos. 2024, ‘Remote sensing applied to biophysical parameters and land cover to identify urban heat islands in Recife (PE), Brazil’, Revista Brasileira de Ciências Ambientais, vol. 60, e2107, DOI: 10.5327/z2176-94782107
» https://doi.org/10.5327/z2176-94782107 -
Marzban, F., Sodoudi, S. & Preusker, R. 2018, ‘The influence of land-cover type on the relationship between NDVI-LST and LST-Tair’, International Journal of Remote Sensing, vol. 39, no. 5, pp. 1377-1398, DOI: 10.1080/01431161.2017.1402386
» https://doi.org/10.1080/01431161.2017.1402386 -
Mehmood, M.S., Zafar, Z., Sajjad, M., Hussain, S., Zhai, S. & Qin, Y. 2023, ‘Time Series Analyses and Forecasting of Surface Urban Heat Island Intensity Using ARIMA Model in Punjab, Pakistan’, Land, vol. 12, no. 1, art. 142, DOI: 10.3390/land12010142
» https://doi.org/10.3390/land12010142 -
Nayak, D.P. & Fulekar, M.H. 2017, ‘Coastal Geomorphological and Land Use and Land Cover Study on Some Sites of Gulf of Kachchh, Gujarat, West Coast of India using Multi-Temporal Remote Sensing Data’, International Journal of Advanced Remote Sensing and GIS, vol. 6, no. 1, pp. 2225-2237, DOI: 10.23953/cloud.ijarsg.273
» https://doi.org/10.23953/cloud.ijarsg.273 -
Oke, T.R. 1988, ‘The urban energy balance’, Progress in Physical Geography, vol. 12, no. 4, DOI: 10.1177/030913338801200401
» https://doi.org/10.1177/030913338801200401 -
Orlando, L. & Berazategui, M. 2024, ‘An urban ecology primer for Montevideo: Heat island in a Latin American social-ecological context’, Urban Climate, vol. 57, art. 102091, DOI: 10.1016/j.uclim.2024.102091
» https://doi.org/10.1016/j.uclim.2024.102091 -
Peel, M.C., Finlayson, B.L. & McMahon, T.A. 2007, ‘Updated world map of the Köppen-Geiger climate classification’, Hydrology and Earth System Sciences, vol. 11, no. 5, pp. 1633-1644, DOI: 10.5194/hess-11-1633-2007
» https://doi.org/10.5194/hess-11-1633-2007 -
Peng, S., Piao, S., Ciais, P., Friedlingstein, P., Ottle, C., Bréon, F.M., Nan, H., Zhou, L. & Myneni, R.B. 2012, ‘Surface urban heat island across 419 global big cities’, Environmental Science & Technology, vol. 46, no. 2, pp. 696-703, DOI: 10.1021/es2030438
» https://doi.org/10.1021/es2030438 -
Seto, K.C., Fragkias, M., Güneralp, B. & Reilly, M.K. 2011, ‘A meta-analysis of global urban land expansion’, PLOS ONE, vol. 6, no. 8, e23777, DOI: 10.1371/journal.pone.0023777
» https://doi.org/10.1371/journal.pone.0023777 -
Schneider, A., Friedl, M., McIver, D. & Woodcock, C. 2003, ‘Mapping urban areas by fusing multiple sources of coarse resolution remotely sensed data’, Photogrammetric Engineering & Remote Sensing, vol. 69, no. 12, pp. 1377-1386, DOI: 10.14358/PERS.69.12.1377
» https://doi.org/10.14358/PERS.69.12.1377 -
Si, M., Zhou, J., Tang, W., Liu, X., Wang, N., & Ma, A. 2022, ‘Spatiotemporal pattern and long-term trend of global surface urban heat islands characterized by dynamic urban-extent method and MODIS data’, ISPRS Journal of Photogrammetry and Remote Sensing, vol. 183, DOI: 10.1016/j.isprsjprs.2021.11.017
» https://doi.org/10.1016/j.isprsjprs.2021.11.017 -
Sultana, S.R., Ali, A., Ahmad, A., Mubeen, M., Zia-ul-Haq, M., Ahmad, S., Khan, M.A. & Khaliq, T. 2014, ‘Normalized difference vegetation index as a tool for wheat yield estimation: A case study from Faisalabad, Pakistan’, The Scientific World Journal, vol. 2014, DOI: 10.1155/2014/725326
» https://doi.org/10.1155/2014/725326 - UN-Habitat 2012, State of Latin American and Caribbean Cities: Towards a new urban transition, UN-Habitat, Nairobi.
-
United Nations, Department of Economic and Social Affairs, Population Division 2014, World Urbanization Prospects: The 2014 Revision, Highlights (ST/ESA/SER.A/352), United Nations, New York, https://population.un.org/wup/
» https://population.un.org/wup/ - United Nations, Department of Economic and Social Affairs, Population Division 2019, World Urbanization Prospects: The 2018 Revision (ST/ESA/SER.A/420), United Nations, New York.
-
Wu, X., Wang, G., Yao, R., Wang, L., Yu, D. & Gui, X. 2019, ‘Investigating surface urban heat islands in South America based on MODIS data from 2003-2016’, Remote Sensing, vol. 11, no. 10, art. 1212, DOI: 10.3390/rs11101212
» https://doi.org/10.3390/rs11101212 -
Yuan, Y., Peng, J., Li, Y., Wang, X., Zhou, D. & Meili, N. 2025, ‘Surface urban heat island effects intensify more rapidly in lower income countries’, npj Urban Sustainability, vol. 5, no. 1, pp. 1-11, DOI: 10.1038/s42949-025-00198-9
» https://doi.org/10.1038/s42949-025-00198-9 -
Zhou, D., Zhao, S., Liu, S., Zhang, L., & Zhu, C. 2014a, ‘Surface urban heat island in China’s 32 major cities: Spatial patterns and drivers’, Remote Sensing of Environment, vol. 152, pp. 51-61, DOI: 10.1016/j.rse.2014.05.017
» https://doi.org/10.1016/j.rse.2014.05.017 -
Zhou, Y., Smith, S.J., Elvidge, C.D., Zhao, K., Thomson, A. & Imhoff, M.L. 2014b, ‘A cluster-based method to map urban area from DMSP/OLS nightlights’, Remote Sensing of Environment, vol. 147, pp. 173-185, DOI: 10.1016/j.rse.2014.03.004
» https://doi.org/10.1016/j.rse.2014.03.004