 Assessment of Water Quality: A Study of Godavari and Krishna River Basin in Ahmednagar District, Maharashtra, India
Abstract
This study focuses on the assessment of water quality in the Godavari and Krishna rivers in Ahmednagar district of Maharashtra, India. Water pollution is a critical global problem with serious consequences arising from contamination of water bodies. Major contributors to water pollution include domestic sewage, agricultural waste, population growth, and urbanization. Natural processes such as soil weathering, rainfall, and erosion also affect water quality. In Ahmednagar district of Maharashtra, an investigation of the Godavari and Krishna rivers revealed significant contamination, mainly due to domestic wastewater. The main parameters indicating pollution include HCO, Ca, Cl, F, K, Mg, Na, NO3 - and SO4 2- ions, in addition to electrical conductivity (EC), pH, sodium adsorption rate (SAR), total hardness, and total alkalinity. According to the Brown classification method, water quality is categorized into five classes: Excellent, Good, Poor, Very Poor, and Unfit for consumption. The study found that water quality at sampling stations such as Arangaon, Bhitkewadi, Ghodegaon, Ghogaraonkari, Ghotan, Jakhangaon and Takalikazi was excellent. Stations such as Ambikhalsa, Bote, Devlali, Jamkhed, Rahata, Shirasgaon and Shrigonda had good water quality. However, stations at Banpimpri, Chandanpuri, Ghargaon, Jamkhed, Khosepuri, Kokangaon, LoniPravarnagar, Rassin and Takalibhan had poor water quality. Notably, water quality at Supe was very poor and Dahigaon was unfit for drinking, containing heavy metals, pesticides and faecal matter. This study highlights the immediate need for an action plan to reduce pollution and safeguard water quality in these vital rivers. These findings emphasize the importance of continuous monitoring and intervention strategies to ensure the sustainability of the Godavari and Krishna Rivers.
Keywords:
Physical parameter; Chemical parameter; Water contamination
Resumo
Este estudo foca na avaliação da qualidade da água dos rios Godavari e Krishna, no distrito de Ahmednagar, em Maharashtra, na Índia. A poluição da água é um problema global crítico, com graves consequências decorrentes da contaminação dos corpos d'água. Os principais contribuintes para a poluição da água incluem esgoto doméstico, resíduos agrícolas, crescimento populacional e urbanização. Processos naturais, como intemperismo do solo, chuvas e erosão, também afetam a qualidade da água. No distrito de Ahmednagar, em Maharashtra, uma investigação dos rios Godavari e Krishna revelou uma contaminação significativa, principalmente devido a águas residuais domésticas. Os principais parâmetros que indicam poluição incluem íons HCO, Ca, Cl, F, K, Mg, Na, NO3 - e SO4 2-, além da condutividade elétrica (CE), pH, taxa de adsorção de sódio (SAR), dureza total e alcalinidade total. De acordo com o método de classificação de Brown, a qualidade da água é categorizada em cinco classes: Excelente, Boa, Ruim, Muito Ruim e Imprópria para Consumo. O estudo descobriu que a qualidade da água em estações de amostragem como Arangaon, Bhitkewadi, Ghodegaon, Ghogaraonkari, Ghotan, Jakhangaon e Takalikazi era excelente. Estações como Ambikhalsa, Bote, Devlali, Jamkhed, Rahata, Shirasgaone Shrigonda tinham água de boa qualidade. No entanto, as estações de Banpimpri, Chandanpuri, Ghargaon, Jamkhed, Khosepuri, Kokangaon, LoniPravarnagar, Rassin e Takalibhan apresentavam uma má qualidade da água. Notavelmente, a qualidade da água em Supe era muito fraca e Dahigaon era imprópria para consumo, contendo metais pesados, pesticidas e matéria fecal. Este estudo destaca a necessidade imediata de um plano de ação para reduzir a poluição e preservar a qualidade da água nestes rios vitais. Estas conclusões enfatizam a importância de estratégias contínuas de monitoramento e intervenção para garantir a sustentabilidade dos rios Godavari e Krishna.
Palavras-chave:
Parâmetros físicos; Parâmetros químicos; Contaminação da água
1 Introduction
Water pollution in India has now reached a critical point. Almost every river system in India is now polluted to a considerable extent. As assessed by the scientists of the National Environmental Engineering Research Institute (NEERI) Nagpur, nearly 70% of water in India is polluted according to Dwivedi (2017) and Vistu (2019). Godavari is the second longest river in India after the river Ganges, is also referred as the “Dakshin Ganga” or “Ganga of South”. It is one of the largest river basins in India and flows from west to east according to Aavanira Biotech Private Limited (2015). The Godavari River is experiencing severe industrial pollution and ringing alarm bells. The unregulated growth of urban areas, particularly over the last two decades, without providing infrastructure services for proper collection, transportation, treatment and disposal of domestic waste has led to increased pollution and health hazards (Nayak 2016). The release of untreated industrial effluents into the river by companies located on Godavari banks in Nashik, Kopargaon, Paithan, Nanded, SonpetPochampad, Kaleshwaram, Bhadrachalam, Polavaram, and Rajmahindry may sound a death knell for the lifeline if urgent conservation measures are not taken.
The Krishna River Basin is divided into two: Upper Bhima, Basins (Bhima, Nira, Chandrabhaga, Mutha, Ghod, Indrayani, Pawana, Sina, Vel, Nalla, and Mula-Mutha); and the second is the Upper Krishna Basin (Krishna, Panchganga, Koyna, Urmodi, and Venna). The water from the Krishna River and its tributaries is used for various anthropogenic activities. Water is used for drinking, domestic, agricultural, electrical generation and industrial purposes, etc. The quality of surface water in rivers can be affected by normal processes such as soil weathering, rainfall and erosion, as well as human activities such as manufacturing agrarian production (Al-Ansari et al. 2018): fishing; washing of clothes and animals; religious activities such as idol and nirmalya immersion and crematorium ash immersion; sand mining from riverbeds; and excavation of fertile soil from riverbanks for brick making. The water quality index is a means to summarize large amounts of water quality data into simple terms for reporting to management and the public in a consistent manner, according to Kumar (2012)
The primary objective of this study is to calculate the Water Quality Index (WQI) for the Godavari and Krishna rivers by analyzing secondary data on various water quality parameters. Additionally, the study aims to develop a comprehensive water quality map that visually represents the data, enabling easier identification of areas with differing water quality levels. Furthermore, the study seeks to assess the impact of the rivers' water quality on human life, examining how pollutants and other water quality factors may affect the health and well-being of local communities and ecosystems.
2 Study Area
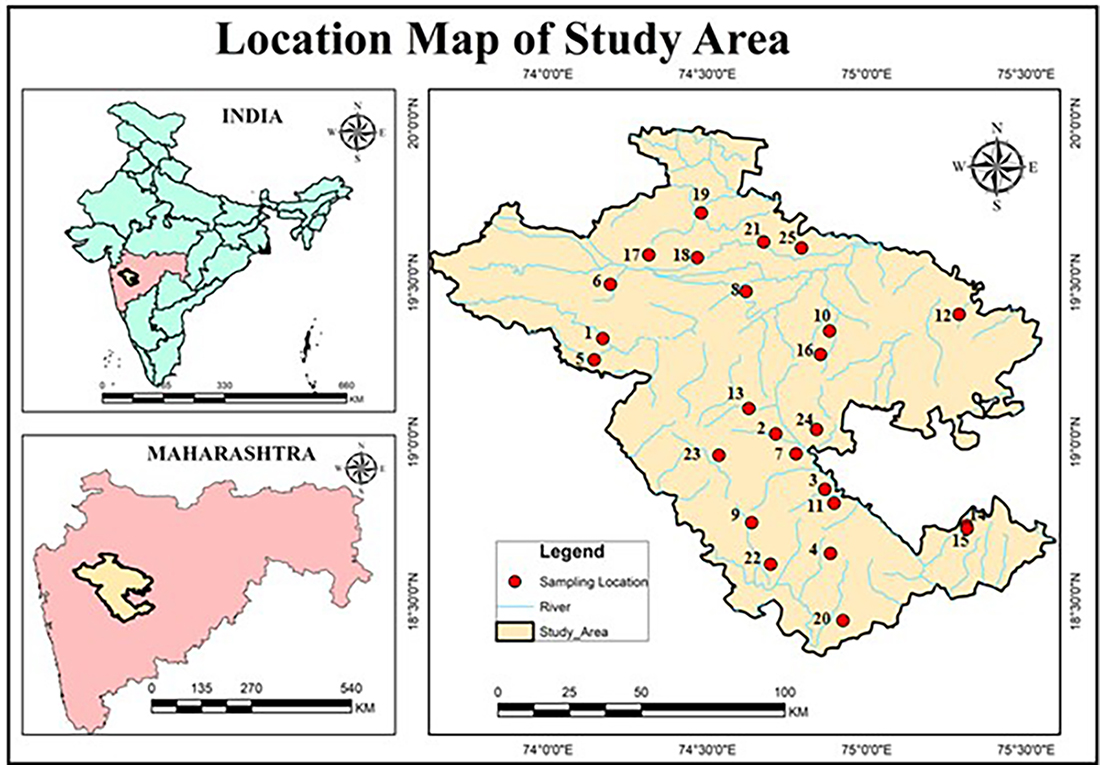
Ahmednagar is the largest district in Maharashtra State, covering an area of 17,418 km2 (Figure 1). This area constitutes 5.66% of the total area of Maharashtra. Out of the total area, 391.5 km2 is classified as urban, while the remaining 16,656.5 km2 is rural. Ahmednagar is centrally located in western Maharashtra. The study area is bounded by Ahmednagar district. The geographical extension is 18o20’’00 and 19o09’00’’ north latitude and 73o09’00’’ and 75o05’00’’ east longitudes. The study area includes two significant rivers, the Godavari River and the Krishna Rivers Tributary Bhima River. The Godavari River originates at Trimbkeshwar in Nashik district and flows eastward before entering the Bay of Bengal. The Krishna River originates at Mahableshwar in Satara district, flows eastward and also enters in the Bay of Bengal.

This research is based mainly on secondary data. The secondary data come from various research papers, academic literature, government reports and policy documents from the planning commission of India (regarding the Godavari and Krishna Rivers), pollution control boards, etc.
3 Methodology
The calculation of the WQI was performed using the weighted arithmetic water quality index, which was originally proposed by Horton in 1965 and developed by Brown et al. (1972).
WQI Formula by Brown et al. (1972) is as follows.
Step .1) Calculate the unit weight (Wn) factors for each parameter by using the following Equation 1:
Where:
Sn = Standard desirable value of the nth parameter
Summary of all the selected parameter units
Weight factors, Wn =1 (unity)
Step .2) Calculate the subindex (Qn) value by using the following Equation 2:
Where:
Vn = Mean concentration of the nth parameter’s
Sn = Standard desirable value of the nth parameter’s
Actual value of the parameter in pure water (generally Vo = 0, for most parameter except for pH) Equation 3:
Step .3) Combine steps 1 and 2
The WQI is calculated as follows Equation 4:
Overall
Quantitative data is analysed with appropriate statistical techniques or tools. The data are presented in a suitable statistical table (Table 1, 2 and 3). The GIS technique was used to analyse, represent, and prepare various river basin maps and water quality maps.
4 Results and Discussions
Water quality analysis is crucial for assessing the safety of water for human consumption and the health of aquatic ecosystems. This approach helps to detect contaminants from industrial waste, preventing localized pollution. Monitoring ensures compliance with environmental regulations, early detection of issues, and community awareness about sustainable water management. In essence, biodiversity protection is vital for protecting human health, preserving biodiversity, and maintaining overall environmental well-being. River water contamination due to the disposal of industrial waste effluent into riverine systems has given rise to heavily localized pollution and severe threats to the environment (Katakwar & Katakwar 2016).
Bicarbonate (HCO3-) is the principal anion found in natural water (Ramesh & Jain 2017). This ion is very important in carbonate systems; they provide a buffer capacity to natural water and are responsible for the alkalinity of water. One source of HCO3- ion in natural water is the dissociation of carbonic acid (H2CO3), which is formed when carbon dioxide (CO2) from the atmosphere, animals (e.g., fish) or bacteria dissolves in water (Ramesh & Jain 2017).
Bicarbonate is a by-product of the metabolism of every human body, and blood transports bicarbonate to the lungs after which it is exhaled as carbon dioxide. The kidneys also help regulate bicarbonate levels. Bicarbonate is excreted and reabsorbed by the kidneys. Water with high bicarbonate levels may contain low levels of other anions, such as chloride and sulphates. Therefore, according to Figure 2, bicarbonate concentrations are greater in the Banpimpari (678 mg/L), Dahigaon (605 mg/L), and Supe (493 mg/L) regions of the Krishna River. A low level of bicarbonate in human blood may cause a condition called metabolic acidosis or too much acid in the body. According to Figure 2, bicarbonate concentration is the lowest at Ghotan (31 mg/L) in the Godavari River basin, so human health concerns this location.

Calcium and magnesium are the main contributors to water hardness (Scherer & Dakota 2019). When water is heated, calcium breaks down and precipitates out of the solution, forming a scale. Maximum limits have not been established for calcium, according to Scherer and Dakota (2019).
A lack of calcium or magnesium in drinking water seems to cause lower bone mass density, greater incidence of fractures, and disturbed bone development in children (Kozisek 2020). Therefore, according to Figure 3, the calcium concentration was the lowest in Ghogargaon (22 mg/L), Takali Kazi (26 mg/L), and Arangaon (28 mg/L), located in the Krishna River basin. Calcium level is highest at Dahigaon (291 mg/L) in the Krishna River basin, where it is most important for human bone development (Figure 3).

High concentrations of chloride ion can cause water to have an objectionable salty taste and corrode hot-water plumbing systems. An increase in the normal chloride content of water may indicate possible pollution from human sewage, animal manure or industrial waste (Scherer & Dakota 2019).
An upper limit of 250 mg/L has been set for chloride ion, although noticing the taste at this level is difficult, and even higher concentrations do not appear to cause adverse health effects (Scherer & Dakota 2019). According to Figure 4, the Cl (chloride) proportion is greater in Rassin (468 mg/L), Jamkhed (362 mg/L), and Banpimpri (314 mg/L) from the Krishna River basin, and high levels of chloride can corrode and weaken metallic piping and fixtures, give a "salty" taste to drinking water, damage household appliances, and boilers, and, if water is used for irrigation, may inhibit the growth of vegetation [15]. A high chloride intake can result in high levels of chloride in the bloodstream, i.e., hyperchloremia. Elevated concentration of chloride in streams can be toxic to some aquatic organisms [15]. According to Figure 4, the lower chloride concentrations are found at Ghogargaon (21 mg/L), and TakliKazi (32 mg/L) in the Krishna River basin, and at Ghogegaon (28 mg/L) in the Godavari River basin. Generally, chloride is not considered a health risk, but at relatively low concentrations, this ion in drinking water can affect its taste. However, consuming drinking water containing chloride is not harmful to human health [15].

The electrical conductivity (EC) has a direct relation with the total dissolved solids (Tabassum, Das & Ghosh 2020). The electrical conductivity of water is a measure of the ability of a solution to carry or conduct an electrical current (Tchobanoglous et al. 2003). Since an electrical current is carried by ion in solution, according to American Public Health Association (2005), conductivity increases with increasing concentration of ion. Therefore, it is one of the main parameters used to determine the suitability of water for irrigation and fire fighting (Omer 2019).
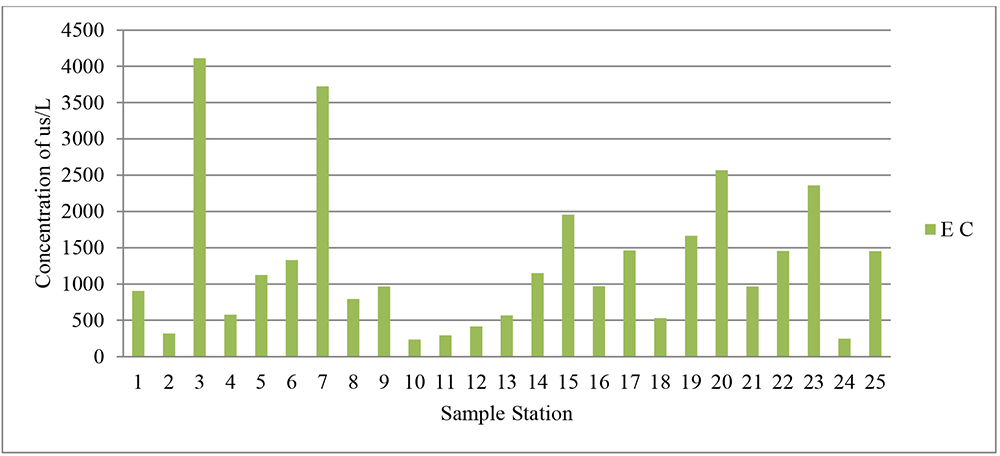
According to Figure 5, higher EC values were found at Banpimpri (4111μs/L) and Dahigaon (3722 μs/L) in the Krishna River basin. As salinity and temperature increase, conductivity also increases, which can have a negative effect on the quality of water [15]. This is because the higher the conductivity, the greater the amount of dissolved substances and chemicals in the water [15]. The EC is lower at Ghodegaon (235μs/L) in the Godavari River basin and is also found at Taklikazi (247μs/L), Ghogargaon (291μs/L), and Arangaon (318μs/L) in the Krishna River basin (Figure 5). This indicates a lower salinity in water and lower concentrations of dissolved substances, chemicals, minerals, etc.

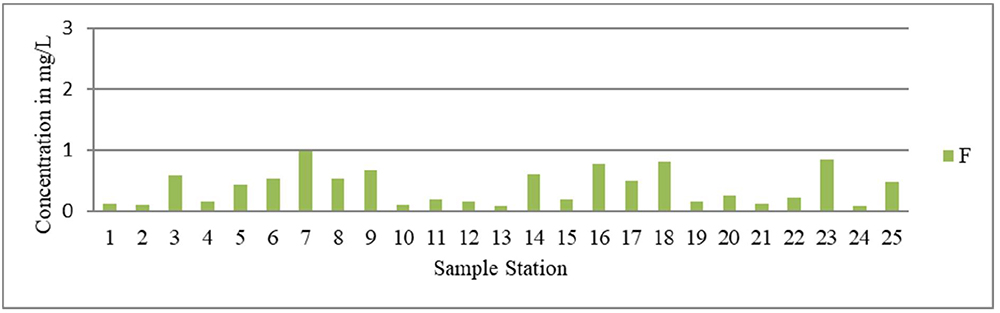
According to collected sample (Tables 1, 2 and 3), fluoride concentrations ranging from 0.7 to 1.2 mg/L in drinking water protect against dental cavities (Scherer & Dakota 2019). However, excessive levels (more than 1.5 mg/L) may cause discolouration or mottling of the teeth. This occurs only in developing teeth before they push through. Elevated fluoride levels may also cause skeletal damage and bone disease. Because low levels of fluoride are common in groundwater, most municipalities add fluoride to the water (Scherer & Dakota 2019).
According to Figure 6, fluoride relatively high levels were found in Dahigaon (0.99 mg/L), and Supe (0.84 mg/L) in the Krishna River basin, and in Loni Pravaranagar (0.81 mg/L), and Khosepuri (0.77 mg/L) in the Godavari River, but it is not excessive levels (more than 1.5 mg/L). A higher concentration of fluoride ion in drinking water can cause dental fluorosis, skeletal fluorosis, arthritis, bone damage, osteoporosis, muscular damage, fatigue, joint injury problems and chronicle issues [23]. The fluoride proportions at Takli Kazi (0.09 mg/L), Jakhangaon (0.09 mg/L), and Arangaon (0.11 mg/L) were the lower in the Krishna River basin (Figure 6).

The potassium concentrations in water are generally very low. Although excessive amounts of this metal may have a laxative effect, no maximum limit has been established, according to Scherer and Dakota (2019). Potassium chloride is used as a replacement for salt in water softeners when dietary sodium intake is a health issue (Scherer & Dakota 2019).
According to Figure 7, potassium concentration is higher at Dahigaon (91 mg/L), Banpimpri (31 mg/L), and Rassin (30.72 mg/L), in the Krishna River basin and is also found at Ambikhalsa (43 mg/L) in the Godavari River basin. Potassium helps muscles contract and support normal blood pressure to human health [02]. Potassium does not pose a health risk for healthy individuals [35]. However, having too much potassium in one’s blood can be dangerous. Potassium affects the way the heart's muscles work. When you have too much potassium, your heart may beat irregularly, which in the worst cases can cause a heart attack [02]. According to The lower K (potassium) concentrations were found in Jamkaed (0.32 mg/L), Jakhangaon (0.37 mg/L), Bhikewadi (0.45 mg/L), Shrigonda (0.55 mg/L), and Taklikazi (0.55 mg/L) in the Krishna River basin and in Ghodegaon (0.55 mg/L) in the Godavari River basin (Figure 7).

Magnesium ion is of particular importance in water pollution. According to Figure 8, magnesium is more common at Dahigaon (123.74 mg/L), and Rassin (102.25 mg/L) in the Krishna River basin, as was Kokangaon (93.22 mg/L), in the Godavari River basin. The findings from this meta-analysis suggest that a high level of magnesium in drinking water may reduce the risk of child mortality. Experts in this field tell us that total magnesium intake should be at least 450-500 mg/day and that drinking water should contain a minimum of 25-50 ppm magnesium.

In the human body, sodium helps maintain the water balance. Human intake of sodium is influenced mainly by the consumption of sodium as sodium chloride or table salt. The contribution of drinking water is normally small, compared with that of other sources (Scherer & Dakota 2019). The National Academy of Sciences has suggested a standard for public water allowing no more than 100 mg/L of sodium. This approach ensures that the water supply adds no more than 10% of the average person’s total sodium intake (Scherer & Dakota 2019). The American Health Association recommends a more conservative standard of 20 mg/L to protect heart and kidney patients. According to Figure 9, the proportion of sodium is greater in the Krishna River basin at Banpimpri (486 mg/L), and Supe (355 mg/L), lower in the Krishna River at Taklikazi (8 mg/L), and lower in the Godavari River basin at Ghodegaon (8 mg/L).

The nitrate concentration should not be higher than 45 mg/L (Scherer & Dakota 2019). High nitrate levels may lead to various diseases. Adults can drink water at considerably higher concentrations than infants without adverse effects (Scherer & Dakota 2019). Treatment of such water includes anionic ion exchange, reverse osmosis, distillation and/or deionization (Scherer & Dakota 2019).

Nitrate with phosphorus in excess amounts can accelerate eutrophication, causing dramatic increases in aquatic plant growth and changes in the types of plants and animals that live in streams [16]. According to Figure 10, nitrate is highly expressed in Shrigonda (49 mg/L), Rassin (46 mg/L), Jamkhed (42 mg/L), Supe (42 mg/L), and Dahigaon (42 mg/L) in the Krishna River basin. Excess nitrate can be harmful, especially for babies who consume too much nitrate, which can subsequently cause blood to carry oxygen and can cause methemoglobinemia (also known as blue baby syndrome)[09]. According to Figure 10, the lowest nitrate concentrations were found in Taklikazi (07 mg/L), Ghogargaon (07 mg/L), Ghodegaon (07 mg/L), and Arangaon (07 mg/L) in the Krishna River basin, and they were also found in Khosepuri (07 mg/L), Devlali (07 mg/L), Bote (07 mg/L), and Ghotan (08 mg/L), in the Godavari River basin.
The pH of water is a measure of acidity or alkalinity. The pH is a logarithmic scale based on a measure of the free hydrogen ion in the water. The scale runs from 0 to 14, where 7 is considered neutral, 0 to 7 is considered acidic and 7 to 14 is considered alkaline. Because pH can be affected by dissolved minerals and chemicals, pH is an important indicator of changes in water chemistry (Scherer & Dakota 2019). Sewage into water can change the hydrogen ion concentration (pH) in the water, and the concentration becomes more alkaline depending on the type of waste and chemical substances contained within the water (Kharake & Raut 2021). According to the U.S. Environmental Protection Agency, drinking water with a pH between 6.0 and 9.5 is generally considered satisfactory (Scherer & Dakota 2019).
According to Figure 11, pH was greater at Khosepuri (8.1), and Takalibhan (8.1), in the Godavari River basin and was also found at Supe in the Krishna River basin. If the pH of the water is too high or too low, the aquatic organisms living within it will die. pH can also affect the solubility and toxicity of chemicals and heavy metals in water [13]. Most aquatic creatures prefer a pH range of 6.5-9.0, some can live in water pH levels outside of this range [13]. A higher pH does not pose any health risks, it can cause the skin to become dry, itchy and irritated [34]. The usual pH range of surface water systems is 6.5 to 8.5, whereas the pH range of groundwater systems is generally 6 to 8.5. The U.S. Environmental Protection Agency (EPA) is responsible for monitoring public drinking water quality across the United States by measuring pH levels. The EPA recommends maintaining the municipal water supply at a pH of 6.5 to 8 [24]. Figure 11 The lowest pH was found at Loni Pravara nagar (7.3) in the Godavari River basin.

The SAR (Sodium Adsorption Ratio) is used to evaluate the hazard in irrigation waters caused by sodium. The SAR relates the concentration of sodium ion to the concentration of magnesium and calcium ion (Ramesh & Jain 2017). According to Figure 12, the SAR (Sodium Adsorption Ratio) was greater at Banpimpri (7.63 mmol/L), and Supe (6.12 mmol/L) in the Krishna River basin, and lowest at Ghodegaon (0.34 mmol/L), and Arangaon (0.5 mmol/L), in the Godavari River, and was also found at Takalikazi (0.36 mmol/L) in the Krishna River basin. However, if SAR is greater than 1.0 mmol/L is an indication of a high river water sodium content due to low calcium and magnesium ion contents (Jamei et al. 2024). Such water is not ideal for agricultural activities because it can damage the soil structure and reduce crop productivity (Jamei et al. 2024).

Sulfate may enter groundwater through weathering of sulfide-bearing deposits. The acceptable limit of sulfate is 200 mg/L (Sushil & Suhas 2020). A high sulfate content also affects the taste of water and results in the formation of a hard scale in boilers and heat exchangers. Treatment includes reverse osmosis (Scherer & Dakota 2019). Water containing high levels of sulfates, particularly magnesium sulfate (Epson salts) and sodium sulfates (Glauber’s salt), may have a laxative effect on people who are unaccustomed to water (Scherer & Dakota 2019).
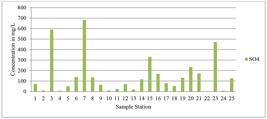
According to Figure 13, the higher sulfate concentrations occurred at Dahigaon (682 mg/L), Banpimpri (590 mg/L), and Supe (471 mg/L), in the Krishna River basin. At high levels, sulfate can give water a bitter or medicinal taste and can have laxative effects [16]. People who drink water with high sulfate concentrations can experience diarrhea and dehydration. Infants are often more sensitive to sulfate than adults are. To be safe, only water with a sulfate concentration lower than 500 mg/L must be used [16]. According to Mahour & Patel (2017) and Katakwar & Katakwar (2016), the tolerance range for sulfate is 200 to 400 mg/L. In the study region, shows that most of the sampling locations have lower sulfate levels, except for samples 7, 3, and 23 in the Krishna River basin (Figure 13).
Hardness is the property that results in water forming an insoluble curd with soap and is primarily due to the presence of calcium and magnesium (Scherer & Dakota 2019). Very hard waters have no known adverse health effects and may be more palatable than soft waters. Hard water is of primary concern because it requires additional soap for effective cleaning; it can form scum and curd; it can cause yellowing of fabrics; it can toughen vegetables cooked in water; and it can form scales in boilers, water heaters, pipes and cooking utensils (Scherer & Dakota 2019). According to Figure 14, total hardness is the highest in Dahigaon (1235 mg/L) among the sampling locations. Calcium and magnesium dissolve in water, which makes water "hard." The degree of hardness increases as the amount of divalent or multivalent cations dissolved in the water increases [16]. Consuming hard water can result in dry skin and hair [04].

Alkalinity is a measure of the capacity of water to neutralize acids (Scherer & Dakota 2019). Water may have a low alkalinity rating but a relatively high pH or vice versa, so alkalinity alone is not of major importance as a measure of water quality (Scherer & Dakota 2019). Alkalinity is not considered detrimental to humans but is generally associated with high pH values, hardness and excessive dissolved solids. High-alkalinity waters may also have a distinctly flat, unpleasant taste. Treatment involves ion exchange via the addition of a tank media or reverse osmosis (Scherer & Dakota 2019).
According to Figure 15, total alkalinity higher levels were found at Banmimpri (555.74 mg/L), Dahigaon (495.9 mg/L), and Supe (404.1 mg/L) in the Krishna River basin. Higher alkalinity levels in surface water will negatively affect aquatic life. Alkalinity is also important when treating wastewater and drinking water because it influences cleaning processes such as anaerobic digestion [36]. Unless kidney disease, alkaline water does not pose any serious health risks. A high pH could make your skin dry and itchy or cause an upset stomach (Kozisek 2020).

4.1. Water Quality Index
The water quality index was calculated with the Brown et al. (1972) method. The calculation of the WQI was performed using the weighted arithmetic water quality index, which was originally proposed by Horton in 1965 and developed by Brown et al. (1972), Ram et al. (2021). According to Brown’s methods, water quality was classified into five classes 1) Excellent, 2) Good, 3) Poor, 4) Very Poor, and 5) Unfit for Consumption (Table 4).
The water quality indices of various sites on the Godavari and Krishna Rivers were calculated with the help of Brown’s method. The values are shown with the following Table 5 with water quality status: 1) Excellent, 2) Good, 3) Poor, 4) Very Poor, and 5) Unfit for Consumption.
According to Brown’s methods, water quality is classified into five classes Excellent, Good, Poor, Very Poor and Unfit for Consumption. So according to calculations in sample stations Arangaon Krishna river, Bhitkewadi Krishna river, Ghodegaon Godavari river, Ghogaraonkarishna river, Ghotan Godavari river, Jakhangaon Krishna river, and Takalikazi Krishna river, water quality is excellent (Figure 16). A potable water is free of any kind of contaminant, such as heavy metals, pesticides, microbes and other contaminants, and can be considered suitable for drinking. The sample stations Ambikhalsa Godavari River,Bote Godavari River, Devlali Godavari River, Jamkhed Krishna River, Rahata Godavari River, Shirasgaon Godavari River, and Shrigonda Krishna River the water quality is good (Figure 16). The water quality is poor in sample stations Banpimpri Krishna River, Chandanpuri Godavari River, Ghargaon Krishna River, Jamkhed Krishna River, Khosepuri Godavari River, Kokangaon Godavari River, Loni Pravarnagar Godavari River, Rassin Krishna River, and Takalibhan Godavari River (Figure 16). The water quality is very poor in sample stations Supe Krishna River, (Figure 16) and sample station from the Dahigaon Krishna River was unfit for consumption (Figure 16). Some substances that can make water unfit for drinking include heavy metals, pesticides and faecal matter from humans or animals. The concentration of the parameters has been summarized in Table 6.

4.2. Correlation Analysis
A correlation matrix was prepared to determine the relationships between different parameters, presented in Table 7 (Kharake& Raut2021). The highest and most positive correlations are indicated in highest value. The highest correlation was observed between the SAR (sodium adsorption ratio) and Na (0.96). There is also a positive correlation between total hardness and Ca (0.95). The pH and K parameters exhibited a negative relationship (-0.12), in Table 7. Some parameters had a neutral or null correlation between the pH and EC (0.01), as indicated in Table 7.
Statistical Summary of Physicochemical Parameters (Kharake& Raut 2021). [All units in mg/L, excepts pH, EC (μs/L), and SAR=(mmol /L)], min-minimum, max-maximum, and arithmetic mean.
5 Conclusion
Water pollution is a global issue, and the world community is facing the worst results from polluted water. Major sources of water pollution are the discharge of domestic and agricultural waste, population growth, the excessive use of pesticides and fertilizers and urbanization. The quality of surface water in rivers can be affected by normal processes such as soil weathering, rainfall and erosion, as well as human activities such as manufacturing and agrarian production (Das 2016). From the investigation of the Godavari River and Krishna River in the Ahmednagar district, it was concluded that the water of the Godavari River and Krishna River is contaminated. The domestic wastewater of the cities was a major factor that is responsible for contamination of the Godavari River, and the Krishna River, and can be recognized by key parameters, such as HCO3, Ca, Cl, EC, F, K, Mg, Na, NO3 -, pH, SAR, SO4 -2, total hardness and total alkalinity.
References
- Al-Ansari, N., Adamo, N., Sissakian, V., Knutsson, S. & Laue, J. 2018, ‘Water Resources of the Tigris River Catchment: Water Resources of the Tigris River Catchment’, Journal of Earth Sciences and Geotechnical Engineering, vol. 83, pp. 21-42
- American Public Health Association 2005, Standard Methods for the Examination of Water and Wastewater, 21st edn, American Public Health Association, Washington.
-
Aavanira Biotech Private Limited 2015, Comprehensive Study Of Polluted River Stretches And Preparation Of Action Plan Of River Godavari, viewed 10 January 2020, <Aavanira Biotech Private Limited 2015, Comprehensive Study Of Polluted River Stretches And Preparation Of Action Plan Of River Godavari, viewed 10 January 2020, https://www.aavanira.com >.
» https://www.aavanira.com - Brown, R.M., Mccleiland, N.J., Deiniger, R.A. & O’Connor, M.F. 1972, ‘Water quality index-crossing the physical barrier’, Research Jerusalem, vol. 6, pp. 787-797.
- Das, A. 2016, ‘Comparative Study of Pollution Status of Two Main Rivers: Karola and Tista of Jalpaiguri, West Bengal, India’, Journal of Chemical and Pharmaceutical Research, vol. 2017, no. 7, pp. 76-81
- Dwivedi, A.K. 2017, ‘Researches in Water Pollution: A Review’, International Serial Directories. International Research Journal of Natural and Applied Sciences (IRJNAS), vol. 118, pp. 2349-4077.
- Jamei, M., Ali, M., Karbasi, M., Karimi, B., Jahannemaei, N., Farooque, A.A. & Yaseen, Z.N. 2024, ‘Monthly sodium adsorption ratio forecasting in rivers using a dual interpretable glass-box complementary intelligent system: Hybridization of ensemble TVF-EMD’, Expert Systems with Applications, vol. 237, 121512.
- Katakwar, M. & Katakwar, C.M. 2016, ‘Narmada river water: Pollution and its impact on the human health’, International Journal of Chemical Studies, vol. 4, no. 2, pp. 66-70.
- Kharake, A.C. & Raut, V.S. 2021, ‘An assessment of water quality index of Godavari river water in Nashik city, Maharashtra’, Applied Water Science, vol. 11, no. 6.
- Kozisek, F. 2020, ‘Regulations for calcium, magnesium or hardness in drinking water in the European Union member states’, Regulatory Toxicology and Pharmacology, vol. 112, 104589.
-
Kumar Akkaraboyina, M. 2012, Assessment of water quality index of River Godavari at Rajahmundry, viewed 10 January 2020, < 2012, Assessment of water quality index of River Godavari at Rajahmundry, viewed 10 January 2020, https://www.researchgate.net/publication/312737049 >.
» https://www.researchgate.net/publication/312737049 - Mahour, P.K., & Patel, T. 2017,‘Research Organisation Physico-Chemical Analysis of Ground Water Quality of Kalavad Taluka of Jamnagar District (Gujarat)’, JPRC - Journal of Progressive Research in Chemistry
- Nayak, J.G. 2016,‘Assessment Of Water Quality Of Godavari River At Nashik, Maharashtra, India’, International Journal of Civil Engineering and Technology, vol. 7, no. 1, pp. 83-92.
-
Omer, N.H. 2019, Water Quality Parameters, viewed 10 January 2020, < 2019, Water Quality Parameters, viewed 10 January 2020, https://www.intechopen.com >.
» https://www.intechopen.com - Ram, A., Tiwari, S.K., Pandey, H.K., Chaurasia, A.K., Singh, S. & Singh, Y. 2021, ‘Groundwater quality assessment using water quality index (WQI) under GIS framework’, Applied Water Science, vol. 11, no. 2.
-
Ramesh, C. & Jain, S. 2017, Which Physical, Chemical and Biological Parameters of water determine its quality? Solid Liquid Resource Management In Smart Cities View Project, viewed 10 January 2020, < 2017, Which Physical, Chemical and Biological Parameters of water determine its quality? Solid Liquid Resource Management In Smart Cities View Project, viewed 10 January 2020, https://doi.org/10.13140/RG.2.2.29178.90569 >.
» https://doi.org/10.13140/RG.2.2.29178.90569 -
Scherer, T. & Dakota, N. 2019, A Quick Look at Safe Levels in Drinking Water (most are based on EPA recommendations), viewed 10 January 2020, < 2019, A Quick Look at Safe Levels in Drinking Water (most are based on EPA recommendations), viewed 10 January 2020, https://www.ndsu.edu/waterquality >.
» https://www.ndsu.edu/waterquality - Sushil, K.M. & Suhas, C. 2020, ‘Arts, Sculpture and Architecture in Marathwada’, One Day Interdisciplinary National Conference, Paithan (Maharastra), India.
- Tabassum, N., Das, S. & Ghosh, M. 2020, ‘Scientific Study Of Dying Rivers For Societal Benefits: A Comparative Analysis Of Two Rivers In Two South Asian Countries’, International Journal Of Scientific & Technology Research, vol. 9, no. 1.
- Tchobanoglous, G., Burton, F.L. & Stensel, H.D. 2003, Metcalf & Eddy Wastewater Engineering: Treatment and Reuse, 4th edn, Tata McGraw-Hill Limited, New Delhi.
- Vistu, S.T. 2019, ‘A Review on Conceptual Model of in Basin Plant to Increase Self Purification of River’, International Journal for Research in Applied Science and Engineering Technology, vol. 7, no. 7, pp. 335-40.