Abstract
Precipitation is an important object of study and plays an important role in the dynamics of rainfall distribution in a region. This study investigated the spatial and temporal variation of precipitation in the São Francisco River Basin (SFRB). A historical series of data from 1989 to 2018 was analyzed, and a random function was decomposed into trend and residual components for analysis of precipitation. Interpolation techniques were used to analyze precipitation spatial behavior over time, using high-resolution precipitation maps. Our results showed that the exponential model prevailed in four periods. The findings also showed a high precipitation variability in the SFRB and enabled us to monitor precipitation behavior over the years, as well as in the different sub-regions in SFRB. Finally, important information was obtained, enabling, for instance, the identification of vulnerable areas suffering from lack of rainfall.
Keywords:
kriging; R software; variogram
Resumo
A precipitação é um importante objeto de estudo e desempenha um papel importante na dinâmica da distribuição da chuva em uma região. Este estudo teve como objetivo investigar a variação espacial e temporal da precipitação na Bacia do Rio São Francisco (SFRB). Uma série histórica de dados de 1989 a 2018 foi analisada. Uma função aleatória foi decomposta em componentes de tendência e de resíduos para análise de precipitação. Técnicas de interpolação foram utilizadas para analisar o comportamento espacial da precipitação ao longo do tempo, usando mapas de precipitação de alta resolução. Nossos resultados mostraram que o modelo exponencial prevaleceu em quatro períodos. Os resultados também mostraram uma alta variabilidade da precipitação no SFRB e nos permitiu monitorar o comportamento da precipitação ao longo dos anos, bem como nas diferentes sub-regiões da SFRB. Por fim, foram obtidas informações importantes que permitiram, por exemplo, identificar áreas vulneráveis e que sofrem com a falta de chuvas.
Palavras-chave:
Krigagem; Software R; Variograma
1. INTRODUCTION
Precipitation is a hydrological variable with high temporal and spatial variability; therefore, its study is central to understanding rainfall distribution dynamics within a given region. Such information is of great importance to manage water resources directly related to commercial activities and urban supply (Medeiros et al., 2019bMEDEIROS, E. S.; LIMA, R. R.; OLINDA, R. A.; SANTOS, C. A. C. Modeling Spatiotemporal Rainfall Variability in Paraíba, Brazil. Water, v. 11, n. 9, p. 1843, 2019b. https://doi.org/10.3390/w11091843
https://doi.org/10.3390/w11091843...
). Moreover, precipitation variability becomes more accentuated when considering large drainage basins, such as the São Francisco River Basin (SFRB) (Silva and Clarke, 2004SILVA, B. C. DA; CLARKE, R. T. Análise estatística de chuvas intensas na bacia do rio São Francisco. Revista Brasileira de Meteorologia, v. 19, n. 3, p. 265-272, 2004.). In this sense, to better understand precipitation dynamics, the use of statistical modeling to interpolate non-sampled sites has arisen; however, it is not an easy task due to equipment malfunction, operating errors, or lack of adequate coverage of instruments in the region under study (Araújo et al., 2020ARAÚJO, H. L.; MONTENEGRO, A. A. A.; LOPES, I.; CARVALHO, A. A.; SILVA, E. C. E; GONÇALVES, G. E. Espacialização da precipitação na Bacia Hidrográfica do Rio Brígida no semiárido de Pernambuco. Revista Brasileira de Geografia Física, v. 13, n. 1, p. 391-405, 2020. https://doi.org/10.26848/rbgf.v13.1.p391-405f
https://doi.org/10.26848/rbgf.v13.1.p391...
).
SFRB covers several states and municipalities and is of paramount importance to urban and rural populations. In this drainage basin, water resources are used for consumption, irrigation, livestock, and energy generation. Many fishermen and boatmen make their living from this area, and underground minerals and vegetation drive the local economy. Furthermore, although power generation through hydroelectric plants is sustainable, water supply depends on streamflows which, in turn, depend on climatic conditions, especially a regular rainfall distribution (Pereira Filho et al., 2020PEREIRA FILHO, A. J.; PINTO, M. A. R. R. C.; MANFREDINI, L.; LIMA, F. A.; PINTO, A. C. E C.; MORIBE, C. H. et al. CESP Integrated Precipitation Estimation and Forecasting System for its Watersheds. Revista Brasileira de Meteorologia, v. 35, n. 4, p. 529-552, 2020. https://doi.org/10.1590/0102-7786352023
https://doi.org/10.1590/0102-7786352023...
).
The construction of high-resolution maps of rainfall levels in a region is of fundamental importance for hydrological planning, helping to manage water resources and reducing the risks caused by natural disasters, such as floods, erosion and droughts (Parker et al., 2019PARKER, S. R.; ADAMS, S. K.; LAMMERS, R. W.; STEIN, E. D.; BLEDSOE, B. P. Targeted hydrologic model calibration to improve prediction of ecologically-relevant flow metrics. Journal of Hydrology, v. 573, p. 546-556, 2019. https://doi.org/10.1016/j.jhydrol.2019.03.081
https://doi.org/10.1016/j.jhydrol.2019.0...
). Data on precipitation levels in a region is usually obtained from locations where irregularly distributed rainfall stations are installed. Although increasing the amount of rain gauges seems to be a more adequate solution, this implies an increase in the operating price (Pirani and Modarres, 2020PIRANI, F. J.; MODARRES, R. Geostatistical and deterministic methods for rainfall interpolation in the Zayandeh Rud basin, Iran. Hydrological Sciences Journal, v. 65, n. 16, p. 2678-2692, 2020. https://doi.org/10.1080/02626667.2020.1833014
https://doi.org/10.1080/02626667.2020.18...
). Given this, there is a need to use interpolation methods in order to provide a continuous map of precipitation, especially in regions with a low density of pluviometers.
There are several interpolation methods in the literature, especially deterministic methods, such as those based on inverse distance weighting (IDW) and geostatistical methods, such as ordinary and universal kriging. Chen and Liu (2012)CHEN, F. W.; LIU, C. W. Estimation of the spatial rainfall distribution using inverse distance weighting (IDW) in the middle of Taiwan. Paddy and Water Environment, v. 10, n. 3, p. 209-222, 2012. https://doi.org/10.1007/s10333-012-0319-1
https://doi.org/10.1007/s10333-012-0319-...
used the IDW method to interpolate rainfall data in the middle Taiwan region based on information from 46 rainfall stations, verifying that this method produces more accurate estimates in the dry period than in the rainy ones. Geostatistics is one of the known statistical methodologies for obtaining estimated values in non-sampled locations, providing high-resolution maps of interpolated values for the entire study region. Wanderley et al. (2013)WANDERLEY, H. S.; AMORIM, R. F. C. DE; CARVALHO, F. DE O. Spatial interpolation of precipitation in the State of Alagoas utilizing technical geostatistics. Campo Digital, v. 8, n. 1, p. 34-42, 2013. stated that geostatistical techniques, such as kriging, are useful to generate maps and show results matching the reality. Medeiros et al. (2019a)MEDEIROS, E. S.; LIMA, R. R.; OLINDA, R. A.; DANTAS, L. G.; SANTOS, C. A. C. Space-Time Kriging of Precipitation: Modeling the Large-Scale Variation with Model GAMLSS. Water, v. 11, n. 11, p. 1-16, 2019a. https://doi.org/10.3390/w11112368
https://doi.org/10.3390/w11112368...
analyzed a data set consisting of 269 rain gauge stations in the state of Paraíba and modeled the spatiotemporal dynamics of precipitation using geostatistical techniques to obtain rainfall interpolation maps. Likewise, Barros et al. (2020)BARROS, T. H. S.; BENDER, F. D.; SILVA, F. R. B.; JOSÉ, J. V.; COSTA, J. O.; COELHO, R. D. Geoestatística como ferramenta para estudos da variabilidade da precipitação pluviométrica no estado de Pernambuco, Brasil. Agrarian, v. 13, n. 50, p. 513-520, 2020. https://doi.org/10.30612/agrarian.v13i50.11982
https://doi.org/10.30612/agrarian.v13i50...
used geostatistical tools to investigate the variability of mean annual precipitation in the state of Pernambuco, building a rainfall distribution map.
Some scientific research has used interpolation techniques to model the spatial distribution of precipitation in the SFRB. Silva and Clarke (2004)SILVA, B. C. DA; CLARKE, R. T. Análise estatística de chuvas intensas na bacia do rio São Francisco. Revista Brasileira de Meteorologia, v. 19, n. 3, p. 265-272, 2004. built variograms, geostatistical method, to study the spatial correlation of heavy rainfall in the SFRB for 100 years of return time, featuring 100-year rainfall return maps, concluding that climate difference between the regions that make up the basin and the orographic justify the high spatial variability of rainfall. Santos et al. (2017b)SANTOS, C. A. G.; BRASIL NETO, R. M.; DE ARAÚJO PASSOS, J. S.; DA SILVA, R. M. Drought assessment using a TRMM-derived standardized precipitation index for the upper São Francisco River basin, Brazil. Environmental Monitoring and Assessment, v. 189, n. 6, p. 189-250, 2017b. https://doi.org/10.1007/s10661-017-5948-9
https://doi.org/10.1007/s10661-017-5948-...
performed a detailed evaluation of drought in the upper San Francisco Basin, and used the IDW interpolation technique for building maps of monthly and annual rainfall based on daily data from the TRMM satellite.
In this sense, high-resolution precipitation maps have become a useful tool for managing water resources. Thus, this study investigated the spatial variation and sought to understand the rainfall mechanism in the SFRB, identifying priority sectors for a more detailed investigation of areas with a shortage of rainfall.
2. MATERIAL AND METHODS
The São Francisco River Basin (SFRB) covers 8% of the Brazilian territory. It has an extension of 2,863 kilometers and a drainage area of more than 639,219 square kilometers. The São Francisco River extends from the Canastra Mountains in Minas Gerais state to the Atlantic Ocean on the border between Alagoas and Sergipe states. This vast basin integrates the Northeast, Southeast, and Midwest regions of Brazil, covering six states (Minas Gerais, Goiás, Bahia, Pernambuco, Alagoas, and Sergipe) and 508 municipalities, which hold a population of 20,330,051 inhabitants (CODEVASF, 2021CODEVASF. São Francisco. 2021. Available in: Available in: https://www.codevasf.gov.br/area-de-atuacao/bacia-hidrografica/sao-francisco . Access at: 19 may 2021.
https://www.codevasf.gov.br/area-de-atua...
). In short, the São Francisco River becomes a strategic link between the Southeast and Northeast regions of Brazil.
The main reservoirs in the SFRB for streamflow control and power generation are Três Marias in Minas Gerais, Sobradinho, Paulo Afonso, and Itaparica in Bahia, and Xingó between Alagoas and Sergipe states. The basin encompasses different biomes, namely, Cerrado, Atlantic Forest, coastal and island biomes, and Caatinga (CBHSF, 2021CBHSF. Comitê da Bacia do Rio São Francisco. 2021. Belo Horizonte, MG. Available in: Available in: https://cbhsaofrancisco.org.br/a-bacia/ . Access at: 18 may 2021.
https://cbhsaofrancisco.org.br/a-bacia/...
). Along the SFRB, socioeconomic differences can be observed, ranging from wealthy and highly-populated to extremely poor and sparsely-populated areas.
The dataset used in this study refers to rainfall in the SFRB region, divided into four hydrographic regions: Upper, Middle, Sub-Middle, and Lower São Francisco (Figure 1a). Figure 1b there is a map of the spatial distribution of altitude in the SFRB, obtained through ordinary kriging, and it is possible to observe that the Upper SF and Lower SF regions have the highest and lowest altitude values, respectively.

It is known that altitude influences the climatic conditions of a region. Cavalcanti and Côrrea (2015)CAVALCANTI, L. C. S.; CORRÊA, A. C. B. Pluviosidade no parque nacional do Catimbau (Pernambuco): seus condicionantes e seus efeitos sobre a paisagem. Geografia (Londrina), v. 23, n. 2, p. 133-156, 2015. http://dx.doi.org/10.5433/2447-1747.2014v23n2p133
http://dx.doi.org/10.5433/2447-1747.2014...
report a linear relationship of 93% between altitude and rainfall in the Catimbau National Park, Pernambuco. Petrungaro and Hora (2019)PETRUNGARO, A. C. N.; HORA, M. A. G. M. Avaliação das Secas Meteorológica e Hidrológica na Bacia Contribuinte à Barragem de Juturnaíba, Estado do Rio de Janeiro, Brasil. Anuário do Instituto de Geociências, v. 42, n. 4, p. 309-321, 2019. http://dx.doi.org/10.11137/2019_4_309_321
http://dx.doi.org/10.11137/2019_4_309_32...
state that orographic configurations significantly influence the spatial distribution of precipitation in the basin that contributes to the Juturnaíba Dam, Rio de Janeiro.
It consisted of 333 rain gauge stations evaluated for 30 years (1989 to 2018), divided into five-year intervals to investigate the temporal behavior of precipitation. The data were gathered from the HidroWeb information system from the National Water Agency (ANA), which is available at the website http://hidroweb.ana.gov.br.
Descriptive measures of minimum, maximum, mean, median, standard deviation, and variation coefficient were used for data exploratory investigation every 5 years.
Geostatistical analysis of mean annual precipitation recorded in the 333 rain gauge stations considered the decomposition of random function [Ζ (s)] into trend [Y (s)] and stochastic residual [ε (s)] components, as follows Equation 1:
In Equation (1), Ζ (s) is the mean annual precipitation and s is the vector of geographical coordinates. A multiple linear regression fit was proposed for the analysis of trend componente Ζ (s), considering the linear effect of latitude, altitude and longitude, and quadratic effect of longitude. After the fitting, the coefficient of determination (R²) was obtained to verify how much of the precipitation variability was explained by the trend.
The residuals obtained by the following regression were submitted to sample variogram (Webster and Oliver, 2007WEBSTER, R.; OLIVER, M. A. Geostatistics for environmental scientists. 2. ed. Chester: Wiley, 2007. ). Variogram theoretical models (spherical, exponential, and Gaussian) were fitted to sample variogram pseudo-data. Spatial dependence index (SDI), which is the ratio between nugget effect and sill, was also obtained (Cambardella et al., 1994CAMBARDELLA, C. A.; MOORMAN, T. B.; NOVAK, J. M.; PARKIN, T. B.; KARLEN, D. L.; TURCO, R. F. et al. Field-Scale Variability of Soil Properties in Central Iowa Soils. Soil Science Society of America Journal, v. 58, n. 5, p. 1501-1511, 1994. https://doi.org/10.2136/sssaj1994.03615995005800050033x
https://doi.org/10.2136/sssaj1994.036159...
) and classified as follows: SDI ≤ 25% - strong spatial dependence, 25% < SDI < 75% - moderate spatial dependence, and SDI ≥75% - weak spatial dependence. Several works in the literature have used this index to measure the degree of spatial dependence in precipitation data in Brazil (Montebeller et al., 2007MONTEBELLER, C. A.; CEDDIA, M. B.; CARVALHO, D. F. D.; VIEIRA, S. R.; FRANCO, E. M. Variabilidade espacial do potencial erosivo das chuvas no Estado do Rio de Janeiro. Engenharia Agrícola, v. 27, p. 426-435, 2007. https://doi.org/10.1590/S0100-69162007000300011
https://doi.org/10.1590/S0100-6916200700...
; Gamero et al., 2020GAMERO, P.; URIBE-OPAZO, M. A.; DE BASTIANI, F.; JOHANN, J. A.; GUEDES, L. P. C. Variabilidade espacial da precipitação no cultivo de milho segunda safra no Paraná utilizando o modelo Wave. IRRIGA, v. 25, n.3, p. 521-536, 2020. https://doi.org/10.15809/irriga.2020v25n3p521-536
https://doi.org/10.15809/irriga.2020v25n...
).
A weighted least-squares method was used for model estimates, with weights being the ratio between the number of points and the square of their distances. In geostatistics there are different interpolation methods. In this research, the methods of Ordinary Kriging (OK) and Universal Kriging (UK) were proposed. After modeling the trend and obtaining estimates for theoretical variogram models, the next step was applying the OK and UK methods for interpolate annual rainfall values. Additionally, we use the IDW deterministic interpolation method in order to perform comparisons between these three methods. In this method, we insert a power value equal to 2, as recommended in the literature (Goovaerts 2000GOOVAERTS, P. Geostatistical approaches for incorporating elevation into the spatial interpolation of rainfall. Journal of hydrology, v. 228, n. 1-2, p. 113-129, 2000. https://doi.org/10.1016/S0022-1694(00)00144-X
https://doi.org/10.1016/S0022-1694(00)00...
; Pirani and Modarres, 2020PIRANI, F. J.; MODARRES, R. Geostatistical and deterministic methods for rainfall interpolation in the Zayandeh Rud basin, Iran. Hydrological Sciences Journal, v. 65, n. 16, p. 2678-2692, 2020. https://doi.org/10.1080/02626667.2020.1833014
https://doi.org/10.1080/02626667.2020.18...
).
For selection of the interpolation method, we apply leave-one-out cross validation. This cross-validation consists of removing the value observed at a geographical coordinate s 𝑖 (𝑖 = 1, 2, …, 333) and interpolating this value. To this end, root-mean-square error (RMSE), mean absolute error (MAE), and determination coefficient (R²) were used to select the most suitable method for the interpolation. The lowest RMSE and MAE values and the highest R2 values were sought for selection (Moriasi et al., 2007MORIASI, D. N.; ARNOLD, J. G.; VAN LIEW, M. W.; BINGNER, R. L.; HARMEL, R. D.; VEITH, T. L. Model Evaluation Guidelines for Systematic Quantification of Accuracy in Watershed Simulations. Transactions of the ASABE, v. 50, n. 3, p. 885-900, 2007. https://doi.org/10.13031/2013.23153.
https://doi.org/10.13031/2013.23153...
).
After fitting and selecting the model, annual rainfall interpolation maps were built using a regular 50,000-point grid, with points equivalent to each interpolated value in an area of 12.82 square kilometers. All statistical analyses were conducted using the R software (R Core Team, 2018R CORE TEAM. R: A language and environment for statistical computing. Vienna, 2018.) and the ggplot2 (Wickham, 2009WICKHAM, H. ggplot2: Elegant Graphics for Data Analysis. New York: Springer, 2009. ) and gstat (Pebesma, 2004PEBESMA, E. J. Multivariable geostatistics in S: the gstat package. Computers & Geosciences, v. 30, n. 7, p. 683-691, Aug. 2004. https://doi.org/10.1016/j.cageo.2004.03.012
https://doi.org/10.1016/j.cageo.2004.03....
) libraries.
3. RESULTS AND DISCUSSION
Table 1 shows the descriptive measures for accumulated annual precipitation over 30 years over a five-year interval. The analysis using information from the 333 rain-gauge stations in the SFRB showed that the highest annual mean (1143.7 mm) occurred from 1989 to 1993. A decrease in rainfall accumulation was also observed, except from 1999 to 2003. Such a decline continued over the periods and was reflected in the magnitude of the calculated means and medians. The coefficient of variation (CV) showed a variability higher than 30% for all periods, hence a high variability.
Descriptive measures of accumulated annual precipitation in 333 rain-gauge stations in the São Francisco River Basin.
Climate changes in the SFRB are related to the transitioning from a humid and semi-humid climate in the Upper São Francisco to an arid and semi-arid climate in the Sub-Middle São Francisco. The climate in the SFRB area is strongly affected by rainfall indices, with mean annual precipitation between 400 and 1,500 mm, mean annual temperature from 18 to 27°C, and a low cloud cover, thus leading to a high solar radiation incidence (Pereira et al., 2007PEREIRA, S. B.; PRUSKI, F. F.; SILVA, D. D. DA; RAMOS, M. M. Study of the hydrological behavior of São Francisco River and its main tributaries. Revista Brasileira de Engenharia Agrícola e Ambiental, v. 11, n. 6, p. 615-622, 2007. https://doi.org/10.1590/s1415-43662007000600010; SINGREH, 2002SINGREH (Brasil). Plano Nacional de Recursos Hídricos. Diagnóstico das Regiões Hidrográficas - Versão 2: Bacia do Rio São Francisco. Brasília, 2002. ). Dantas and Oliveira (2021)DANTAS, G. D.; OLIVEIRA, L. A. Analysis of spatial continuity of precipitation in the são francisco river basin in its area of occurrence in the state of minas gerais-brazil, historical series 2004 to 2017. Brazilian Journal of Development, v. 7, n. 3, p. 23585-23595, 2021. https://doi.org/10.34117/bjdv7n3-190
https://doi.org/10.34117/bjdv7n3-190...
studied data from 39 rain-gauge stations in the SFRB, in the state of Minas Gerais, between 2014 and 2017 and found that precipitation ranged from 594 to 1730 mm, with a mean of 1,223 mm, a standard deviation of 310, maximum of 1,730 mm, and a minimum of 594 mm.
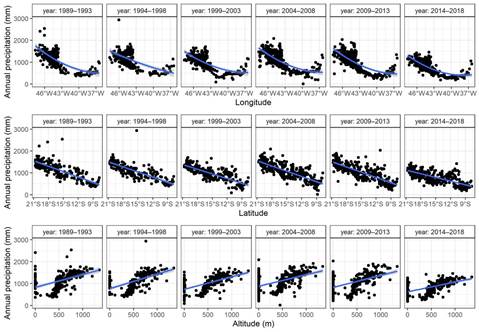
Figure 2 shows the behavior of precipitation as a function of longitude, latitude and altitude for each time interval. Note that latitude and altitude have a linear relationship and longitude a quadratic behavior in relation to total annual precipitation. Thus, in adjusting the trend we will use these effects on these components.

Annual precipitation data for the basin as a function of longitude, latitude and altitude.
Table 2 shows the estimates of the multiple regression model considering geographical coordinates as regressor variables. The variables were statistically significant (P < 0.01) in all six periods. The negative effects of latitude suggest that the accumulated annual precipitation decreases in the south-north direction in the study region. The high determination coefficients suggest that part of the spatial variability in accumulated precipitation within the SFRB can be explained by the trend component.
Table 3 shows the MAE, RMSE, and R² values obtained in the leave-one-out cross-validation for the interpolation methods IDW, Ordinary Kriging and Universal Kriging. In all scenarios, the methods based on geostatistics were superior to the deterministic IDW method, with the universal kriging interpolation presenting a better performance in four of the six time intervals. Ordinary Kriging presented the best interpolation in the periods comprising the years 2004 to 2013. Pirani and Modarres (2020)PIRANI, F. J.; MODARRES, R. Geostatistical and deterministic methods for rainfall interpolation in the Zayandeh Rud basin, Iran. Hydrological Sciences Journal, v. 65, n. 16, p. 2678-2692, 2020. https://doi.org/10.1080/02626667.2020.1833014
https://doi.org/10.1080/02626667.2020.18...
carried out a study in which they compared deterministic and geostatistical interpolation methods in rainfall data in the Zayandeh Rud Basin, Iran. In this study, the authors concluded that geostatistical interpolation methods produce better accuracies compared to deterministic methods, when considering a larger number of meters.
Result of the leave-one-out cross-validation for the interpolation methods IDW, Ordinary Kriging and Universal Kriging.
The exponential variogram model prevailed in four periods (1989-1993, 1994-1998, 2004-2008, 2009-2013 and 2014-2018), followed by the Gaussian and Spherical models from 1994-1998 and 1999-2003, respectively. Santos et al. (2017a)SANTOS, W. M.; SOUZA, R. M. S.; SOUZA, E. S.; ALMEIDA, A. Q. DE; DANTAS ANTONINO, A. C. Spatial variability of rainfall seasonality in semi-arid region of Brazil. Journal of Environmental Analysis and Progress, v. 2, n. 4, p. 368-376, 2017a. https://doi.org/10.24221/jeap.2.4.2017.1466.368-376
https://doi.org/10.24221/jeap.2.4.2017.1...
studied the rainfall seasonal behavior in the Brazilian semi-arid using geostatistical tools and observed that the spherical model had the best R² values for the analyzed variables. However, high R² values do not imply that the values fitted by the model are close to the observed ones, but that there is a strong linear relationship between them. Silva Neto et al. (2020)SILVA NETO, V. L.; VIOLA, M. R.; MELLO, C. R.; ALVES, M. V. G.; SILVA, D. D.; PEREIRA, S. B. Heavy Rainfall Mapping for Tocantins State, Brazil. Revista Brasileira de Meteorologia, v. 35, n. 1, p. 1-11, 2020. https://doi.org/10.1590/0102-7786351017
https://doi.org/10.1590/0102-7786351017...
analyzed the annual maximum daily precipitation data for Tocantins state and the variogram models fitted were spherical, exponential, and Gaussian, with the spherical model being selected by mean absolute percentage error (MAPE).
Table 4 shows the highest sill estimate (74007.37) from 2009 to 2013, generating a range of 389 km. In the descriptive analysis, we verified that this was the period that presented the greatest variability of average annual precipitation, with a coefficient of variation of 37.3%. An inversion was observed from 1999 to 2003, reaching the lowest sill value (23285.90) and range of 368.81 km. A justification for this result is the fact that it was in this period that we observed one of the smallest variabilities of annual precipitation. Based on the spatial dependence index (SDI), it was noted that in all periods they presented a dependence classified as moderate, 25% < SDI < 75%, (Cambardella et al., 1994CAMBARDELLA, C. A.; MOORMAN, T. B.; NOVAK, J. M.; PARKIN, T. B.; KARLEN, D. L.; TURCO, R. F. et al. Field-Scale Variability of Soil Properties in Central Iowa Soils. Soil Science Society of America Journal, v. 58, n. 5, p. 1501-1511, 1994. https://doi.org/10.2136/sssaj1994.03615995005800050033x
https://doi.org/10.2136/sssaj1994.036159...
). Similar results were found in a survey that modeled the spatial distribution of annual rainfall in the state of Paraná, between 1996 and 2015, estimating a moderate dependence in 16 of the 20 years analyzed (Gamero et al., 2020GAMERO, P.; URIBE-OPAZO, M. A.; DE BASTIANI, F.; JOHANN, J. A.; GUEDES, L. P. C. Variabilidade espacial da precipitação no cultivo de milho segunda safra no Paraná utilizando o modelo Wave. IRRIGA, v. 25, n.3, p. 521-536, 2020. https://doi.org/10.15809/irriga.2020v25n3p521-536
https://doi.org/10.15809/irriga.2020v25n...
).
Estimates of the fitted variogram models for each of the six periods under study and spatial dependence index (SDI).
Figure 3 shows the rainfall distribution pattern along the hydrographic regions in the SFRB over the studied periods. The Upper São Francisco has high accumulated annual precipitation levels, which decrease mainly in the Sub-Middle region towards northeastern Brazil. The lowest precipitation indices were observed from 2014 to 2018 in all regions, with no rains above 1500 mm. The annual precipitation levels in the Sub-Middle decreased over time, with annual precipitation levels below 300 mm in the period from 2014 to 2018 in almost the entire region.
Assis et al. (2015)ASSIS, J. M. O.; SOUZA, W. M.; SOBRAL, M. C. Climate analysis of the rainfall on sub‑medium part of the São Francisco River Basin based on the rain anomaly index. Revista Brasileira de Ciências Ambientais (Online), v. 1, n. 36, p. 115-127, 2015. https://doi.org/10.5327/Z2176-947820151012
https://doi.org/10.5327/Z2176-9478201510...
analyzed precipitation in the Sub-Middle of the SFRB from 1964 to 2014 and observed that, according to the rainfall anomaly index (RAI), the only dry years were between 1990 and 2000 and there was no positive RAI in 2012, which was classified as a dry and extremely dry year.
Furthermore, the Sobradinho Reservoir, with 320 kilometers of extension, is in the Sub-Middle of the SFRB, specifically within the municipalities of Sobradinho and Casa Nova, in the state of Bahia. This reservoir has a water surface of 4,214 km2 and a storage capacity of 34.1 billion cubic meters at its nominal elevation of 392.50 m, making it the largest artificial lake in Brazil (CHESF, 2021CHESF. Sobradinho: descrição do aproveitamento de sobradinho. 2021. Available in: Available in: https://www.chesf.gov.br/SistemaChesf/Pages/SistemaGeracao/Sobradinho.aspx . Access at: 15 may 2021.
https://www.chesf.gov.br/SistemaChesf/Pa...
). The useful volume (%) in the reservoir from 1999 to 2018, considering 5-year intervals, had a monthly mean of 67% of the useful volume from 2004 to 2008. However, this volume has decreased in the last decade, reaching a mean monthly percentage of 22% between 2014 and 2018 (ONS, 2021ONS (Brasil). Dados Hidrológicos. 2021. Brasília, DF. Available in: Available in: http://www.ons.org.br/historico/geracao_energia.aspx . Access at: 14 may 2021.
http://www.ons.org.br/historico/geracao_...
). Thus, our results reflect this worrying trend, as the period from 2014 to 2018 was the most critical regarding precipitation in the analyzed historical series.

The variability of precipitation between the hydrographic regions of the SFRB is a result of the peculiar characteristics of each region. A comparison between Figure 1.b and Figure 3 makes it clear that regions with high altitudes tend to have high levels of precipitation. In addition, other factors contribute to this variability in precipitation, such as the climate in the SFRB and the proximity to the ocean in the region of the mouth of the São Francisco River. Upper São Francisco, in the part located in the state of Minas Gerais, has a high altitude, with a climate classified as humid. The middle São Francisco, as it represents the largest physiographic region of the basin, has different types of climate, with a climate similar to that of the Upper São Francisco; but the levels of precipitation decrease when entering the semi-arid region, and the climates are then classified as dry and sub-humid. semi-arid. The lower-middle of the basin is recognized as the driest part, with annual precipitation ranging from 350 to 800 mm and with an average annual temperature of 27ºC, being then defined as a semi-arid and arid climate. In the Lower São Francisco, due to its proximity to the ocean, the climate is a little milder, with an annual temperature of 25ºC and average annual precipitation ranging from 800 to 1,300 mm, with a climate ranging from semi-arid to sub-humid (Hermuche, 2002HERMUCHE, P. M. O Rio de São Francisco. Brasília: CODEVASF, 2002. 58 p. Available in: Available in: https://cdn.agenciapeixevivo.org.br/media/2019/06/Cartilha-sobre-o-Rio-S%C3%A3o-Francisco.pdf . Access at: 19 may 2021.
https://cdn.agenciapeixevivo.org.br/medi...
).
4. CONCLUSIONS
Geostatistical techniques allowed us to investigate the precipitation variability throughout the sub-regions within the São Francisco River Basin over 30 years. The sub-periods analyzed showed high variability, and the accumulated annual precipitation decreased over the years evaluated. The Sub-Middle region stands out as the most vulnerable in terms of rainfall shortages, which was mostly evident from 2014 to 2018.
The geographical coordinates were significant throughout the analyzed period, with latitude having a negative effect and signaling an annual decrease in precipitation towards the south-north direction in the São Francisco River Basin. In addition, the hydrographic regions that make up the basin have peculiar characteristics, thus justifying the difference in the spatial distribution of precipitation between these regions.
5. ACKNOWLEDGMENTS
The authors would like to thank the Federal University of Grande Dourados for financial support (Research Support Program (PAP) - PROPP Notice No. 02/2021) and for granting a Scientific Initiation scholarship to the first author of this research.
6. REFERENCES
- ARAÚJO, H. L.; MONTENEGRO, A. A. A.; LOPES, I.; CARVALHO, A. A.; SILVA, E. C. E; GONÇALVES, G. E. Espacialização da precipitação na Bacia Hidrográfica do Rio Brígida no semiárido de Pernambuco. Revista Brasileira de Geografia Física, v. 13, n. 1, p. 391-405, 2020. https://doi.org/10.26848/rbgf.v13.1.p391-405f
» https://doi.org/10.26848/rbgf.v13.1.p391-405 - ASSIS, J. M. O.; SOUZA, W. M.; SOBRAL, M. C. Climate analysis of the rainfall on sub‑medium part of the São Francisco River Basin based on the rain anomaly index. Revista Brasileira de Ciências Ambientais (Online), v. 1, n. 36, p. 115-127, 2015. https://doi.org/10.5327/Z2176-947820151012
» https://doi.org/10.5327/Z2176-947820151012 - BARROS, T. H. S.; BENDER, F. D.; SILVA, F. R. B.; JOSÉ, J. V.; COSTA, J. O.; COELHO, R. D. Geoestatística como ferramenta para estudos da variabilidade da precipitação pluviométrica no estado de Pernambuco, Brasil. Agrarian, v. 13, n. 50, p. 513-520, 2020. https://doi.org/10.30612/agrarian.v13i50.11982
» https://doi.org/10.30612/agrarian.v13i50.11982 - CAVALCANTI, L. C. S.; CORRÊA, A. C. B. Pluviosidade no parque nacional do Catimbau (Pernambuco): seus condicionantes e seus efeitos sobre a paisagem. Geografia (Londrina), v. 23, n. 2, p. 133-156, 2015. http://dx.doi.org/10.5433/2447-1747.2014v23n2p133
» http://dx.doi.org/10.5433/2447-1747.2014v23n2p133 - CAMBARDELLA, C. A.; MOORMAN, T. B.; NOVAK, J. M.; PARKIN, T. B.; KARLEN, D. L.; TURCO, R. F. et al. Field-Scale Variability of Soil Properties in Central Iowa Soils. Soil Science Society of America Journal, v. 58, n. 5, p. 1501-1511, 1994. https://doi.org/10.2136/sssaj1994.03615995005800050033x
» https://doi.org/10.2136/sssaj1994.03615995005800050033x - CBHSF. Comitê da Bacia do Rio São Francisco. 2021. Belo Horizonte, MG. Available in: Available in: https://cbhsaofrancisco.org.br/a-bacia/ Access at: 18 may 2021.
» https://cbhsaofrancisco.org.br/a-bacia/ - CHEN, F. W.; LIU, C. W. Estimation of the spatial rainfall distribution using inverse distance weighting (IDW) in the middle of Taiwan. Paddy and Water Environment, v. 10, n. 3, p. 209-222, 2012. https://doi.org/10.1007/s10333-012-0319-1
» https://doi.org/10.1007/s10333-012-0319-1 - CHESF. Sobradinho: descrição do aproveitamento de sobradinho. 2021. Available in: Available in: https://www.chesf.gov.br/SistemaChesf/Pages/SistemaGeracao/Sobradinho.aspx Access at: 15 may 2021.
» https://www.chesf.gov.br/SistemaChesf/Pages/SistemaGeracao/Sobradinho.aspx - CODEVASF. São Francisco. 2021. Available in: Available in: https://www.codevasf.gov.br/area-de-atuacao/bacia-hidrografica/sao-francisco Access at: 19 may 2021.
» https://www.codevasf.gov.br/area-de-atuacao/bacia-hidrografica/sao-francisco - DANTAS, G. D.; OLIVEIRA, L. A. Analysis of spatial continuity of precipitation in the são francisco river basin in its area of occurrence in the state of minas gerais-brazil, historical series 2004 to 2017. Brazilian Journal of Development, v. 7, n. 3, p. 23585-23595, 2021. https://doi.org/10.34117/bjdv7n3-190
» https://doi.org/10.34117/bjdv7n3-190 - GAMERO, P.; URIBE-OPAZO, M. A.; DE BASTIANI, F.; JOHANN, J. A.; GUEDES, L. P. C. Variabilidade espacial da precipitação no cultivo de milho segunda safra no Paraná utilizando o modelo Wave. IRRIGA, v. 25, n.3, p. 521-536, 2020. https://doi.org/10.15809/irriga.2020v25n3p521-536
» https://doi.org/10.15809/irriga.2020v25n3p521-536 - GOOVAERTS, P. Geostatistical approaches for incorporating elevation into the spatial interpolation of rainfall. Journal of hydrology, v. 228, n. 1-2, p. 113-129, 2000. https://doi.org/10.1016/S0022-1694(00)00144-X
» https://doi.org/10.1016/S0022-1694(00)00144-X - HERMUCHE, P. M. O Rio de São Francisco. Brasília: CODEVASF, 2002. 58 p. Available in: Available in: https://cdn.agenciapeixevivo.org.br/media/2019/06/Cartilha-sobre-o-Rio-S%C3%A3o-Francisco.pdf Access at: 19 may 2021.
» https://cdn.agenciapeixevivo.org.br/media/2019/06/Cartilha-sobre-o-Rio-S%C3%A3o-Francisco.pdf - MEDEIROS, E. S.; LIMA, R. R.; OLINDA, R. A.; DANTAS, L. G.; SANTOS, C. A. C. Space-Time Kriging of Precipitation: Modeling the Large-Scale Variation with Model GAMLSS. Water, v. 11, n. 11, p. 1-16, 2019a. https://doi.org/10.3390/w11112368
» https://doi.org/10.3390/w11112368 - MEDEIROS, E. S.; LIMA, R. R.; OLINDA, R. A.; SANTOS, C. A. C. Modeling Spatiotemporal Rainfall Variability in Paraíba, Brazil. Water, v. 11, n. 9, p. 1843, 2019b. https://doi.org/10.3390/w11091843
» https://doi.org/10.3390/w11091843 - MONTEBELLER, C. A.; CEDDIA, M. B.; CARVALHO, D. F. D.; VIEIRA, S. R.; FRANCO, E. M. Variabilidade espacial do potencial erosivo das chuvas no Estado do Rio de Janeiro. Engenharia Agrícola, v. 27, p. 426-435, 2007. https://doi.org/10.1590/S0100-69162007000300011
» https://doi.org/10.1590/S0100-69162007000300011 - MORIASI, D. N.; ARNOLD, J. G.; VAN LIEW, M. W.; BINGNER, R. L.; HARMEL, R. D.; VEITH, T. L. Model Evaluation Guidelines for Systematic Quantification of Accuracy in Watershed Simulations. Transactions of the ASABE, v. 50, n. 3, p. 885-900, 2007. https://doi.org/10.13031/2013.23153
» https://doi.org/10.13031/2013.23153 - ONS (Brasil). Dados Hidrológicos. 2021. Brasília, DF. Available in: Available in: http://www.ons.org.br/historico/geracao_energia.aspx Access at: 14 may 2021.
» http://www.ons.org.br/historico/geracao_energia.aspx - PARKER, S. R.; ADAMS, S. K.; LAMMERS, R. W.; STEIN, E. D.; BLEDSOE, B. P. Targeted hydrologic model calibration to improve prediction of ecologically-relevant flow metrics. Journal of Hydrology, v. 573, p. 546-556, 2019. https://doi.org/10.1016/j.jhydrol.2019.03.081
» https://doi.org/10.1016/j.jhydrol.2019.03.081 - PEBESMA, E. J. Multivariable geostatistics in S: the gstat package. Computers & Geosciences, v. 30, n. 7, p. 683-691, Aug. 2004. https://doi.org/10.1016/j.cageo.2004.03.012
» https://doi.org/10.1016/j.cageo.2004.03.012 - PEREIRA FILHO, A. J.; PINTO, M. A. R. R. C.; MANFREDINI, L.; LIMA, F. A.; PINTO, A. C. E C.; MORIBE, C. H. et al. CESP Integrated Precipitation Estimation and Forecasting System for its Watersheds. Revista Brasileira de Meteorologia, v. 35, n. 4, p. 529-552, 2020. https://doi.org/10.1590/0102-7786352023
» https://doi.org/10.1590/0102-7786352023 - PEREIRA, S. B.; PRUSKI, F. F.; SILVA, D. D. DA; RAMOS, M. M. Study of the hydrological behavior of São Francisco River and its main tributaries. Revista Brasileira de Engenharia Agrícola e Ambiental, v. 11, n. 6, p. 615-622, 2007. https://doi.org/10.1590/s1415-43662007000600010
- PETRUNGARO, A. C. N.; HORA, M. A. G. M. Avaliação das Secas Meteorológica e Hidrológica na Bacia Contribuinte à Barragem de Juturnaíba, Estado do Rio de Janeiro, Brasil. Anuário do Instituto de Geociências, v. 42, n. 4, p. 309-321, 2019. http://dx.doi.org/10.11137/2019_4_309_321
» http://dx.doi.org/10.11137/2019_4_309_321 - PIRANI, F. J.; MODARRES, R. Geostatistical and deterministic methods for rainfall interpolation in the Zayandeh Rud basin, Iran. Hydrological Sciences Journal, v. 65, n. 16, p. 2678-2692, 2020. https://doi.org/10.1080/02626667.2020.1833014
» https://doi.org/10.1080/02626667.2020.1833014 - R CORE TEAM. R: A language and environment for statistical computing. Vienna, 2018.
- SANTOS, W. M.; SOUZA, R. M. S.; SOUZA, E. S.; ALMEIDA, A. Q. DE; DANTAS ANTONINO, A. C. Spatial variability of rainfall seasonality in semi-arid region of Brazil. Journal of Environmental Analysis and Progress, v. 2, n. 4, p. 368-376, 2017a. https://doi.org/10.24221/jeap.2.4.2017.1466.368-376
» https://doi.org/10.24221/jeap.2.4.2017.1466.368-376 - SANTOS, C. A. G.; BRASIL NETO, R. M.; DE ARAÚJO PASSOS, J. S.; DA SILVA, R. M. Drought assessment using a TRMM-derived standardized precipitation index for the upper São Francisco River basin, Brazil. Environmental Monitoring and Assessment, v. 189, n. 6, p. 189-250, 2017b. https://doi.org/10.1007/s10661-017-5948-9
» https://doi.org/10.1007/s10661-017-5948-9 - SILVA, B. C. DA; CLARKE, R. T. Análise estatística de chuvas intensas na bacia do rio São Francisco. Revista Brasileira de Meteorologia, v. 19, n. 3, p. 265-272, 2004.
- SILVA NETO, V. L.; VIOLA, M. R.; MELLO, C. R.; ALVES, M. V. G.; SILVA, D. D.; PEREIRA, S. B. Heavy Rainfall Mapping for Tocantins State, Brazil. Revista Brasileira de Meteorologia, v. 35, n. 1, p. 1-11, 2020. https://doi.org/10.1590/0102-7786351017
» https://doi.org/10.1590/0102-7786351017 - SINGREH (Brasil). Plano Nacional de Recursos Hídricos. Diagnóstico das Regiões Hidrográficas - Versão 2: Bacia do Rio São Francisco. Brasília, 2002.
- WANDERLEY, H. S.; AMORIM, R. F. C. DE; CARVALHO, F. DE O. Spatial interpolation of precipitation in the State of Alagoas utilizing technical geostatistics. Campo Digital, v. 8, n. 1, p. 34-42, 2013.
- WEBSTER, R.; OLIVER, M. A. Geostatistics for environmental scientists. 2. ed. Chester: Wiley, 2007.
- WICKHAM, H. ggplot2: Elegant Graphics for Data Analysis. New York: Springer, 2009.
Publication Dates
-
Publication in this collection
17 June 2022 -
Date of issue
2022
History
-
Received
25 June 2021 -
Accepted
05 Jan 2022