 Non-destructive method for predicting the area and weight of red pitaya cladodes using linear dimensions
ABSTRACT.
The leaf area estimation of crops is a critical analysis because it indicates the photosynthetically active area of the plant. However, some methods are more expensive and difficult to apply to crops, such as pitaya. Thus, the objective of the present work was to determine a non-destructive method of estimating the area and weight of pitaya cladodes using linear dimensions. In an experimental orchard, 101 pitaya cladodes of the species Selenicereus undatus were collected, and the length (L), width (W), cladode area (CA), fresh mass (FM) and dry mass (DM) of the cladodes were measured. The product between the cladodes’ length and width (LW) was then calculated. Linear, non-intercept linear and power models were used to predict the area and weight of cladodes using allometric equations. The criteria for choosing the best equations were based on Pearson’s coefficients of determination and correlation, Willmott’s agreement index, Akaike’s information criterion, root mean squared error and mean absolute error. The equations constructed with the power and linear model were the most suitable for predicting cladode area (CA = 5.577 * LW0.541), cladode fresh mass (FM = 8.50 * W1.138) and cladode dry mass (MD = 3.03 + 1.74 * W). Thus, it was possible to construct a non-destructive and reliable method for predicting the area and weight of pitaya cladodes using the linear dimensions of the cladodes (length and width).
Keywords:
Selenicereus undatus; Cactaceae; allometric equations; biometrics; width of cladode
Introduction
The pitaya ENT#091;Selenicereus undatus (Haw.) D.R. HuntENT#093; is a plant belonging to the Cactaceae family, originating in the Americas, with approximately 1,500 species distributed in 100 genera and Mexico having a great genetic diversity of this crop (Patel et al., 2023). The production of this exotic fruit, known for its numerous nutritional properties that are beneficial to human health (Verona-Ruiz et al., 2020), has expanded considerably worldwide. Although Brazil is not yet among the largest global producers, production reached 2924 tonnes in 2022 (Cruz & Martins, 2022), with projections for growth until 2029 (Mitsui, 2024).
Similar to the forage palm (Opuntia ficus-indica), pitaya captures light through its cladodes (modified stems) with specialised structures to capture light energy to carry out photosynthesis, which even influences fruit production. In countries with a hot climate, high insolation represents one of the main challenges for dragon fruit production. It can cause irreversible cladode damage, affecting photosynthetic efficiency and fruit quality. Among the strategies studied to mitigate these effects, shading has shown promise (Oliveira et al., 2021). However, several gaps remain to be filled in the cultivation of this fruit. Increased research has focused on the absence of consensus on its taxonomy (Trindade et al., 2023) and postharvest conservation, considering that internal physiological metabolism and storage conditions are crucial for fruit spoilage (Huang & Zhao, 2024). Cladode morphology is also noteworthy since the shape and position of the cladodes are directly related to fruit productivity and quality (Brito et al., 2024). Thus, it is essential to understand the photosynthetic area of dragon fruit cladodes, which is not yet feasible by traditional measurement methods, such as the use of equipment.
Several methods can be used to determine the leaf area of crops, and they are classified as direct, indirect, destructive and non-destructive. The direct methods (destructive and non-destructive) are precise but require more time, labour and investments in high-cost equipment (Goergen et al., 2021; Ribeiro et al., 2023a). The non-destructive indirect method allows for the determination of leaf area from equations using the length and width of the leaves.
Several studies have determined the relationship between leaf area and leaf dimensions in various plant species, such as sweet potato (Ribeiro et al., 2024), Spondias tuberosa (Amorim et al., 2024a), Spondias sp. (Amorim et al., 2024b), Cassia fistula (Ribeiro et al., 2023a), basil (Ribeiro et al., 2022a), Erythrina velutina (Ribeiro et al., 2022b), and Lisianthus (Dias et al., 2022). These works have been of great relevance, providing precise equations for estimating the leaf area of these plants and presenting methodologies that can be used without requiring the destruction of plant material, thus making them less costly for the researcher. Estimating leaf area by regression models is an accurate and easy-to-use method, providing the execution of the method in all vegetative phases of the plant (Carvalho et al., 2017).
In the case of cacti, such as pitaya, this determination becomes more complicated by the morphology, as their leaves are modified into cladodes. Therefore, pitaya is not subject to traditional methods of determination. However, a method that helps estimate pitaya’s cladode area still needs to be developed. Therefore, this study aimed to determine a non-destructive method for predicting the area and weight of pitaya cladodes using the linear dimensions of the cladodes (length and width).
Material and methods
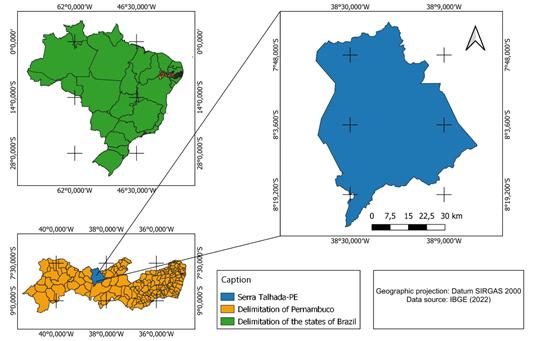
This study was conducted in the experimental orchard of the Serra Talhada Academic Unit, belonging to the Federal Rural University of Pernambuco, located in the municipality of Serra Talhada, state of Pernambuco, Brazil (Figure 1). The climate of the region is of the BSh type according to the Kӧppen classification (Alvares et al., 2013) and characterised as hot and dry semi-arid, with an altitude of 435 m, average annual temperature above 25°C, global average radiation of 17.74 MJ m-1, average relative humidity of 64.85% and average annual precipitation of 653 mm (Bezerra et al., 2020).
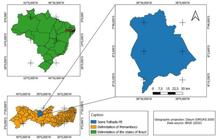
Location map of Serra Talhada, Pernambuco State, Brazil, where red pitaya cladodes were collected.
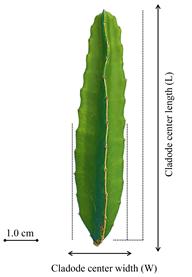
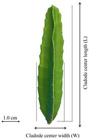
A total of 101 pitaya cladodes of Selenicereus undatus, characterised by a red peel and pulp fruit, were collected. Collection was carried out by selecting cladodes of various sizes and shapes that were free of pests, diseases, and other biotic and abiotic damage (Figure 2).
After collection, the cladodes were taken to the plant production laboratory, where fresh weight measurements were carried out by weighing each cladode individually on a semi-analytical scale and then scanned on a flatbed scanner (HP DeskJet Ink Advantage 2874, Barueri, São Paulo State, Brazil) with a resolution of 600 DPI. The cladodes were then taken to the greenhouse and dried at 60°C for 168 hours. The dry mass was determined by weighing the cladodes individually on a semi-analytical scale.
The digitised cladodes were processed using ImageJ software v. 1.53k with image contrast, as described by Amorim et al. (2024a). After processing, the following measurements were recorded: length (L), equivalent to the distance from the apex of the cladode to the insertion of the peduncle; the width (W), referring to the maximum measurement perpendicular to the central area; and the cladode area (CA). The product of the L and W data (LW) was calculated.
The linear (ŷ = β 0 + β 1 ⋅x + ε i ), linear without intercept (ŷ = β 1 ⋅x + ε i ) and power (ŷ = β 0 ⋅x β1 + ε i ) were used to predict the cladode area and weight, in which ŷ corresponds to the estimate of cladode area (CA), fresh mass (FM) and dry mass (DM) as a function of x (dimensions of cladodes L, W and LW).
To determine the best models and prediction equations, the following criteria were adopted: the highest coefficients of determination (R²) (Equation 1), Pearson’s correlation coefficient (r) (Equation 2), Willmott agreement index (d) (Equation 3), the lowest Akaike information criteria (AIC) (Equation 4), root mean squared error (RMSE) (Equation 5), and mean absolute error (MAE) (Equation 6).
R² = (1)
r = (2)
d =(3)
AIC = (4)
RMSE = (5)
MAE = (6)
where: ŷi: estimated cladode area; y’i: observed cladode area; yi: average of the observed values; y’I: ŷi - y; y’i: yi - y; L(x\θ): maximum likelihood function; p: number of model parameters; n: number of observations; xi and yi: observations of variables x and y; x and y: average of the variables x and y.
Descriptive analysis was performed to determine the maximum, minimum and mean values, total amplitude, standard deviation, and coefficient of variation. Student’s t-test for paired samples up to 5% probability was used to compare the observed cladode area and weight and those estimated by the proposed equation. Statistical analyses were conducted using R software (R Core Team, 2023).
Results
The collected cladodes had a L ranging from 4.34 to 108.94 cm, with a mean of 28.77 cm and an amplitude of 104.59 cm. The W ranged from 1.83 to 39.84 cm, with a mean of 9.85 cm and amplitude of 38.01 cm. The LW ranged from 9.95 to 4120.11 cm2, with a mean of 408.63 cm2 and an amplitude of 4110.16 cm2. The CA showed variation between 6.40 and 546.55 cm2, with a mean of 119.43 cm2 and an amplitude of 540.15 cm2. The FM varied from 3.44 to 588.09 g with a mean and amplitude of 119.70 and 584.65 g, respectively. The DM ranged from 0.300 to 79.94 g, with a mean of 20.24 g and an amplitude of 79.64 g. The highest coefficients of variation were recorded for LW (164.36%) and FM (90.19%) and the lowest for L (66.80%) and DM (68.48%) (Table 1).
Minimum, maximum, mean, total amplitude, standard deviation and coefficient of variation of length (L), width (W), product of length and width (LW), cladode area (CA), fresh mass (FM), and dry mass (DM) of red pitaya (Selenicereus undatus) cladodes.
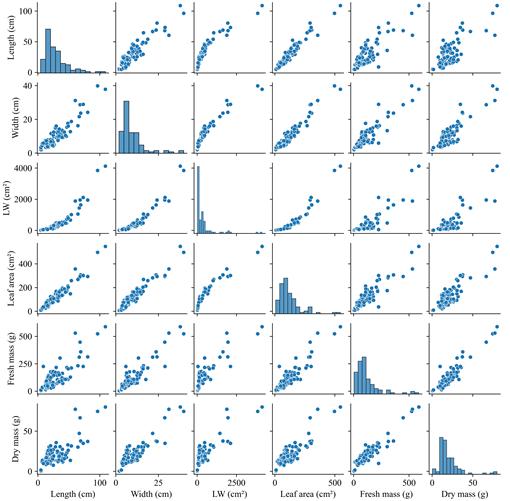
Figure 3 shows the dispersion between the variables L, W, LW, CA, FM, and DM, demonstrating different relationships between them, which indicates adjustments of linear and non-linear models for estimating the cladode area and weight. It is possible to observe linear patterns between L and CA, W and CA, FM and CA, and DM and CA, and non-linear patterns between LW and CA. Regarding FM, linear patterns were observed between W and FM and between CA and FM, and non-linear patterns were found between L and FM and between LW and FM. For DM, linear patterns were observed between W and DM and between CA and DM, and the non-linear patterns were found between L and DM and between LW and DM.
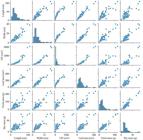
Histograms and scatter plots between length, width, length and width product, cladode area, fresh mass and dry mass of red pitaya (Selenicereus undatus) cladodes.
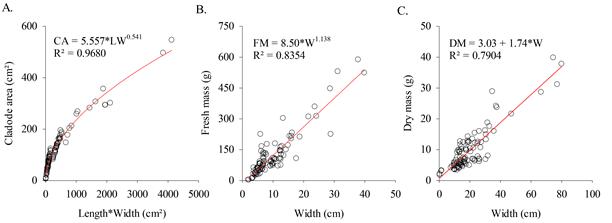
Thus, it was possible to use linear and non-linear models to predict CA, FM, and DM of pitaya cladodes. For CA, the best fitted model was the power model, using LW (CA = 5.577 * LW0.541 ) and with the best criteria observed for the coefficient of determination (R²: 0.9680), Pearson’s linear correlation coefficient (r: 0.9838) and Willmott’s agreement index (d: 0.9917) and lower values of the Akaike information criterion (AIC: 849.82), root of the mean squared error (RMSE: 16.44) and mean absolute error (MAE: 12.40) (Table 2).
Regression models, coefficient of determination (R²), Pearson's correlation (r), Willmott agreement index (d), Akaike's criterion (AIC), root mean squared error (RMSE) and mean absolute error (MAE), for linear dimensions (L, W and LW) of red pitaya (Selenicereus undatus) cladodes in the cladode area estimation.
To estimate FM, the power model was also best adjusted when W was used (FM = 8.50 * W1.138), registering the best coefficient of determination (R²: 0.8354) and Pearson’s linear correlation (r: 0.9140), the highest Willmott agreement index (d: 0.9543) and the lowest Akaike information criterion (AIC: 1045.85), root mean squared error (RMSE: 43.82) and mean absolute error (MAE: 30.05) (Table 3).
Regression models, coefficient of determination (R²), Pearson's correlation (r), Willmott's agreement index (d), Akaike's criterion (AIC), root mean squared error (RMSE) and mean absolute error (MAE), for linear dimensions (L, W and LW) of red pitaya (Selenicereus undatus) cladodes in the fresh mass estimate.
For the DM estimate, the best-adjusted model was the linear model using W (MD = 3.03 + 1.74*W), where the equation obtained presented the best coefficient of determination (R²: 0.7904), Pearson’s linear correlation coefficient (r: 0.8902) and Willmott’s agreement index (d: 0.9399) and the lowest Akaike’s information criterion (AIC: 658.44), root of the mean squared error (RMSE: 6.31) and mean absolute error (MAE: 4.86) (Table 4).
Regression models, coefficient of determination (R²), Pearson's correlation (r), Willmott agreement index (d), Akaike's criterion (AIC), root mean squared error (RMSE) and mean absolute error (MAE), for linear dimensions (L, W and LW) of red pitaya (Selenicereus undatus) cladodes in the dry mass estimate.
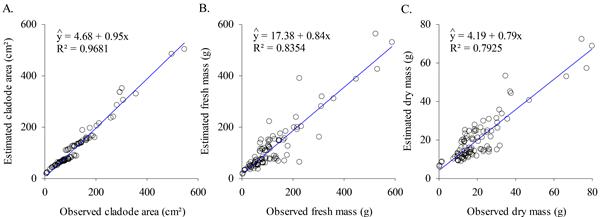
The equations fit the models, as there was little dispersion of the data (Figure 4), indicating that they satisfactorily estimated the cladode area and weight of pitaya. However, for the estimated and observed plant weight (Figure 5), the coefficients of determination (R²) indicated less precision than that observed for CA.
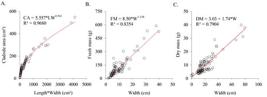
Relationship between the observed cladode area and the product of length and width (A), between fresh mass and width (B), and dry mass and width (C) of red pitaya (Selenicereus undatus) cladodes in the power and linear models.
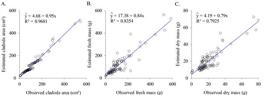
Relationship and comparison of the observed cladode area (A), fresh mass (B), and dry mass (C) with the estimated cladode area, fresh mass and dry mass, using the power and linear models from the length and width of red pitaya (Selenicereus undatus) cladodes.
Discussion
The significant variability found in the allometric measurements of pitaya (Table 1) is necessary to have greater sample representativeness. According to Ribeiro et al. (2023a), this variability allows for better construction of accurate allometric equations, which can be used to predict the CA and FM of cladodes in different phenological phases of the crop life cycle in a non-destructive way. Thus, it is possible to predict that the number of cladodes used in this study (101 cladodes) was adequate for constructing models to predict the area and leaf weight of dragon fruit (Ribeiro et al., 2023b).
The distribution of dispersion between the variables analysed, demonstrating linear and nonlinear relationships, has commonly been observed by other studies in the area, with fruit crops, such as umbu (Spondias tuberosa) (Amorim et al., 2024a) and sapotizeiro (Manilkara zapota L.) (Ribeiro et al., 2023c), and even ornamental species, such as Thunbergia grandiflora Roxb) (Mela et al., 2022). However, studies regarding cacti still need to be made available.
According to the coefficient of determination (R²) of the obtained equations, at least 79% of the variation observed in the leaf area and plant weight of the pitaya cladodes were explained by the models built from the linear dimensions of the cladodes (Ribeiro et al., 2023d). According to Sala et al. (2023), determining leaf area through non-destructive methods based on mathematical models requires high speed and precision derived from statistical parameters (R², RMSE, r). However, other studies have already shown lower R² values than those obtained for the prediction of leaf area, thus corroborating the present study (Huaccha-Castillo et al., 2023).
The prediction of cladode weight was also possible from linear and nonlinear regression models. It has been indicated as a simpler and more useful method for the study of the physiology and agronomic behaviour of the crop (Salazar et al., 2018). In a study with Nopaleae cochenillifera (forage palm), Leite et al. (2020) also determined the cladode weight from linear dimensions, such as L and W, through a power model. Lucena et al. (2021) found that the model that best represented the weight of the forage palm was gamma. According to Sabouri and Hassanpour (2015), linear dimensions, based on simple function models, can estimate the FM and DM of crops. Compared with traditional methods that require expensive and destructive equipment, these allometric models offer non-invasive and cost-effective alternatives. They provide sufficient accuracy while reducing the need for specialised resources, making them suitable for research and field applications.
Further studies should focus on comparing these allometric models across various environmental and agronomic conditions, which would provide valuable information about their broader applicability and refine their accuracy.
Conclusion
Leaf area and cladode weight can be accurately estimated through allometric equations using the linear dimensions of the cladodes. For the leaf area of the cladode, the equation that best fit was CA = 5.577 * LW0.541 from the L and W of the cladode. For vegetable weight, the best-adjusted equations were FM = 8.50 * W1.138 and MD = 3.03 + 1.74 * W for FM and DM, respectively, based on cladode W. Thus, these equations can be used as a non-destructive method for predicting the area, FM, and DM of dragon fruit cladodes, benefiting producers and researchers who do not have expensive equipment. However, future studies must validate and improve these models under different growing conditions.
Data availability
Not applicable.
References
-
Alvares, C. A., Stape, J. L., Sentelhas, P. C., Moraes Gonçalves, J. L. & Sparovek, G.. (2013). Köppen’s climate classification map for Brazil. Meteorologische Zeitschrift, 22(6), 711-728. https://doi.org/10.1127/0941-2948/2013/0507
» https://doi.org/https://doi.org/10.1127/0941-2948/2013/0507 -
Amorim, P. E. C., Pereira, D. F., Freire, R. I. S., Oliveira, A. M. F., Mendonça, V. & Ribeiro, J. E. S.. (2024a). A non-destructive method for leaflet area prediction of Spondias tuberosa Arruda: An approach to regression models. Bragantia, 83, 1-12. https://doi.org/10.1590/1678-4499.20230269
» https://doi.org/https://doi.org/10.1590/1678-4499.20230269 -
Amorim, P. E. C., Oliveira, A. M. F., Lima, J. L., Sá, F. V. S., Mendonça, V. & Ribeiro, J. E. S.. (2024b). Allometric models for non-destructive estimation of leaflet area of umbu-cajazeira (Spondias sp.). Ciência e Agrotecnologia, 48, 1-7. https://doi.org/10.1590/1413-7054202448009924
» https://doi.org/https://doi.org/10.1590/1413-7054202448009924 -
Bezerra, A. C., Silva, J. L. B., Silva, D. A. O., Batista, P. H. D., Pinheiro, L. C., Lopes, P. M. O. & Moura, G. B. A.. (2020). Monitoramento espaço-temporal da detecção de mudanças em vegetação de Caatinga por sensoriamento remoto no Semiárido brasileiro. Revista Brasileira de Geografia Física, 13(1), 286-301. https://doi.org/10.26848/rbgf.v13.1.p286-301
» https://doi.org/https://doi.org/10.26848/rbgf.v13.1.p286-301 -
Brito, L. P. S., Oliveira, E. R., Luis, P. H. D., Ramos, J. D., Almeida, L. G. F. & Santos, V. A.. (2024). Production performance of Hylocereus polyrhizus based on cladode size and position. Comunicata Scientiae, 15, 1-7. https://doi.org/10.14295/cs.v15.3547
» https://doi.org/https://doi.org/10.14295/cs.v15.3547 -
Carvalho, J. O., Toebe, M., Tartaglia, F. L., Bandeira, C. T. & Tambara, A. L.. (2017). Leaf area estimation from linear measurements in different ages of Crotalaria juncea plants. Anais da Academia Brasileira de Ciências, 89(3), 1851-1868. https://doi.org/10.1590/0001-3765201720170077
» https://doi.org/https://doi.org/10.1590/0001-3765201720170077 - Cruz, M. C. M. & Martins, R. S. (2022). Pitaia no Brasil: nova opção de cultivo. Epagri.
-
Dias, M. G., Silva, T. I., Ribeiro, J. E. S., Grossi, J. A. S. & Barbosa, J. G.. (2022). Allometric models for estimating the leaf area of lisianthus (Eustoma grandiflorum) using a non-destructive method. Revista Ceres, 69(1), 7-12. https://doi.org/10.1590/0034-737X202269010002
» https://doi.org/https://doi.org/10.1590/0034-737X202269010002 -
Goergen, P. C. H., Lago, I., Schwab, N. T., Alves, A. F., Freitas, C. P. O. & Selli, V. S.. (2021). Allometric relationship and leaf area modeling estimation on chia by non-destructive method. Revista Brasileira de Engenharia Agrícola e Ambiental, 25(5), 305-311. https://doi.org/10.1590/1807-1929/agriambi.v25n5p305-311
» https://doi.org/https://doi.org/10.1590/1807-1929/agriambi.v25n5p305-311 -
Huaccha-Castillo, A. E., Fernandez-Zarate, F. H., Pérez-Delgado, L. J., Tantalean-Osores, K. S., Vaca-Marquina, S. P., Sanchez-Santillan, T., Morales-Rojas, E., Seminario-Cunya, A. & Quiñones-Huatangari, L.. (2023). Non-destructive estimation of leaf area and leaf weight of Cinchona officinalis L. (Rubiaceae) based on linear models. Forest Science and Technology, 19(1), 59-67. https://doi.org/10.1080/21580103.2023.2170473
» https://doi.org/https://doi.org/10.1080/21580103.2023.2170473 -
Huang, M. & Zhao, J.. (2024). Recent advances in postharvest storage and preservation technology of pitaya (dragon fruit). The Journal of Horticultural Science and Biotechnology, 99(2), 115-129. https://doi.org/10.1080/14620316.2023.2263757
» https://doi.org/https://doi.org/10.1080/14620316.2023.2263757 -
Leite, M. L. M. V., Lucena, L. R. R., Oliveira, A. D. M., Costa, A. C. L., Anjos, F. L. Q., Farias, I. M., Simões, V. J. L. P. & Almeida, M. C. R.. (2020). Cladode area and weight of Napolea cochenillifera clone A as function of morphometric characteristics. Journal of the Professional Association for Cactus Development, 22, 18-28. https://doi.org/10.56890/jpacd.v22i.15
» https://doi.org/https://doi.org/10.56890/jpacd.v22i.15 -
Lucena, L. R. R., Leite, M. L. M. V., Simões, V. J. L. P., Nóbrega, C., Almeida, M. C. R. & Simplicio, A. J. B.. (2021). Estimating the area and weight of cactus forage cladode using linear dimensions. Acta Scientiarum. Agronomy, 43, 1-10. https://doi.org/10.4025/actasciagron.v43i1.45460
» https://doi.org/https://doi.org/10.4025/actasciagron.v43i1.45460 -
Mela, D., Dias, M. G., Silva, T. I., Ribeiro, J. E. S., Martinez, A. C. P. & Zuín, A. H. L.. (2022). Estimation of Thunbergia grandiflora leaf area from allometric models. Comunicata Scientiae, 13, 1-6. https://doi.org/10.14295/cs.v13.3722
» https://doi.org/https://doi.org/10.14295/cs.v13.3722 -
Mitsui, Y. (2024). Tamanho do mercado de fruta do dragão e análises de ações - tendências e previsões de crescimento (2024-2029). Epagri. https://www.mordorintelligence.com/pt/industry-reports/dragon-fruit-market
» https://www.mordorintelligence.com/pt/industry-reports/dragon-fruit-market -
Oliveira, M. M. T., Albano-Machado, F. G., Penha, D. M., Pinho, M. M., Natale, W., Miranda, M. R. A., Moura, C. F. H., Alves, R. E. & Corrêa, M. C. M.. (2021). Shade improves growth, photosynthetic performance, production and postharvest quality in red pitahaya (Hylocereus costaricensis). Scientia Horticulturae, 286, 110217. https://doi.org/10.1016/j.scienta.2021.110217
» https://doi.org/https://doi.org/10.1016/j.scienta.2021.110217 - Patel, D. P., Bisen, A., Porte, S. S. & Tirkey, P. L.. (2023). Dragon fruit: A health potential and remunerative fruit crop for Chhattisgarh. The Pharma Innovation Journal, 12(11), 1513-1520.
- R Core Team (2023). R: A language and environment for statistical computing. R Foundation for Statistical Computing.
-
Ribeiro, J. E. S., Nobrega, J. S., Coêlho, E. S., Dias, T. J. & Melo, M. F.. (2022a). Estimation leaf area of basil cultivars through linear dimensions of leaves. Ceres, 69(2), 139-147. https://doi.org/10.1590/0034-737X202269020003
» https://doi.org/https://doi.org/10.1590/0034-737X202269020003 -
Ribeiro, J. E. S., Figueiredo, F. R. A., Nobrega, J. S., Coêlho, E. S. & Melo, M. F.. (2022b). Leaf area of Erythrina velutina Willd. (Fabaceae) by using allometric equations. Floresta, 52(1), 93-102. https://doi.org/10.5380/rf.v52i1.78059
» https://doi.org/https://doi.org/10.5380/rf.v52i1.78059 -
Ribeiro, J. E. S., Silva, A. G. C., Coêlho, E. S., Lima, J. V. L., Barros Júnior, A. P. & Silveira, L. M.. (2023a). A non-destructive method for predicting the leaflet area of Cassia fistula L: An approach to regression models. South African Journal of Botany, 163, 30-36. https://doi.org/10.1016/j.sajb.2023.10.016
» https://doi.org/https://doi.org/10.1016/j.sajb.2023.10.016 -
Ribeiro, J. E. S., Coêlho, E. S., Oliveira, A. K. S., Silva, A. G. C., Lopes, W. A. R., Oliveira, P. H. A., Silva, E. F., Barros Júnior, A. P. & Silveira, L. M.. (2023b). Artificial neural network approach for predicting the sesame (Sesamum indicum L.) leaf area: A non-destructive and accurate method. Heliyon, 9(7), 1-12. https://doi.org/10.1016/j.heliyon.2023.e17834
» https://doi.org/https://doi.org/10.1016/j.heliyon.2023.e17834 -
Ribeiro, J. E. S., Coêlho, E. S., Pessoa, A. M. S., Oliveira, A. K. S., Oliveira, A. M. F., Barros Júnior, A. P., Mendonça, V. & Nunes, G. H. S.. (2023c). Nondestructive method for estimating the leaf area of sapodilla from linear leaf dimensions. Revista Brasileira de Engenharia Agrícola e Ambiental, 27(3), 209-215. https://doi.org/10.1590/1807-1929/agriambi.v27n3p209-215
» https://doi.org/https://doi.org/10.1590/1807-1929/agriambi.v27n3p209-215 -
Ribeiro, J. E. S., Coêlho, E. S., Dias, T. J. & Albuquerque, M. B.. (2023d). Allometric equations for estimating the leaf area of Thespesia populnea by linear dimensions of leaf blades. Iheringia. Série Botânica, 78, 1-8. https://doi.org/10.21826/2446-82312023v78e2023012
» https://doi.org/https://doi.org/10.21826/2446-82312023v78e2023012 -
Ribeiro, J. E. S., Silva, A. G. C., Lima, J. V. L., Oliveira, P. H. A., Coêlho, E. S., Silveira, L. M. & Barros Júnior, A. P.. (2024). Leaf area prediction of sweet potato cultivars: An approach to a non-destructive and accurate method. South African Journal of Botany, 172, 42-51. https://doi.org/10.1016/j.sajb.2024.07.006
» https://doi.org/https://doi.org/10.1016/j.sajb.2024.07.006 -
Sabouri, A. & Hassanpour, Y.. (2015). Prediction of leaf area, fresh and dry weight in stinging nettle (Urtica dioica) by linear regression models. Medicinal & Aromatic Plants, 4(2), 1-6. https://doi.org/10.4172/2167-0412.1000188
» https://doi.org/https://doi.org/10.4172/2167-0412.1000188 -
Sala, F., Dobrei, A. & Herbei, M. V.. (2023). Leaf area calculation models for vines based on foliar descriptors. Plants, 10(11), 1-15. https://doi.org/10.3390/plants10112453
» https://doi.org/https://doi.org/10.3390/plants10112453 -
Salazar, J. C. S., Melgarejo, L. M., Bautista, L. H. D., Rienzo, J. A. D. & Casanoves, F.. (2018). Non-destructive estimation of the leaf weight and leaf area in cacao (Theobroma cacao L.). Scientia Horticulturae, 229, 19-24. https://doi.org/10.1016/j.scienta.2017.10.034
» https://doi.org/https://doi.org/10.1016/j.scienta.2017.10.034 -
Trindade, A. R., Paiva, P., Lacerda, V., Marques, N., Neto, L. & Duarte, A.. (2023). Pitaya is a new alternative crop for Iberian Peninsula: Biology and edaphoclimatic requirements. Plants, 12(18), 1-17. https://doi.org/10.3390/plants12183212
» https://doi.org/https://doi.org/10.3390/plants12183212 -
Verona-Ruiz, A., Urcia-Cena, J. & Paucar-Menacho, L. M.. (2020). Pitahaya (Hylocereus spp) culture, physicochemical characteristics, nutritional composition, and bioactive compounds. Scientia Agropecuaria, 11(3), 439-453. https://doi.org/10.17268/sci.agropecu.2020.03.16
» https://doi.org/https://doi.org/10.17268/sci.agropecu.2020.03.16
Edited by
-
Associate Editor in charge:
Alessandro Lucca BracciniCarlos Alberto Scapim