 Assessing the physical quality of subsoiled cohesive horizons for Eucalyptus plantation
ABSTRACT.
In Brazil, Eucalyptus plantations occupy approximately 7.6 million hectares, of which 8% are located in the state of Bahia. In southern Bahia, these plantations are predominantly established on soils with cohesive horizons, characterized by high soil strength when dry and restricted pore connectivity when wet. These conditions reduce water, air, and nutrient fluxes, adversely affecting root development and plant growth. Subsoiling is a management practice commonly employed to mitigate these limitations; however, its effectiveness and persistence in modifying the physical attributes of naturally dense soils remain under debate. This study aimed to assess the effects of subsoiling on the physical quality of cohesive Argissolo Amarelo under Eucalyptus cultivation. Two sites were evaluated: one with Argissolo Amarelo distrófico típico (PA1) and another with Argissolo Amarelo distrocoeso fragipânico (PA2), both subsoiled to 0.60 m prior to planting. Soil samples were collected 6.5 years after planting in PA1 and 1 year after planting in PA2. Sampling was performed in the planting rows (0.20-0.25, 0.35-0.40, and 0.60-0.65 m) and the inter-rows (0.20-0.25 m). The following physical attributes were determined: bulk density, total porosity, the least limiting water range (LLWR), the water retention curve and the pore size distribution. According to the results, subsoiling led to sustained improvements in soil physical quality. The subsoiled layers exhibited lower bulk density, increased macroporosity, and a higher LLWR. Additionally, pore distribution was altered, with a higher proportion of cryptopores in non-subsoiled layers. The surface layers showed greater water retention at high matric potentials in the planting rows and low potentials in the inter-rows. These findings underscore the potential of subsoiling to enhance the physical functionality of cohesive soils under Eucalyptus, with effects that persist for multiple years post-subsoiling.
Keywords:
Soil bulk density; least limiting water range; soil structure; water retention curve
Introduction
In Brazil, around 7.6 million hectares are covered by Eucalyptus stands, and nearly 8% of this total lies in the state of Bahia (Instituto Brasileiro de Geografia e Estatística, 2019), northeastern Brazil. Most Eucalyptus stands in southern Bahia are planted on Argissolos and Latossolos (Ultisols and Oxisols), generically termed cohesive soils of the Coastal Tablelands. These soils are deep and acidic, and have a low cation exchange capacity. In addition, physical limitations, caused by cohesive horizons, may occur in the subsurface (Rezende, 2000). Cohesive is the term used to designate the hard to extremely hard consistency of the soil when dry, and friable or firm consistency when wet. In response to compression under humid conditions, such dense horizons are slowly deformed, unlike fragipan horizons, which break up suddenly (Santos et al., 2018).
The formation of these horizons is not yet fully understood, but their pedogenetic origin is known and associated with several processes, including pore clogging with illuvial clay; the presence of poorly polymerized organic compounds; the presence and accumulation of secondary silica, iron oxides, and clay dispersed in the micropores; and densification resulting from soil structure alteration owing to alternating wetting and drying cycles (Corrêa et al., 2008; Lima Neto et al., 2009). Researchers have suggested that the variation in particle size distribution, especially in the sand fraction, favors the formation of cohesive horizons due to denser particle packing (Bezerra et al., 2015; Araújo et al., 2018; Menezes et al., 2018). Cohesion reduces the pore space in the soil and, consequently, increases penetration resistance (PR). There are also alterations in the water, air, and nutrient dynamics as well as plant growth and root development, all of which can affect agricultural and forestry production (Portela et al., 2001; Souza et al., 2008; Vieira et al., 2012; Mota et al., 2018; Cavalcanti et al., 2019).
On Coastal Tableland soils, under the above conditions, subsoiling is the main and most commonly used agricultural practice for various crops, with a view to mitigate the negative effects of cohesion on crop growth and development (Silva et al., 2015; Souza et al., 2015; Dias et al., 2016; Meneses et al., 2019). In the forestry sector, subsoiling is a frequently used tillage practice due to its beneficial effects on plants and its operational and economic advantages (Sasaki et al., 2002). Subsoiling is a means to improve soil physical conditions (Barrios et al., 2015; Nunes et al., 2023) by breaking up the hardened layers, reducing density, and increasing porosity, thus reducing resistance to root development (Barrios et al., 2015; Silva et al., 2015; Nunes et al., 2023) and improving soil water conditions (Dias et al., 2016). Subsoiling enhances wood yield in Eucalyptus plantations with physical restrictions to growth (Barrios et al., 2015). However, the extent and duration of the effects of subsoiling on the soil’s physical properties are still debated (Sasaki, 2002), particularly with regard to naturally dense soils, such as those of the Coastal Tablelands. In this context, the present study evaluated the effects of subsoiling on the physical properties and quality of Argissolos Amarelos of the Coastal Tablelands under Eucalyptus in the southern region of Bahia.
Material and methods
Location and description of the study areas
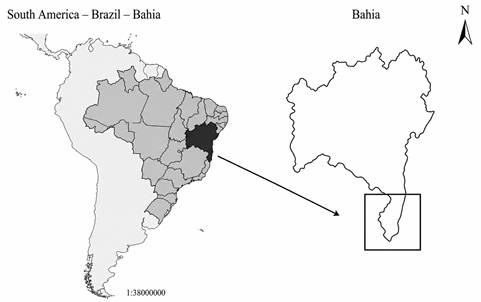
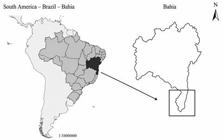
The study was carried out in the far south of the state of Bahia, in the districts of Porto Seguro and Santa Cruz Cabrália (Figure 1). The climate is tropical equatorial (Af, according to the Köppen classification), with a mean temperature of >18°C in the coldest month (annual mean 24°C). There is rainfall in all months of the year and no defined dry season. The average annual precipitation ranges from 1,400 to 1,760 mm. Two Eucalyptus stands were selected, one with Argissolo Amarelo distrófico típico (PA1) and the other with Argissolo Amarelo distrocoeso fragipânico (PA2). According to Soil Taxonomy, both soils are classified as Ultisols. Before planting Eucalyptus, both areas had been used as natural pasture under an extensive grazing system (Table 1). In both areas, soil tillage consisted of subsoiling to a depth of 0.60 m. The operation was carried out in the planting row with a single-shank subsoiler. Thereafter, the Eucalyptus seedlings were planted by hand.
Sampling
The soil was sampled when the Eucalyptus stand in PA1 (Argissolo Amarelo distrófico típico) was 6.5 years old and that in PA2 (Argissolo Amarelo distrocoeso fragipânico) was 1 year old (Table 1). In each area, three soil layers were sampled in the planting rows (subsoiling) (0.20-0.25, 0.35-0.40, and 0.60-0.65 m deep) and one in-between the planting rows, that is, the inter-rows (non-subsoiling; 0.20-0.25 m deep). From each layer, four individual disturbed samples were mixed and ground to form a composite sample, which was used to determine the particle size distribution, water-dispersible clay (WDC), the flocculation degree (FD), and particle density (PD) of the studied soils. Additionally, 30 undisturbed samples were collected to preserve the soil structure.
The undisturbed samples were collected at 30 different points to ensure variability in soil bulk density (SD) to calculate the least limiting water range (LLWR) of the soils under study. An Uhland sampler was used to collect the undisturbed samples in cylinders with an approximate height and diameter of 0.05 m. After collection, the samples were wrapped in polyvinyl chloride (PVC) film and placed in foam-lined plastic boxes for transport. In the laboratory, any excess soil on the outer surface was carefully removed to ensure that the remaining soil completely filled the internal volume of the cylinder.
Laboratory analyses
For each sampled soil layer, the particle size distribution, PD, WDC, and FD were determined based on the disturbed samples. In contrast, SD, total porosity (TP), the LLWR, the soil water retention curve (SWRC) and the soil pore diameter distribution were determined using undisturbed samples.
Particle size was analyzed by sieving and the pipette method, based on the principle of particle settling velocity, according to Stokes’ law, using 0.1 mol L-1 sodium hydroxide (NaOH) as a chemical dispersant (Ruiz, 2005). To quantify the particle size fractions by physical dispersion, the samples were incubated on a horizontal rotatory shaker (Wagner) at 50 rpm for 16h. The silt was determined by pipetting (Ruiz, 2005) and WDC by the method described for particle size analysis, but without any chemical dispersant. PD was measured based on the volumetric flask method, using alcohol as penetrating liquid, and FD was calculated as proposed by Teixeira et al. (2017). Table 2 presents the results.
TP was determined based the relationship between SD and PD, as suggested by Teixeira et al. (2017).
To determine the LLWR of the 30 undisturbed samples of each soil layer, the samples were separated into 10 groups, each of which contained three samples. The samples were saturated and then each sample group was exposed to the following soil water potentials: -4, -6, and -8 kPa on a tension table (Topp & Zebchuk, 1979), and to -10, -30, -50, -70, -100, -500, and -1500 kPa in a pressure plate apparatus (Klute, 1986). The samples were maintained on the tension table or porous plate until they reached the equilibrium point, when they were removed to measure PR.
PR was determined with a benchtop electronic penetrometer. The readings of the highest (0-0.01 m) and deepest (0.04-0.05 m) sampled layers were discarded. Thus, 1,500 measurements were obtained in the 0.01-0.04 m layer for each sample, and their average was calculated.
After determining PR, the samples were weighed and oven-dried at 105°C for 24h to determine the water content expressed on a mass basis, followed by determination of SD and the volumetric soil-water content (θ). PR was adjusted relative to SD and θ by using the nonlinear regression model proposed by Busscher (1990), shown in Equation 1. The nonlinear regression model proposed by Tormena et al. (1998), shown in Equation 2, was fit to the θ data relative to SD and the soil water potential (Ψ):
PR = a × θb × SDc (1)
θ = e(d + e × SD) × Ψf (2)
where PR is penetration resistance (MPa); θ is the volumetric soil-water content (m3 m-3); SD is the soil bulk density (kg dm-3); Ψ is the soil water potential (MPa); and a, b, c, d, e, and f are fitting parameters.
An algorithm developed in Excel® (Leão & Silva, 2004) was used to determine the LLWR. It generated a graph for Equations 3, 4, 5, and 6, derived from Equations 1 and 2. These equations present SD relative to: θ in equilibrium at a matric potential of -10 kPa (θ10); θ in equilibrium at a matric potential of -1500 kPa (θ1500); θ where PR (θPR) reaches 3.0 MPa; and θ where air-filled porosity is 0.1 m3 m-3 (θPA). The indicated limits were defined based on data from the literature, and for θ10, θ1500, θPR, and θPA, the values proposed by, respectively, Haise et al. (1955), Richards and Weaver (1944), Zou et al. (2000), and Grable and Siemer (1968) were considered.
θ10 = e(d + e.SD) × 0.01f (3)
θ1500 = e(d + e × SD) × 1.5f(4)
(5)
(6)
The LLWR is defined as the area between the upper and lower limits of the water contents corresponding to θ10, θ1500, θPA, and θPR. The upper limit is given by the lowest water content determined at a matric potential of -10 kPa or air-filled porosity. The lower limit is the highest water content, that is, the water content when PR reaches 3.0 MPa or at a matric potential of -1500 kPa.
The SWRC was estimated by employing the same undisturbed samples used previously to determine LLWR. Equilibrium moisture contents (θ) were measured at a matric potential of -4, -6, -8, -10, -30, -50, -70, -100, -500, and -1500 kPa. Once equilibrium was reached at each potential, the samples were immediately weighed after removal from the pressure plate apparatus. Then, they were transferred to a benchtop penetrometer to measure PR. Afterward, the samples were oven-dried and weighed again to determine the dry mass. The SWRC was adjusted for each layer by using the van Genuchten (1980) model. Saturation moisture (θs) and residual moisture (θr) were constant in the model and were treated as independent variables; they were assumed to be equivalent to TP and the equilibrium moisture content at a potential of -1500 kPa, respectively. The SWRC software (Dourado Neto et al., 2001) was used for this fitting.
Based on the SWRC, the macropore, micropore, and cryptopore volumes of each soil layer were determined (Klein & Libardi, 2002). Macropores had a diameter of > 50 µm (they lose water when tension is > -6 kPa). Micropores had a diameter of 50-0.2 µm (they lose water at a tension ranging from -6 to -1500 kPa). Finally, cryptopores had a diameter of < 0.2 µm (they lose water at a tension < -1500 kPa).
The soil pore distribution was determined in each layer at the same tensions applied to determine the LLWR and the SWRC. The equivalent pore diameter was calculated based on the capillary rise equation (Equation 7), where d is the equivalent pore diameter (cm); σ is the surface tension of water at 20°C (72.75 × 10⁻³ N m-1); α is the contact angle between the liquid meniscus and the tube wall, assumed to be zero; ρ is the specific weight of water (1000 kg dm-3); g is acceleration due to gravity (9.81 m s-2); and h is the soil water matric potential (|m|).
(7)
The proportion of pores with a smaller diameter than that calculated for each tension was calculated with Equation 8.
%V = 100 × [1 - (TP - θ')/TP] (8)
where %V is the proportion of soil pores with a diameter smaller than that calculated for each tension (%), TP is the total soil porosity (m3 m-3), and θ' is the volumetric soil water content at the tension used to calculate the pore diameter (m3 m-3).
Pore distribution curves for the evaluated soils were constructed from the data, based on the proportion of soil pores with a diameter smaller than that calculated for each tension versus the pore diameter.
Data analysis
The SD and PD data were compared by using the confidence interval for the mean at a significance level of 5% according to Ribeiro Júnior (2004), as shown in Equation 9:
(9)
where µ is the real mean, ( is the sample mean, S x is the sample standard deviation, α is the significance level, tα/2 is the tabulated “t” value at level α with n-1 degrees of freedom, and n is the number of samples.
The water retention curves, LLWR, and pore diameter distribution were compared based on the model fit statistics and the resulting graphs.
Results and discussion
Soil bulk density
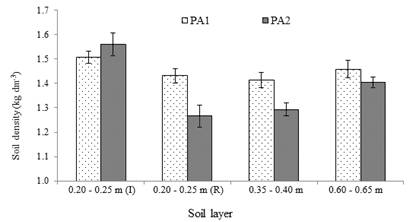
In both soils, SD in the planting rows was lower than in the inter-rows (Figure 2), which indicates that subsoiling can improve the soil physical conditions. In the 0.20-0.25 m layer of PA1, SD was 5.1% lower in the planting rows than in the inter-rows, with little variation compared with the deeper layers. In the 0.20-0.25 m layer of PA2, SD in the planting rows was 18.8% lower than in the inter-rows. Of note, SD of the 0.60-0.65 m layer was higher than in the upper layers (Figure 2).
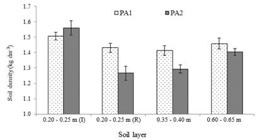
Mean soil bulk density of PA1 (Argissolo Amarelo distrófico típico), subsoiled 6.5 years before sampling, and PA2 (Argissolo Amarelo distrocoeso fragipânico), subsoiled 1 year before sampling. Vertical bars represent the confidence interval for the mean at a significance level of 5%. I: inter-rows; R: planting rows.
The less pronounced variation in SD for the planting rows compared with the inter-rows in PA1 was likely due to the fact that the samples were collected 6.5 years after subsoiling. On the other hand, PA2 showed greater variation in SD between the planting rows and inter-rows because the samples were collected just 1 year after subsoiling (Table 1). Specifically, soil tends to become denser over time-that is, the soil particles and/or aggregates are partially or totally rearranged (Horn & Dexter, 1989).
Based on the data, subsoiling tended to reduce variations in SD from the surface down to the depth reached by the subsoiler (0.60 m). This was more evident for PA1, where the variation in density was lower in the three studied layers (Figure 2). In PA2, SD was highest in the deepest layer (0.60-0.65 m), possibly due to the higher clay content in the deeper soil layer (Table 2). Clay may have been deposited in the spaces between the larger particles, leading to a reduction in macroporosity and an increase in SD. According to Corrêa et al. (2008), the genesis of cohesive horizons can be associated with intensified translocation of very fine clays between horizons or within the same horizon in the form of dispersed clay.
Porosity
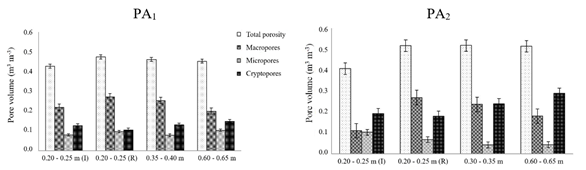
In both soils, for the 0.20-0.25 m layer, TP was higher in the planting rows than in the inter-rows. There was little variation in TP in the deeper layers of the plantings rows (Figure 3) due to the lower SD (Figure 2).
Based on the analysis of the distribution of TP in the macropores, micropores, and cryptopores in the 0.20-0.25 m layer, subsoiling increased mainly the volume of macropores in both soils (Figure 3). Subsoiling involves breaking up aggregates and compacted soil layers. Consistently, Nacif et al. (2008) and Dias et al. (2016) reported an increase in macroporosity in subsoiled layers of Latossolos Amarelos coesos. In the 0.35-0.40 and 0.60-0.65 m layers of both PA1 and PA2, the macropore volume decreased and the cryptopore volume increased as the depth increased (Figure 3). It is possible that an increase in the clay content as the depth increased (Table 2) allowed the formation of cryptopores because the macropores were filled with illuvial clay, especially in the subsurface layers (Startsev & McNabb, 2001).
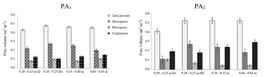
Total porosity and the macropore, micropore, and cryptopore volumes of PA1 (Argissolo Amarelo distrófico típico), subsoiled 6.5 years before sampling, and PA2 (Argissolo Amarelo distrocoeso fragipânico), subsoiled 1 year before sampling. I: inter-rows; R: planting rows.
Least limiting water range
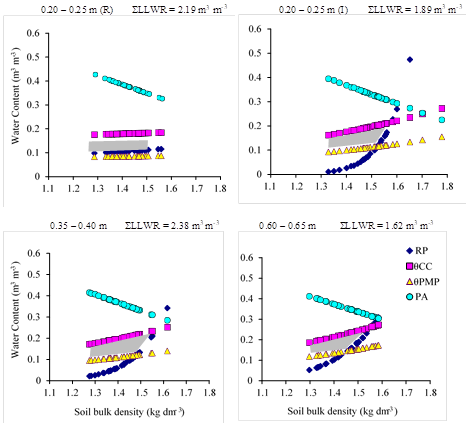
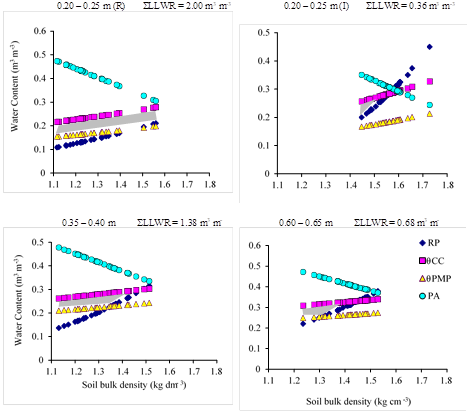
The shaded areas in Figures 4 and 5 represent the LLWR of PA1 and PA2, respectively.
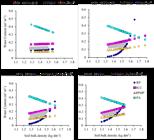
The least limiting water range (LLWR) of PA1 (Argissolo Amarelo distrófico típico), subsoiled 6.5 years before sampling. The graphs show the volumetric soil water content (θ) in equilibrium at a matric potential of -10 kPa (θ10), in equilibrium at a matric potential of -1500 kPa (θ1500), when penetration resistance reaches 3.0 MPa (θPR), and when air-filled porosity is 0.1 m3 m-3 (θPA) at different soil depths. The shaded areas represent the LLWR. I: inter-rows; R: planting rows; ΣLLWR: sum of the LLWR of the 30 samples.
In the 0.20-0.25 m layer of PA1, the LLWR of the planting rows was 15.8% higher than the LLWR of the inter-rows (Figure 4). This difference was even greater for PA2, where the LLWR of the planting rows was 5.6 times greater than that of the inter-rows (Figure 5). These differences can be explained by the higher SD of the inter-rows. An increase in SD implies an increase in soil PR (Lebert & Horn, 1991), which represents a limiting factor for plant development at lower soil water contents. Furthermore, the θPR curve showed a different shape for the planting rows and the inter-rows independently of the evaluated soil: A linear function defined the former, while an exponential function defined the latter.
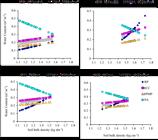
The least limiting water range (LLWR) of PA2 (Argissolo Amarelo distrocoeso fragipânico), subsoiled 1 year before sampling. The graphs show the volumetric soil water content (θ) in equilibrium at a matric potential of -10 kPa (θ10), in equilibrium at a matric potential of -1500 kPa (θ1500), when penetration resistance reaches 3.0 MPa (θPR), and when air-filled porosity is 0.1 m3 m-3 (θPA) at different soil depths. The shaded areas represent the LLWR. I: inter-rows; R: planting rows; ΣLLWR: sum of the LLWR of the 30 samples.
For the 0.20-0.25 m layer in PA1, θPR corresponded to the lower limit of the LLWR for the entire SD range recorded in the planting rows. Nevertheless, the LLWR approached the available water capacity (AWC = θ10 - θ1500). In PA2, θPR was only limiting when SD reached 1.50 kg dm-3. Thus, for 86% of the SD range recorded for PA2, the LLWR was equal to the AWC. Pacheco and Cantalice (2011) reported similar results: They found that the LLWR equaled the AWC in the 0.20-0.40 m layer of Argissolo Amarelo distrocoeso under sugarcane. The authors described that layer as sandy, so water availability rather than soil PR was the limiting factor for root development.
In PA1, the LLWR of the planting rows was higher for the 0.35-0.40 m layer than for the 0.20-0.25 m layer. However, when SD was >1.48 kg dm-3, the LLWR of the 0.35-0.40 m layer was significantly lower, due to the replacement of θ1500 by θPR. In the 0.20-0.25 m layer, θPR was the lower limit for the entire SD range, but because θPR is represented by a line approximately parallel to θ1500, an increase in SD in this layer did not significantly increase in θPR and, consequently, the LLWR was not significantly reduced at a higher SD.
For PA2, the LLWR of the planting rows was lower in the 0.35-0.40 m layer than in the 0.20-0.25 m layer. In the deeper layer, θ1500 was replaced by θPR when SD reached 1.35 kg dm-3, while in the 0.20-0.25 m layer the replacement occurred at and SD of 1.50 kg dm-3. Therefore, soil PR was more limiting in the 0.35-0.40 m layer than the 0.20-0.25 m layer.
The curves that represent the LLWR of the 0.35-0.40 and 0.60-0.65 m layers of PA1 have a similar shape. However, the LLWR of the 0.60-0.65 layer was lower than the LLWR of the 0.35-0.40 m layer, due to a narrowing between the θ10 and θ1500 curves and an increase in θPR in the 0.60-0.65 m layer relative to the 0.35-0.40 m layer. The LLWR of the 0.60-0.65 m layer of PA2 was lower than the LLWR of the 0.35-0.40 m layer. In that layer, θPR replaced θ1500 when SD reached 1.3 kg dm-3. Thus, in 93% of the recorded SD range, the LLWR was lower than the AWC.
In both soils, the upper limit of the LLWR was represented by θ10, indicating that the plants were not affected by limited oxygen availability to the roots. However, it should be remembered that hypoxia conditions may occur if leaching to deeper layers or lateral drainage are not effective, especially during periods of high rainfall.
Finally, the physical conditions in the subsoiled layers (0.20-0.25 and 0.35-0.40 m for the planting rows) were less restrictive to plant development than in the non-subsoiled layers (0.20-0.25 m for the inter-rows and 0.60-0.65 m), because the LLWR was closer to the AWC in the subsoiled layers compared with the non-subsoiled layers. This finding again reinforces the importance of subsoiling the soils under Eucalyptus, given that water stress is one of the main limiting factors for the growth and development of this crop in Brazil (Elli et al., 2019). Moreover, according to Dias et al. (2016), even 3 years after subsoiling, the physical quality of a Latossolo Amarelo coeso still presented benefits from that process.
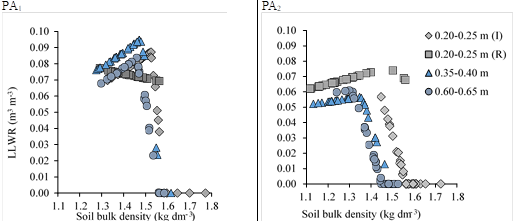
The relationship between the LLWR and SD of the evaluated soils was evaluated, revealing two patterns of the LLWR relative to SD (Figure 6). First, the LLWR increased as SD increased, that is, these variables have a direct relationship up to the SD at which θPR replaces θ1500 as the lower limit of the LLWR. Once this SD is reached, the LLWR begins to decline as SD increases; it eventually goes down to zero.
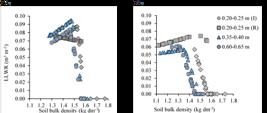
Variation in the least limiting water range (LLWR) according to the density of the PA1 (Argissolo Amarelo distrófico típico), subsoiled 6.5 years before sampling, and PA2 (Argissolo Amarelo distrocoeso fragipânico), subsoiled 1 year before sampling. I: inter-rows; R: planting rows.
SD at which plant growth is severely restricted can be determined based on the LLWR, regardless of soil moisture. This occurs when the LLWR is 0, known as critical soil bulk density (SDc). For PA1, in the 0.20-0.25 m layer, SDc was 30.4% higher in the planting rows (2.06 kg dm-3) compared with the inter-rows (1.57 kg dm-3). As a result, the SDc limit was not exceeded in any soil sample from the planting rows. In the inter-rows, SD exceeded SDc in 16.7% of samples. For this same layer in PA2, SDc was 9% higher for the planting rows (1.70 kg dm-3) compared with the inter-rows (1.50 kg dm-3). Although the difference in SDc between the planting rows and inter-rows was smaller than in PA1, for 53.3% of the inter-row samples, SD exceeded SDc, indicating that the soil physical conditions in the inter-rows of this area were more limiting than in PA1.
In the 0.35-0.40 m layer, for at least 3% of the samples, SD exceeded SDc regardless of the area evaluated (SDc was 1.57 kg dm-3 for PA1 and 1.49 kg dm-3 for PA2). Moreover, SD was closer to SDc in the 0.35-0.40 m layer than in the 0.20-0.25 m layer. In the 0.60-0.65 m layer of PA1, for 20% of samples, SD was greater SDc (1.50 kg dm-3). For this same later in PA2, 33.3% of samples showed an SD greater than SDc (1.40 kg dm-3). Overall, the 0.20-0.25 and 0.35-0.40 m samples from the planting rows (i.e., subjected to subsoiling) had the lowest percentage of samples where SD was greater than SDc. On the other hand, the 0.20-0.25 m layer from the inter-rows and the 0.60-0.65 m layer (i.e., not subjected to subsoiling) had the highest percentage of samples where SD was greater than SDc. In summary, the physical conditions in the subsoiled layers were less limiting than in the non-subsoiled layers, regardless of the evaluated soil.
Soil-water retention curves
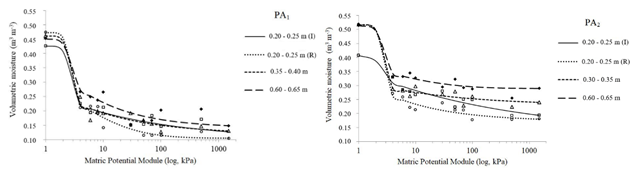
In the 0.20-0.25 m layer, the water content retained at a high matric potential (>-10 kPa) was higher in the planting rows than in the inter-rows (Figure 7). On the other hand, at a low matric potential (<-10 kPa), more water was retained in the inter-rows than the planting rows, regardless of the evaluated soil. These differences are explained by the macropore/(micropore + cryptopore) ratio (Figures 2 and 3). This ratio was 1.29 for PA1 and 1.08 for PA2 for the planting rows, and 1.05 for PA1 and 0.38 for PA2 for the inter-rows. In other words, the proportion of large-diameter pores (>50 µm) was higher in the planting rows compared with the inter-rows. These pores contribute the most to drain water, corresponding to the difference between the maximum water-holding (0 kPa) and field capacity (-10 kPa).
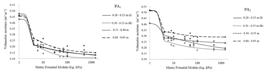
Soil water retention curves of the studied soils-PA1 (Argissolo Amarelo distrófico típico), subsoiled 6.5 years before sampling, and PA2 (Argissolo Amarelo distrocoeso fragipânico), subsoiled 1 year before sampling-fitted to the van Genuchten (1980) model. I: inter-rows; R: planting rows.
In the planting rows, water retention at a high matric potential for the 0.35-0.40 m layer was similar to that observed for the 0.20-0.25 m layer. However, at a lower matric potential, the water content retained in the 0.35-0.40 m layer exceeded that of the 0.20-0.25 m layer of the planting row, due to the higher clay content at deeper soil depths (Table 2). This was also true for the 0.60-0.65 m layer, where water retention was highest of all evaluated layers. A higher clay content allows the formation of cryptopores (pore dimeter < 0.2 µm) due to the filling of macropores with illuvial clay, especially in the subsurface layers (Startsev & McNabb, 2001).
Soil pore distribution
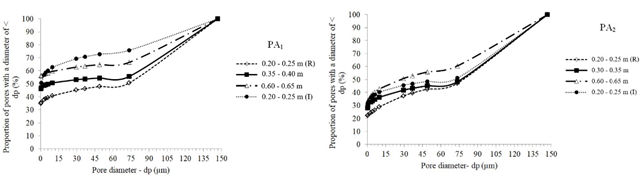
The pore diameter distribution in PA1 was more diverse than in PA2, denoted by the steeper slope of the pore distribution curves for PA1 (Figure 8). Indeed, the steeper the slope of the soil pore distribution curve, the greater the diversity of pore diameters. This finding can be explained by the higher clay FD as well as higher content of fine sand in PA1 compared with PA2 (Table 2).
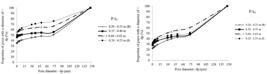
Pore distribution curves of PA1 (Argissolo Amarelo distrófico típico), subsoiled 6.5 years before sampling, and PA2 (Argissolo Amarelo distrocoeso fragipânico), subsoiled 1 year before sampling. I: inter-rows; R: planting rows.
Clay in PA1 had a higher FD than clay in PA2 and, together with the greater amounts of fine sand, resulted in greater variability in pore sizes. In an evaluation of the pore distribution of six soil classes in the region of Lavras, Minas Gerais State, Brazil Ribeiro et al. (2007) also concluded that the association between high levels of fine sand with a high clay FD increases pore size diversity.
Variability in pore distribution was greatest in the planting rows (the 0.20-0.25 and 0.35-0.40 m layers), where the pore distribution curves were concentrated in the lower part of the y-axis, indicating predominance of pores with a large diameter. The opposite was observed in the 0.60-0.65 m layer and the 0.20-0.25 m layer of the inter-rows of both soils: The pore distribution curves were concentrated in the upper portion of the y-axis, indicating predominance of pores with a small diameter, especially in PA2.
Conclusion
The improvements in soil physical properties within the subsoiled layers remained detectable even 6.5 years after subsoiling. The subsoiled layers presented an increase in the proportion of macropores and a reduction in the presence of cryptopores. The LLWR of these layers was higher compared with the non-subsoiled layers. Additionally, subsoiling reduced SD to levels below the critical threshold.
Data availability
The data supporting the findings of this study are available from the corresponding author upon request.
Acknowledgements
The authors acknowledge the support of Coordination for the Improvement of Higher Education Personnel (CAPES), National Council for Scientific and Technological Development (CNPq), and Research Support Foundation of the State of Minas Gerais (FAPEMIG)
References
-
Araújo, A. M. S. S., Menezes, A. S., Alencar, T. L., Silva, C. P., Assis Júnior, R. N., Romero, R. E., Costa, M. C. G., Almeida, B. G. & Mota, J. C. A.. (2018). Tensile strength in horizons with and without cohesive character: Variability and relation with granulometry. Catena, 166, 290-297. https://doi.org/10.1016/j.catena.2018.04.017
» https://doi.org/https://doi.org/10.1016/j.catena.2018.04.017 -
Barrios, P. G., Bidegain, M. P. & Gutiérrez, L.. (2015). Effects of tillage intensities on spatial soil variability and site-specific management in early growth of Eucalyptus grandis. Forest Ecology and Management, 346, 41-50. http://dx.doi.org/10.1016/j.foreco.2015.02.031
» https://doi.org/http://dx.doi.org/10.1016/j.foreco.2015.02.031 -
Bezerra, C. E. E., Fererira, T. O., Romero, R. E., Mota, J. C. A., Vieira, J. M., Duarte, L. R. S. & Cooper, M.. (2015). Genesis of cohesive soil horizons from north-east Brazil: role of argilluviation and sorting of sand. Soil Research, 53(1), 43-55. http://dx.doi.org/10.1071/SR13188
» https://doi.org/http://dx.doi.org/10.1071/SR13188 -
Busscher, W. J.. (1990). Adjustment of flat-tipped penetrometer resistance data to common water content. American Society of Agricultural and Biological Engineers, 33(2), 519-524. http://dx.doi.org/10.13031/2013.31360
» https://doi.org/http://dx.doi.org/10.13031/2013.31360 -
Cavalcanti, R. Q., Rolim, M. M., Lima, R. P., Tavares, U. E., Pedrosa, E. M. R. & Gomes, I. F.. (2019). Soil physical and mechanical attributes in response to successive harvests under sugarcane cultivation in Northeastern Brazil. Soil and Tillage Research, 189, 140-147. https://doi.org/10.1016/j.still.2019.01.006
» https://doi.org/https://doi.org/10.1016/j.still.2019.01.006 -
Corrêa, M. M., Ker, J. C., Barrón, V., Torrent, J., Curi, N. & Torres, T. C. P.. (2008). Caracterização física, química, mineralógica e micromorfológica de horizontes coesos e fragipãs de solos vermelhos e amarelos do ambiente Tabuleiros Costeiros. Revista Brasileira de Ciência do Solo, 32(1), 297-313. https://doi.org/10.1590/S0100-06832008000100028
» https://doi.org/https://doi.org/10.1590/S0100-06832008000100028 -
Dias, C. B., Rocha, G. C., Assis, I. R. & Fernandes, R. B. A.. (2016). Intervalo hídrico ótimo e densidade crítica de um Latossolo Amarelo coeso sob diferentes usos no ecossistema Tabuleiro Costeiro. Revista Ceres, 63(6), 868-878. https://doi.org/10.1590/0034-737X201663060017
» https://doi.org/https://doi.org/10.1590/0034-737X201663060017 - Dourado Neto, D., Nielsen, D. R., Hopmans, J. W., Reichardt, K., Bacchi, O. O. S. & Lopes, P. P. (2001). Soil Water Retention Curve. SWRC, version 3.00 beta. Universidade de São Paulo.
-
Elli, E. F., Sentelhas, P. C., Freitas, C. H., Carneiro, R. L. & Alvares, C. A.. (2019). Assessing the growth gaps of Eucalyptus plantations in Brazil - Magnitudes, causes and possible mitigation strategies. Forest Ecology and Management, 451, 117464. https://doi.org/10.1016/j.foreco.2019.117464
» https://doi.org/https://doi.org/10.1016/j.foreco.2019.117464 -
Grable, A. R. & Siemer, E. G.. (1968). Effects of bulk density, aggregate size, and soil water suction on oxygen diffusion, redox potential and elongation of corn roots. Soil Science Society America Journal, 32(2), 180-186. https://doi.org/10.2136/sssaj1968.03615995003200020011x
» https://doi.org/https://doi.org/10.2136/sssaj1968.03615995003200020011x -
Horn, R. & Dexter, A. R.. (1989). Dynamics of soil aggregation in a irrigated desert loess. Soil and Tillage Research, 13(3), 253-266. https://doi.org/10.1016/0167-1987(89)90002-0
» https://doi.org/https://doi.org/10.1016/0167-1987(89)90002-0 -
Haise, H. R., Haas, H. J. & Jensen, L. R.. (1955). Soil moisture studies of some great plains soils. II. Field capacity as related to 1/3 atmosphere percentage, and minimum point as related to 15 and 26 atmosphere percentage. Soil Science Society of America Journal, 19(1), 20-25. https://doi.org/10.2136/sssaj1955.03615995001900010005x
» https://doi.org/https://doi.org/10.2136/sssaj1955.03615995001900010005x -
Instituto Brasileiro de Geografia e Estatistica. (2019). The Brazilian Institute of Geography and Statistics. IBGE. https://sidra.ibge.gov.br/pesquisa/pevs/tabelas
» https://sidra.ibge.gov.br/pesquisa/pevs/tabelas -
Klein, V. A. & Libardi, P. L.. (2002). Densidade e distribuição do diâmetro dos poros de um Latossolo Vermelho sob diferentes sistemas de uso e manejo. Revista Brasileira de Ciência do Solo, 26(4), 857-867. https://doi.org/10.1590/S0100-06832002000400003
» https://doi.org/https://doi.org/10.1590/S0100-06832002000400003 - Klute, A. (1986). Water retention: Laboratory methods. In A. Klute (Ed.), Methods of soil analysis. Physical and mineralogical methods. (pp. 635-660). American Society of Agronomy.
-
Leão, T. P. & Silva, A. P.. (2004). A simplified Excel® algorithm from estimating the least limiting water range of soils. Scientia Agricola, 61(6), 649-654. https://doi.org/10.1590/S0103-90162004000600013
» https://doi.org/https://doi.org/10.1590/S0103-90162004000600013 -
Lebert, M. & Horn, R.. (1991). A method to predict the mechanical strength of agricultural soils. Soil and Tillage Reserach, 19(2-3), 274-286. https://doi.org/10.1016/0167-1987(91)90095-F
» https://doi.org/https://doi.org/10.1016/0167-1987(91)90095-F -
Lima Neto, J. A., Ribeiro, M. R., Corrêa, M. M., Souza Júnior, V. S., Lima, J. F. W. F. & Lima Ferreira, R. F. A.. (2009). Caracterização e gênese do caráter coeso em Latossolos Amarelos e Argissolos dos Tabuleiros Costeiros do estado de Alagoas. Revista Brasileira de Ciência do Solo, 33(4), 1001-1011. https://doi.org/10.1590/S0100-06832009000400024
» https://doi.org/https://doi.org/10.1590/S0100-06832009000400024 -
Menezes, A. S., Alencar, T. L., Assis Júnior, R. N., Toma, R. S., Romero, R. E., Costa, M. C. G., Cooper, M. & Mota, J. C. A.. (2018). Functionality of the porous network of Bt horizons of soils with and without cohesive character. Geoderma, 313, 290-297. https://doi.org/10.1016/j.geoderma.2017.11.005
» https://doi.org/https://doi.org/10.1016/j.geoderma.2017.11.005 -
Meneses, T. N., Coelho Filho, M. A., Santos Filho, H. P., Santos, L. L. A., Gesteira, A. S., Soares Filho, W. S. & Passos, O. S.. (2019). Subsoiling and planting method on the initial growth of ‘Pera’ sweet orange (Citrus sinensis (L.) Osbeck). Journal of Agricultural Science, 11(9), 1-10. https://doi.org/10.5539/jas.v11n9p1
» https://doi.org/https://doi.org/10.5539/jas.v11n9p1 -
Mota, J. C. A., Menezes, A. S., Nascimento, C. D. V., Alencar, T. L., Assis Júnior, R. N., Toma, R. S., Romero, R. E., Costa, M. C. G. & Cooper, M.. (2018). Pore shape, size distribution and orientation in Bt horizons of two Alfisols with and without cohesive character from Brazil. Geoderma Regional, 15, e00197. https://doi.org/10.1016/j.geodrs.2018.e00197
» https://doi.org/https://doi.org/10.1016/j.geodrs.2018.e00197 - Nacif, P. G. S., Rezende, J. O., Fontes, L. E. F., Costa, L. M. & Costa, O. V.. (2008). Efeitos da subsolagem em propriedades físico-hídricas de um Latossolo Amarelo distrocoeso do estado da Bahia. Magistra, 20(2), 186-192.
-
Nunes, V. J., Leite, E. S., Lima, J. M., Barbosa, R. S., Santos, D. N., Dias, F. P. M. & Nóbrega, J. C. A.. (2023). Soil preparation systems and type of fertilization as affecting physical attributes of cohesive soil under eucalyptus in Northeastern Brazil. Acta Scientiarum. Agronomy, 45(1), 1-11. https://doi.org/10.4025/actasciagron.v45i1.58010
» https://doi.org/https://doi.org/10.4025/actasciagron.v45i1.58010 -
Pacheco, E. P. & Cantalice, J. R. B.. (2011). Compressibilidade, resistência a penetração e intervalo hídrico ótimo de um Argissolo Amarelo cultivado com cana-de-açúcar nos Tabuleiros Costeiros de Alagoas. Revista Brasileira de Ciência do Solo, 35(2), 403-415. https://doi.org/10.1590/S0100-06832011000200010
» https://doi.org/https://doi.org/10.1590/S0100-06832011000200010 -
Portela, J. C., Libardi, P. L. & Lier, Q. J.. (2001). Retenção da água em solo sob diferentes usos no ecossistema Tabuleiro Costeiro. Revista Brasileira de Engenharia Agrícola e Ambiental, 5(1), 49-54. https://doi.org/10.1590/S1415-43662001000100009
» https://doi.org/https://doi.org/10.1590/S1415-43662001000100009 - Rezende, J. O. (2000). Solos coesos dos tabuleiros costeiros: limitações agrícolas e manejo. SEAGRI-SPA.
- Ribeiro Júnior, J. I. (2004). Análises estatísticas no Excel: guia prático. UFV.
-
Ribeiro, K. D., Menezes, S. M., Mesquita, M. G. B. F. & Sampaio, F. M. T.. (2007). Propriedades físicas do solo, influenciadas pela distribuição de poros, de seis classes de solos da região de Lavras-Minas Gerais. Ciência e Agrotecnologia, 31(4), 1167-1175. https://doi.org/10.1590/S1413-70542007000400033
» https://doi.org/https://doi.org/10.1590/S1413-70542007000400033 -
Richards, L. A. & Weaver, L. R.. (1944). Fifteen atmosphere percentage as related to the permanent wilting point. Soil Science, 56(5), 331-339. https://doi.org/10.1097/00010694-194311000-00002
» https://doi.org/https://doi.org/10.1097/00010694-194311000-00002 -
Ruiz, H. A.. (2005). Incremento da exatidão da análise granulométrica do solo por meio da coleta da suspensão (silte + argila). Revista Brasileira de Ciência do Solo, 29(2), 297-300. https://doi.org/10.1590/S0100-06832005000200015
» https://doi.org/https://doi.org/10.1590/S0100-06832005000200015 - Santos, H. G., Jacomine, P. K. T., Anjos, L. H. C., Oliveira, V. A., Lumbreras, J. F., Coelho, M. R., Almeida, J. A., Araújo Filho, J. C., Oliveira, J. B. & Cunha, T. J. F. (2018). Sistema brasileiro de classificação de solos (5. ed.). Embrapa.
- Sasaki, C. M., Bentivenha, S. R. P. & Gonçalves, J. L. M. (2002). Configurações básicas de subsoladores florestais. In J. L. M. Gonçalves & J. L. Stape (Eds.), Conservação e cultivo de solos para plantações florestais. (pp. 393-407). IPEF.
-
Silva, E. J., Silva, P. C. C., Amorim, F. F., Brito, R. B. F., Pamponet, B. M. & Rezende, J. O.. (2015). Atributos físicos e químicos de um Latossolo Amarelo distrófico coeso e crescimento radicular de Brachiaria decumbens submetido à subsolagem e fertilização. Comunicata Scientiae, 6(4), 385-395. https://doi.org/10.14295/CS.v6i4.484
» https://doi.org/https://doi.org/10.14295/CS.v6i4.484 - Souza, J. M., Bonomo, R., Bonomo, D. Z. & Pires, F. R.. (2015). Índice S em solo subsolado da região dos Tabuleiros Costeiros, Espírito Santo. Magistra, 27(1), 14-22.
-
Souza, L. S., Souza, L. D., Paiva, A. Q., Rodrigues, A. C. V. & Ribeiro, L. S.. (2008). Distribuição do sistema radicular de citros em uma topossequência de solos de tabuleiro costeiro do estado da Bahia. Revista Brasileira de Ciência do Solo, 32(2), 503-513. https://doi.org/10.1590/S0100-06832008000200005
» https://doi.org/https://doi.org/10.1590/S0100-06832008000200005 -
Startsev, A. D. & McNabb, D. H.. (2001). Skidder traffic effects on water retention, pore-size distribution, and van Genuchten parameter of boreal forest soils. Soil Science Society of America Journal, 65(1), 224-231. https://doi.org/10.2136/sssaj2001.651224x
» https://doi.org/https://doi.org/10.2136/sssaj2001.651224x - Teixeira, P. C., Donagemma, G. K., Fontana, A. & Teixeira, W. G. (2017). Manual de métodos de análise de solo (3. ed.). Embrapa.
-
Topp, G. C. & Zebchuk, W.. (1979). The determination of soil-water desorption curves for soil cores. Canadian Journal of Soil Science, 59(1), 19-26. https://doi.org/10.4141/cjss79-003
» https://doi.org/https://doi.org/10.4141/cjss79-003 -
Tormena, C. A., Silva, A. P. & Libardi, P. L.. (1998). Caracterização do intervalo hídrico ótimo de um latossolo roxo sob plantio direto. Revista Brasileira de Ciência do Solo, 22(4), 573-581. https://doi.org/10.1590/S0100-06831998000400002
» https://doi.org/https://doi.org/10.1590/S0100-06831998000400002 -
Genuchten, M. T.. (1980). A closed form equation for predicting the hydraulic conductivity of unsaturated soils. Soil Science Society of America Journal, 44(5), 892-898. https://doi.org/10.2136/sssaj1980.03615995004400050002x
» https://doi.org/https://doi.org/10.2136/sssaj1980.03615995004400050002x -
Vieira, J. M., Romero, R. E., Ferreira, T. O. & Assis Júnior, R. N.. (2012). Contribuição de material amorfo na gênese de horizontes coesos em Argissolos dos Tabuleiros Costeiros do Ceará. Revista Ciência Agronômica, 43(4), 623-632. https://doi.org/10.1590/S1806-66902012000400002
» https://doi.org/https://doi.org/10.1590/S1806-66902012000400002 -
Zou, C., Sands, R., Buchan, G. & Hudson, I.. (2000). Least limiting water range: a potential indicator of physical quality of forest soils. Australian Journal of Soil Research, 38(5), 947-958. https://doi.org/10.1071/SR99108
» https://doi.org/https://doi.org/10.1071/SR99108
Edited by
-
Associate Editor in charge:
Alessandro Lucca BracciniCarlos Alberto Scapim