
 Performance Bottlenecks in a Materials Recovery Facility for Selective Waste Collection
Abstract
The efficiency in material recovery at Materials Recovery Facilities (MRF) depends on factors such as the diversity and quantity of waste, adopted processes and technologies, and working conditions. This study aims to analyse the performance bottlenecks of the operational processes at the SC of selective collection in São José dos Campos (SP). The methodology involved primary data collection and analysis, adopting Lean Manufacturing principles to identify process wastage. The SC receives approximately 70 tons/day of waste from selective collection, of which 72.5% are recyclable, but over 40% have been designated as rejects. The waste of materials represented a financial loss of over R$ 2 million in 2018. There is a significant waste of time, especially for exchanging reject containers (approximately 1 hour). Another waste is the number of bags that remain closed throughout the process and are discarded as rejects.
Keywords:
Municipal Solid Waste; selective collection; Materials Recovery Facility; Lean manufacturing
Resumo
A eficiência na recuperação de materiais em centros de triagem (CT) da coleta seletiva depende de fatores como a diversidade e quantidade dos resíduos, processos e tecnologias adotadas e condições de trabalho. Este trabalho tem como objetivo analisar os gargalos de desempenho dos processos operacionais do CT da coleta seletiva de São José dos Campos (SP). A metodologia envolveu a coleta de dados primários e análise dos resultados, adotando princípios do Lean Manufacturing para identificar desperdícios do processo. O CT recebe cerca de 70 toneladas/dia de resíduos da coleta seletiva, sendo 72,5% recicláveis, dos quais mais de 40% têm sido destinados como rejeitos. O desperdício de materiais representou perda de mais de R$ 2 milhões em 2018. Há grande desperdício de tempo, principalmente para troca das caçambas de rejeitos (aproximadamente 1 hora). Outro desperdício é o número de sacos que permanecem fechados ao longo do processo, sendo descartados como rejeitos.
Palavras-chave:
Resíduos Sólidos Urbanos; coleta seletiva; centro de triagem; Produção Enxuta
Resumen
La eficiencia en la recuperación de materiales en los centros de triaje (CT) de la recolección selectiva depende de factores como la diversidad y cantidad de residuos, los procesos y tecnologías adoptadas y las condiciones de trabajo. Este trabajo tiene como objetivo analizar los cuellos de botella de rendimiento de los procesos operativos del CT de la recolección selectiva en São José dos Campos (SP). La metodología involucró la recolección de datos primarios y el análisis de resultados, adoptando principios del Lean Manufacturing para identificar desperdicios del proceso. El CT recibe aproximadamente 70 toneladas/día de residuos de la recolección selectiva, de los cuales el 72,5% son reciclables, pero más del 40% han sido destinados como rechazos. El desperdicio de materiales representó una pérdida financiera de más de R$ 2 millones en 2018. Existe un gran desperdicio de tiempo, principalmente para el cambio de contenedores de rechazo (aproximadamente 1 hora).
Palabras-clave:
Residuos Sólidos Urbanos; recolección selectiva; centro de triaje; Lean manufacturing
Introduction
Poor Municipal Solid Waste (MSW) sorting causes an overload on the final destination systems and extraction of natural resources (GODECKE ET AL., 2013). The exhaustion of sanitary landfills’ lifespans, lack of areas to install new landfills, pollution, presence of waste pickers on dumpsites and materials wastage are challenges of MSW management, demanding a revaluation of the ways recyclable materials have been treated in the post-consumption phase (RIBEIRO ET AL., 2014).
The Brazilian National Solid Waste Policy (NSWP, Law nº 12.305/2010) aims at an environmentally sound final waste destination, but Brazil still faces challenges (Zago e Barros, 2019). Only 75% of Brazilian municipalities have some initiative for separate recyclables collection, covering 38% of the population (ABRELPE, 2022; CEMPRE, 2022).
Among the key factors for the efficiency of a Materials Recovery Facility (MRF) are the amount of waste and the variety of materials to be sorted. Ideally, the refuse from MRFs should represent ~15%-18% of the total waste input. There are two approaches for recyclables sorting, that can be combined: manual or automated. To reach this efficiency, it is recommended to use automated equipment, more sensitive to contaminants and that enables retrieving purer fractions (WRAP, 2006). There are many possible setups for an MRF, and a maturity level that guarantees high-quality materials, although great inefficiencies persist that need to be improved (CIMPAN et al., 2015).
This study aims to analyze process performance bottlenecks of an MRF for the separate recyclables scheme in São José dos Campos (Brazil), to recommend enhancements to the recyclables sorting efficiency.
Theoretical Background
Separate recyclable MSW collection in Brazil
The separate recyclables collection is one of the NSWP tools and is defined as the “collection of solid waste previously sorted according to their constitution or composition”. Most successful schemes are those with a combination of models, such as the bring, exchange, and door-to-door systems (CEMPRE, 2022).
São José dos Campos was a pioneer city to implement recyclables collection in Brazil, starting in 1990, and that currently covers 100% of the urban perimeter. There, the recyclables collection can be door-to-door, operated by the company URBAM, waste pickers’ cooperatives, or scrap dealers who collect or buy waste (URBAM, 2023).
After the door-to-door recyclables collection, MSW goes through an MRF at the municipal Solid Waste Treatment Plant. A share of the recyclables is sorted and baled for further selling (URBAM, 2023). In 2017, cooperatives Coopertech, Cooperalfa and Futura started being responsible for materials sorting at the MRF (URBAM, 2023).
Materials Recovery Facilities for Municipal Solid Waste
The role of MRFs in reverse post-consumption streams is intermediate between the processes of waste collection and their destination for recycling (SOUZA ET AL., 2012). Currently, the MRFs are protagonists in waste management and materials recovery, reaching high maturity and efficiency levels, while there are inefficiencies related to the continuous variation of MSW composition. At international benchmark MRFs, the recyclables recovery rates can vary significantly, based on the waste composition and adopted technologies, for example, 12-45% of papers and cardboards; 61-72% of ferrous metals; 29-62% of non-ferrous metals; 29-67% of PET plastics; 14-73% of HDPE (CIMPAN ET AL., 2015). In the case of MRFs that receive source-separated wastes, the occurrence of recyclables like papers, cardboard, plastics, glasses, aluminium and cans are more common. Besides, the MRF capacity depends on the type of operation, choice of equipment, and installation requirements, affecting the recovery rates (TCHOBANOGLOUS E KREITH, 2002). The unit operations involved in waste processing at an MRF include:
-
Manual sorting: carried out by workers (see Materials Manual Sorting);
-
Transport: to transport all kinds of materials between locations. The types of transport include horizontal and angled conveyor belts, drag, pneumatic, vibrating, and bucket lifts;
-
Size comminution (e.g. shredding): aimed at removing contaminants and disaggregating materials to be sorted in further operations;
-
Materials recovery: besides manual sorting, with automated sorting, it is possible to recover a large share of materials (see Automated Sorting);
-
Compaction: reduces the need for storage area and costs of handling and transport;
-
Weighing: allows to keep an operational registry of the MRF and to control mass balance;
-
Mobile equipment: usually, a loader transports materials from the unloading area to the conveyors. Lifters move bales to storage areas or trucks;
-
Storage areas: dedicated to both processed materials and those awaiting to be sorted (TCHOBANOGLOUS E KREITH, 2002).
Materials Manual Sorting
-
Manual sorting is based on the human visual inspection ability. Factors like materials outbreak (large amounts in a short time), conveyor speed, fatigue caused by environmental aspects like temperature, lighting and ventilation, and health issues are some of the obstacles observed in this unit operation (BONELLO, 2017). There are several manual sorting techniques, that can be combined, like:
-
Pre-sorting: searches for items that can interfere with further processes (e.g.: bulky, hazardous);
-
Pullback: searched materials are removed from a conveyor or board, pulled towards the worker, and thrown into a container;
-
Elevated platforms: conveyors are located above the storage partitions. Manual (or automated) sorters remove and throw materials into the partitions;
-
Positive sorting: materials to be recovered are removed from a mixed waste stream (TCHOBANOGLOUS E KREITH, 2002).
Automated Sorting
Automated sorting requires a big initial investment and the need for maintenance. Besides, it needs the feed of pre-sorted waste. Process efficiency is directly related to satisfying the operational requirements of the equipment (TCHOBANOGLOUS E KREITH, 2002).
The automated sorting techniques can be classified into direct or indirect. Direct ones adopt material properties like magnetism, electrical conductivity, or density (GAUSTAD ET AL., 2012; SVOBODA, 2004). Indirect ones use sensors to detect material types. Mechanised sorting work according to the material properties:
-
Size: the most common approach is screening, by which materials pass through a sieve with predetermined hole sizes. It requires attention to aspects like particle size, distribution, density, and humidity; mesh design; equipment sorting efficiency and operational parameters;
-
Magnetism: most common method to sort out ferrous metals, using permanent or electromagnets;
-
Density: using air or liquid solutions;
-
Electrical conductivity: by electric induction of the conductive materials (metals), it is possible to sort them out by electromagnetic repulsion;
-
Optic: works based on optical features like colours, shapes, textures, and sizes (GUNDUPALLI ET AL., 2016; TCHOBANOGLOUS E KREITH, 2002).
Planning and Process Improvement at Material Recovery Facilities
MRFs should be planned to guarantee a high efficiency level at a short lead time, and high capacity at low cost. Lead time is the “duration from the moment the waste enters the MRF until it leaves the plant”. MRFs should also be ready to receive a wide variety of waste mixes in various amounts. For this reason, layout directly influences material flows, and thus the prevention of wastages (SUNDIN ET AL., 2011).
To determine efficiency targets, it is important to build a process flow diagram. Material types to be recovered are defined, and then the MRF integrated set of unit operations in the diagram. Unit operations are individual blocks that constitute a processing system to recover each material. They can be analysed individually or systemically, considering the characteristics of processed materials, types of available equipment and capacities, and the desired outputs. Recent studies have used computational models to simulate MRFs, aimed at identifying optimised setups for the arrangement of unit operations, maximising the sorting efficiency (e.g. IP ET AL., 2018; TANGUAY-RIOUX ET AL., 2022).
In MRF planning, several factors interfere with the overall efficiency of the sorting process. Particularly in Brazil, MRFs have been meeting challenges in integrating mechanical and manual labour. Highlights are:
-
obstruction of trommel (rotating sieve) holes by tangling materials: causes waste of time for maintenance;
-
ergonomics and precarious working conditions: conveyors whose heights are not designed for Brazilian workers, with unreachable zones causing the increase of refuses and lower quality of sorted materials; there are factors like standing work, intensive pace, and need for negative sorting of refuses like dead animals, toilet litter and even healthcare waste;
-
poor location of funnels for pitch-forward sorting in conveyor zones with more intensive flows (especially in the first zone), where larger materials hide smaller ones, also provoking accidental fall of materials in the funnels;
-
low quality of the final outputs and high refusing rates: the presence of many impurities in the sorted fractions (e.g. 15% in mixed papers bales), and wastage in the refuses from the unit (e.g. 40% glasses in the refuse) (SOUZA ET AL., 2021).
Performance Assessment of MRFs
Assessing the performance of a recycling program is necessary to foresee the flows of processed materials, examine strategies, and develop a circular economy. After materials processing at the MRF, it is possible to estimate the recovery rates of each material by the efficiency of sorting processes. Some critical parameters to assess MRF performance are profitability (by selling recyclables), material recovery rates (recovered/input amounts per material), efficiency (aggregation of recovery rates for all materials), and material quality (concentration of the desired material in the respective outflow) (TCHOBANOGLOUS E KREITH, 2002; IP ET AL., 2018).
The loading rate, i.e. the amount of processed materials per hour in each unit operation, can also be calculated to aid the MRF planning. It is a materials balance to determine the amounts that can be recovered, and the loading rates for each unit operation at the MRF (SILVA ET AL., 2020). It can also be relevant to assess the system efficiency based on the variations in the input waste composition and amounts (IP ET AL., 2018).
Assessing these parameters can aid important decisions when planning an MRF. For instance, it may not be interesting to enhance the quality of sorted fractions, if their selling prices do not increase. For certain materials, downstream sorting operations combined with recirculation loops can improve sorting efficiency (IP ET AL., 2018). It has been observed that simplifying the characterisation of finer waste fractions, by assuming they have the same composition as gross fractions, has severe economic effects, by overestimating the quantity of recyclables present in the wastes (KIRK E MOKADDAM, 2021). Still, on waste composition, it was observed that the complexity of light packaging natures (mix of plastics, papers, cardboard, and metals), combined with the waste processing conditions, are relevant factors that explain relatively low recovery rates (CIMPAN ET AL., 2016).
Lean Manufacturing in Solid Waste Management
It is possible to adopt the Lean Manufacturing approach to develop improvements aimed at higher efficiency of an MRF. This philosophy was conceived to achieve improvement of process by eliminating wastage and increasing efficiency (PERGHER ET AL., 2011).
Full efficiency is only possible when zero wastage is achieved. The seven classical wastes are: (1) waiting time for materials, people, equipment, or information; (2) defect; product out of specification; (3) materials transport that does not add value; (4) staff movement, not adding value; (5) excess of stock; (6) excess of production; (7) overprocessing, process stage that does not add value to the client (OHNO, 1997).
The Value Stream Map (VSM) is a central tool in Lean. Two basic principles are related to the VSM: specifying the value defined by the customer, and identifying the value chain by mapping all processes, allowing for the elimination of wastes. This approach has the advantage of collecting data like time quality, and resources, and allows to find bottlenecks where improvements can be made (HINES ET AL., 1998). After understanding the whole process with the current state VSM, the future state VSM is developed to define action plans. This stage analyses the current state VSM to find wastages and improvement hotspots. Thus, it allows comprehending the process stages that can be simplified, combined or eliminated to enhance the flow. Moreover, the future state VSM allows projecting impacts potentially caused by any change (JENSEN, 2015).
Besides the large application in industrial and commercial sectors, the Lean approach has been studied in waste management problems. However, there are few studies focused on using Lean to improve processes in MRFs. A study focused on Swedish centres for separate MSW collection and identified some process bottlenecks, like traffic in waste transports to the centres, and vehicles movements inside them; distance between parking lot and waste delivery containers; not intuitive containers’ location, leading to wastage of time; and limitations of the working hours (SUNDIN ET AL., 2011).
A study used the Lean philosophy to analyse five MRFs operated by waste pickers’ cooperatives in Brazil, identifying several bottlenecks related to:
-
Variety of waste: presence of toxic wastes, uncertainties on amounts and compositions, delivery depending on suppliers;
-
Complexity in operations planning: obsolescence or lack of technologies; takt time defined based on the shipment routines; low demand for long-term planning; lack of standardisation and procedures;
-
Labour: poor ergonomics; high variability in cycle times of processes; excessive manual work; low qualification levels;
-
External factors: market factors; poor infrastructure; prices totally defined by clients; and socioeconomic function of MRFs in the cities (TORTORELLA ET AL., 2018).
Aiming to implement improvements in the process, this study defined, in the future state VSM, some potential solutions (not dependent on external actors), like implementation of visual management practices (e.g. FIFO), reducing misunderstanding and errors; redesign of the sorting process workload, enhancing the quality of sorted materials; tasks redistribution aimed at sorting workers for specific materials, allowing for more specialisation, standardisation and accuracy; improvements in the feed to sorting, like limiting the sizes of each batch, use of gravity and visual management, allowing for a constant flow in the feed and the anticipation of actions before exhausting the MSW to sorting. Conversely, the study was limited to historical series data to build the VSM, limiting the potential to analyse the problem (TORTORELLA ET AL., 2018).
Methodology
The present study used tools comprehended in the Lean approach and was divided into three stages, of which the first was the theoretical foundation. It allowed us to observe the state-of-the-art on the topic, investigating existing studies and respective methodologies. Complementarily to scientific papers, we studied reports, books, and related legislation.
The second stage consisted of data collection at the MRF in São José dos Campos, searching to map the current processes (current VSM). Primary data were collected at the MRF for five months (July to December 2019). The main variables gathered and used in the study were obtained using a chronometer to determine:
-
idle time of waste pickers: each waste picker present on the data collection day was observed for 30 minutes, measuring the time they quit collecting materials on the conveyors for diverse reasons, also observed;
-
idle time of conveyors: For four days, the time the conveyors stood still during the working shift, even when containing waste to be sorted, was measured.
-
bags counting: for three days, we promoted 15 counting cycles of closed waste bags reaching the end of the conveyor, in periods of one minute during the standard manual sorting activity;
-
time to fill up and change the dumpster: we measured the time to fill up the dumpster with refuse and the pause time of conveyors to proceed with the full dumpster substitution by an empty one, during four hours in three days;
-
recovered items per minute per waste picker: for three days, we counted the items removed from the conveyor for one minute in each workstation along the conveyor, three counting cycles a day.
URBAM provided the last gravimetric composition of MSW, of 2018, and registered data by the platform scales at the ETRS, like the movement of wastes, comprehending the whole material that enters or leaves the MRF. The materials output can be both for selling recyclables and the destination of refuse to the landfill. The coordination of the cooperatives also supported the study with spreadsheets with the control of containers and recovered materials by workers, the daily yield, and the frequency of workers.
All data were included in an Excel spreadsheet to test hypotheses. Then, we interviewed the ETRS manager and members of the MRF administration to complement and validate the collected data and develop the current state VSM of the MRF to identify the process bottlenecks.
The VSM is a tool that represents the material flows by a process diagram, in which data boxes are aggregated below each stage to present related information. It defines where the process starts and stops, the stages are numbered by order, illustrating the current situation, as well as the inputs, outputs, and measures concerning each stage. Then, a timeline is added to sum up the process cycle. This line has to be divided into times for added-value and not added-value, decomposed in each stage. The non-added-value time comprehends the expenses in reworks, repetitive tasks, waiting and any time used not contributing to the process (Jensen, 2015).
In the third stage, we analysed the information obtained to identify wastages (bottlenecks) of the process. For that, we created graphs to identify possible performance patterns. With the results from the analyses and identified bottlenecks, and based on the theoretical background, we proposed improvements for the MRF.
Analysis of Results
Description of the MRF process
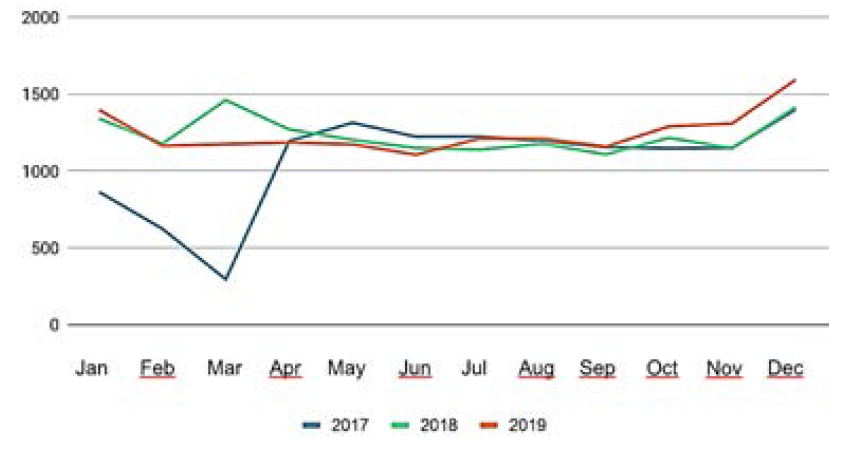
Figure 1 represents the average monthly flow of input materials to be sorted, from the recyclable MSW door-to-door collection, measured with the platform scales by which all collection trucks are weighed when coming and leaving the ETRS. The information comprehends monthly averages between 2017 and 2019. A share of this material is purchased from the cooperatives to be sorted by a private company in an area into the MRF.
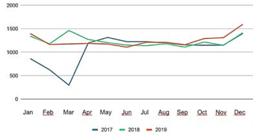
Fig. 1 shows an expressive decrease in the waste flow in March 2017, explained by a fire at the sorting area. It also shows higher peaks every December, and there is a growing trend in waste inflow in the first and last months of every year. This is explained by the increase of goods consumption by the population during the Christmas and Silvester seasons (seasonality). This fact was also observed in a study about the seasonal influences in the MSW gravimetric composition in Maceió (AL, Brazil). In this case, the increase of MSW generated in January occurred due to events like school vacations, and in December by the larger amount of people in commerce (SILVA ET AL., 2020). Based on our collected data, complementing Fig. 1, more than 40% of the input amount at the MRF during 2018 and 2019 was considered refuse (29% of refuse in 2017, 46% in 2018, and 42% in 2019).
The main resources at the MRF include a trommel, two main conveyors for manual sorting with a capacity of 30 workers each, eight balers, a lifter, a loader, and 240-litre containers for recyclable materials. At the MRF, the mixed recyclables are unloaded from the compactor trucks. Then, they are transported by the loader to the first angled conveyor where there is a manual removal (pre-sorting) of bulky materials that could harm the operation of the trommel, for example, car bumpers, cardboard, and metallic scrap. These materials are stored and sold.
The input material moves to the trommel so internal blades tear the plastic bags. The smaller wastes, passing through the sieve, fall on a conveyor, where there is a manual sorting of smaller materials by, on average, two persons, and the refuse goes to the end of the conveyor, being dumped in a separator box.
The larger particles from the trommel are directed to a funnel. From this point, the waste can go two ways: forward to the first conveyor or to a second funnel which, in turn, drives the materials to the second conveyor. The materials sorting on conveyor no. 2 is carried out together with the refuse of the sorting done by the private company (conveyor no. 1). Eventually, the waste flow is low, so a share of the materials in the first funnel is driven to the second, to keep a constant flow in both conveyors.
Further, the materials are manually pull-back sorted by the waste picker, removed from the rolling conveyor, and deposited into containers. When full, the container is manually transported by a worker to the compactors, where the materials are baled and stored in the external area of the shed, to be sold. There is no fixed position for sorting each type of waste along the conveyors. Each operator collects the material with which they have more affinity. However, there is a turnover of the workers, both in their positions along the conveyor and in the staff of the cooperatives. For this reason, there was difficulty in truly studying the types of materials collected at each position.
The refuse from both conveyors is directed to a dumpster, after passing under a cross-belt magnetic separator, which, during the study, was not fully working. All the refuse produced by the MRF is directly carried to the sanitary landfill.
Waste Characteristics
URBAM carried out in 2018 the gravimetric characterisation of the MSW from both the recyclables and commingled waste collection, and the MRF refuse, to understand the MSW composition in the city (URBAM, 2023). Two samples were analysed for each city sector, collected in different turns and weekdays, of approximately 37 kg each. Regarding the refuse, two samplings were carried out for the fine refuse coming from the trommel outlet, and the coarse refuse, from the main conveyors.
According to the gravimetry of the waste from the recyclables collection in São José dos Campos, despite 72.5% of the materials being considered recyclable, 46.1% of these materials arriving at the MRF were destined as refuse in 2018. Moreover, there are 27.5% non-recyclable materials, showing the volume of contaminants causing value loss of the material and lower efficiency of recyclables sorting. In the mixed waste collection, 21.4% are recyclable.
Another important data is related to the fine refuse, which amount reaches zero for HDPE, PET, and Tetra Pak. It is observed that, in refuse, the largest amount refers to glasses, at 13.29%. In the coarse refuse, the biggest challenge lies in paper/cardboard, which, summed up, comprehends 28.45% of the sample, and plastics, summing up all types, representing 23.92%.
Wastages Analysis
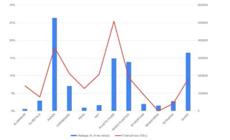
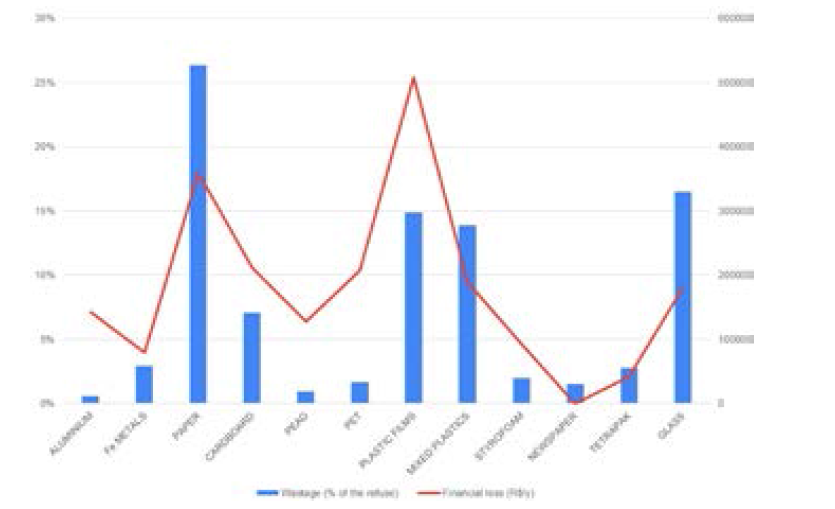
From the data collected by the URBAM scales management system, we calculated the total accumulated amount of post-sorting refuse at the MRF in 2018, equivalent to 6,817.22 tons. To this value we multiplied the average concentration of each material in the refuse composition, estimating the approximate amount, in kg, of each material wasted in a year. Finally, to find the value cooperatives failed to raise by selling these materials, we multiplied the amount of wasted material per year by the selling prices in 2018 provided by the MRF coordination. The results are presented in Figure 2.
Analysing Fig.2, we reach the result of a total loss of approximately R$ 2,139,311.81 during 2018. The most significant value corresponds to plastic films (bags), followed by paper, cardboard, PET, mixed plastics, glass, aluminium, HDPE, Styrofoam, ferrous metals, and Tetra Pak. The aluminium is sent to cooperatives and the Styrofoam had no client. For this reason, the values were obtained from the Brazilian Recycling Annuary of 2019, referring to 2018. Newspapers are donated, the reason for not appearing in the calculations. It is noted that plastic films present the largest financial loss, besides not being the most wasted material. Besides being the second material with the largest value loss, papers present the largest material wastage. Moreover, glass and mixed plastics stand out, with a high combined percentage of wasted material, corresponding to 17.25% of the total financial loss.
The MRF coordination daily controls containers delivered by each worker, per material type. Based on these data we analysed two situations: the performance of the four waste pickers who reached the target of 460 delivered containers in July 2019, and the activity of the four workers with the lowest materials delivery in the same period. In both cases plastic bags are the most sorted and still the third most wasted material. It also noted a discrepancy in the performances of sorting materials like cardboard, PET, mixed plastics, white and coloured HDPE, Tetra Pak, and paper. It is highlighted that the only most sorted materials by those workers with the worst performance are glass, oil bottles, ferrous metals, aluminium, and Styrofoam, despite a small difference.
Another primary data analysed is the idle time at positions where the waste pickers are distributed, i.e. the time that the conveyor remains moving, but the picker in each position does not carry out material sorting. We considered the following situations as idle time:
-
The MRF controls the delivered containers by people using paper files. When filling up a container, a worker responsible for moving it to the balers receives the file and hands it to the person responsible for registering the information in a spreadsheet. However, it is noted that there is a lack of trust among the pickers, as many workers waste a share of the time controlling the delivery of the material in personal notebooks to check it later with the MRF, while the conveyor keeps moving;
-
Distraction with items, especially books, magazines, wallets, purses, and clothes. When facing these objects, the pickers tend to lose focus on the materials to be sorted so they can pick items that can be useful to them;
-
Despite the pauses in established times for coffee and lunch, a large share of waste pickers take too long to return to the conveyors, which restart working at the right determined times;
-
It was observed that when the conveyors’ refuse dumpster is filled up, the conveyors are paralysed to change it for a new empty dumpster. At this moment, besides the conveyor being stopped and with materials to be sorted, the largest share of waste pickers leave their positions, especially to smoke, taking too long to return.
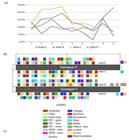
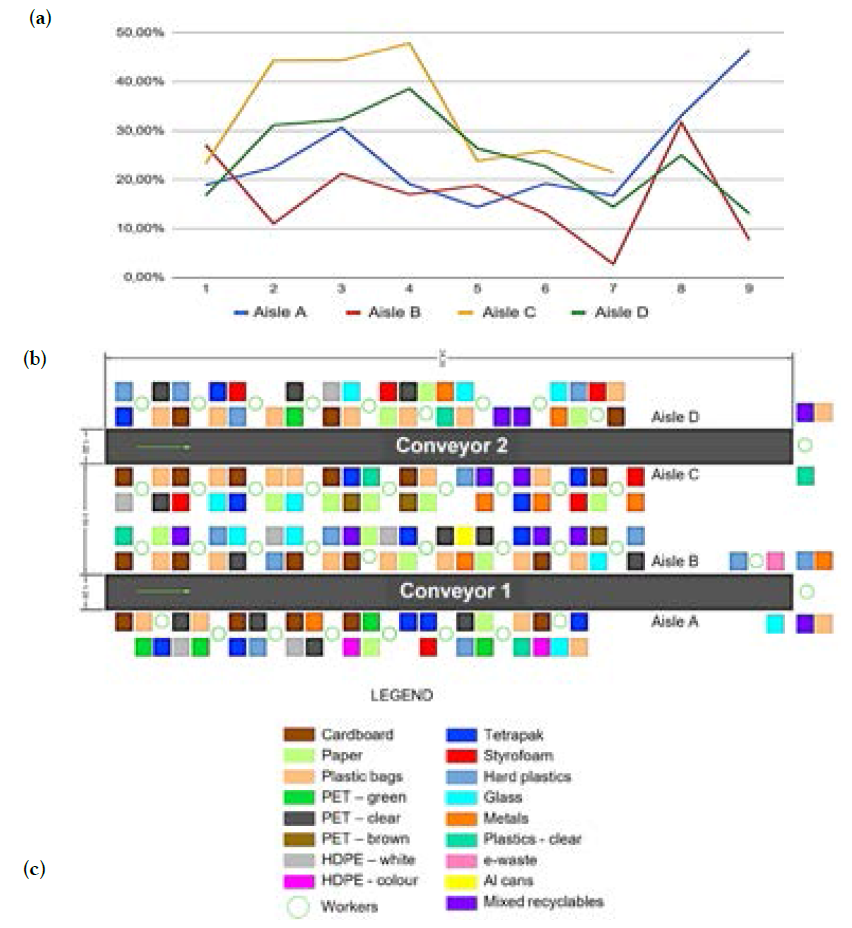
We measured thrice the idle time at each position for 30 minutes. This value was converted to percentages of the 8-hour working day (Figure 3a). The x-axis corresponds to the position of each picker along the conveyor, following the materials flow, according to Figure 3b, which presents the layout of the main conveyors during the data collection. Aisles A and B correspond to Conveyor 1, while Aisles B and C belong to Conveyor 2. The waste pickers at Position 1 of Aisle A are in front of the same position for Aisle B, and so on.
By analysing Figure 3, it is identified that, in general, Conveyor 2 presents the longest idle time, where the positions from the start to the middle are of most concern. We highlight that this conveyor carries materials not collected by the private company. According to the MRF coordinators, the company tends to collect higher-quality materials before they pass by the cooperatives’ waste pickers. At Conveyor 1, it is observed that the extreme positions are the worst. It is understandable that, in both cases, the first positions are the most problematic, as there is still a larger amount and mix of waste at this point.
Another primary data obtained was the count of materials (bulky items) picked per minute and per position along the conveyor. It is noted that the positions at the end of the conveyors present statistically significant differences relative to a larger number of positions. This fact could be justified if we could observe an absence of materials to be sorted at the end of the conveyors for having been already picked by previous positions, but this was not observed in this study. Another factor that could explain this variation is that the last picker of each conveyor is responsible for relieving the angled conveyor that feeds the refuse to the dumpster, and for pausing the movement of wastes on the conveyors when there is much material accumulated during the change of dumpsters.
Similarly to the idle times of sorting positions, we analysed the conveyors for four days, now considering the time to change the dumpsters and possible breakages of the belts. We also measured the time to fill the dumpsters, obtaining an average of 62 minutes per dumpster. The average time to change the dumpsters is 10 minutes. It was also verified that this occurs in six to seven turns per day, summing up an average of 60 to 70 minutes of stopped conveyor just for the change of dumpsters. It is highlighted that, by improving the efficiency of the materials sorting, the amount of refuse could be reduced, and so the changes of dumpster.
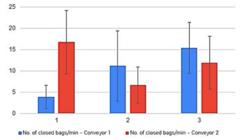
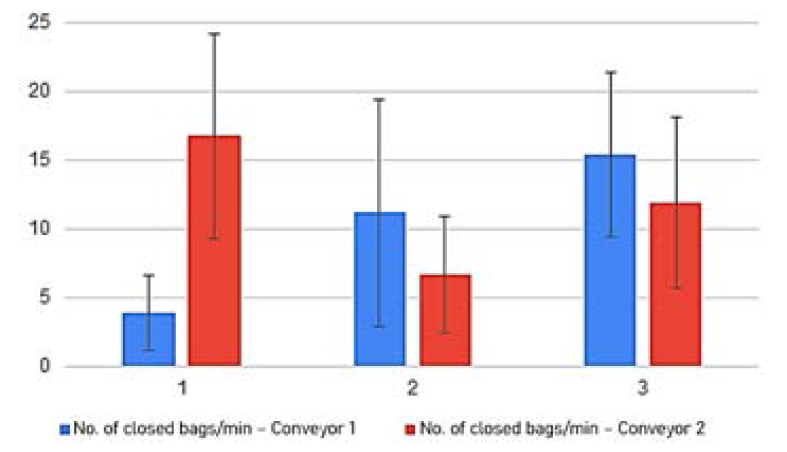
During the primary data collection, attention was drawn to the amount of waste bags that remain closed when reaching the end of the conveyors and end up destined to the sanitary landfill without the opportunity to sort their contained material. For this reason, we counted these bags during cycles of one minute in three days for each conveyor (Figure 4). Comparing Figure 4 to the data of input waste from recyclables collection feeding the conveyors in these same days, it was a pattern that could not be observed. Thus, it is not possible to determine a correlation between the amount of input material and the number of remaining closed bags. We also highlight the high standard deviations in all measures taken, indicating a high variance in the efficiency of tearing these bags along the sorting lines.
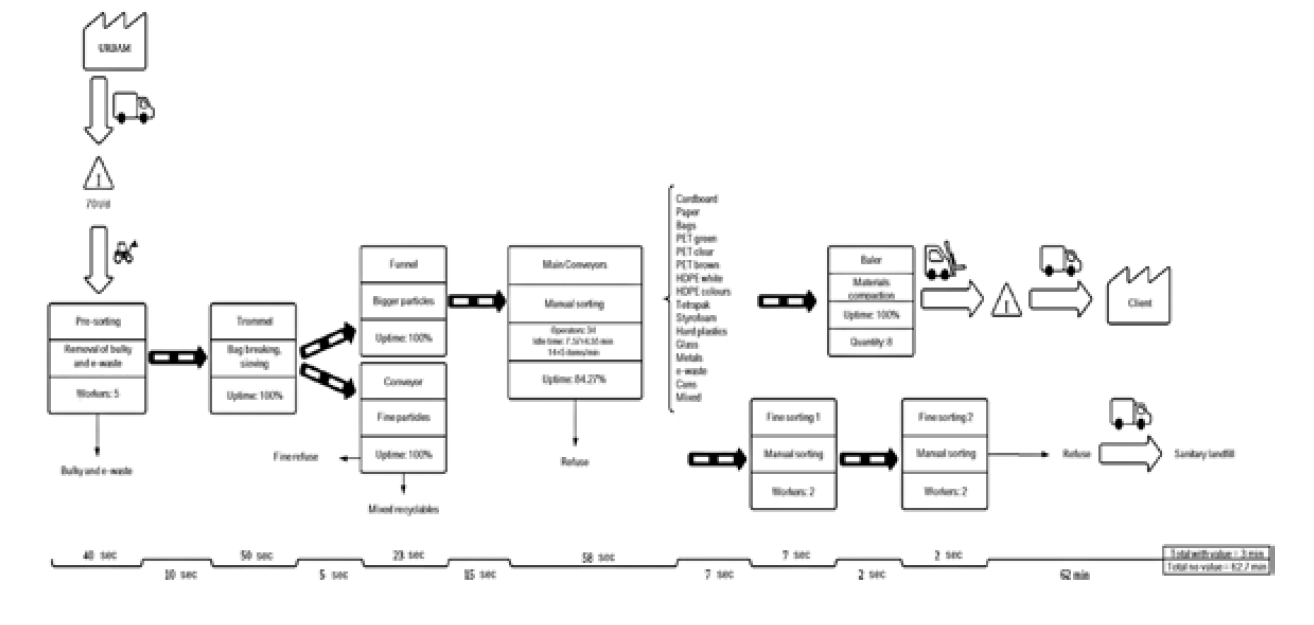
Finally, the processes that comprehend the material flows at the MRF, with respective assessed times, are compiled in Figure 5, which presents the current state VSM of the MRF. It is observed that the total time with no added value is significantly higher than the value-adding time, the greatest responsible for that being the time to fill up the refuse dumpster. This also represents two wastages discussed by Ohno (1997): (1) time waiting for materials; and (2) transportation of materials or products that do not add value.
Moreover, we calculated the Uptime, i.e. the time availability of equipment, measured as a percentage, to understand if there are severe maintenance issues that prejudice the flow. The most significant result was obtained on the main conveyors, 84,27%. This means that the idle time represents 15,73% of the daily workload. To the manual sorting, we also added the average values, and respective standard deviations, for the idle time and items collected per minute.
Proposition of Solutions
It was observed that the materials that present the highest potential for recovery in financial terms are also the main challenges during sorting: papers/cardboard, glass, and plastics, especially bags, PET, and mixed plastics. Given that the largest bottleneck for glass sorting lies on the fine refuse, we recommend installing an air classifier at the outlet of the fine refuse particles from the trommel. This way, it would be possible to sort glasses and take them directly to the stock.
The largest trommel particles, destined for manual sorting, should pass through an effective process to break the waste bags, and for a pre-sorting of bulky materials (bags, papers, and cardboard) at the beginning of the conveyors. Another way to increase the efficiency in opening the bags would be to increase the frequency of repairing the blades of the bag breaker into the trommel. Removal of bulky waste would aid the performance of the further steps of the materials flow.
The flow of bulky materials on the conveyors should pass through a series of direct classifiers to sort out metals. First, ferrous metals would be sorted by a magnetic separator, already existing at the MRF, but needing only the change of position, repair, and maintenance. Following this, an Eddy current separator could sort out non-ferrous metals.
The other materials in the stream would go through manual sorting. We recommend shortening the number of material types to be sorted by each worker, aiming at a higher sorting efficiency. In this stage, the same materials indicated in Figure 3.b would be sorted, with more allocation of workers for papers, cardboard, and plastics.
For a higher quality, it is important to sort papers by type. Spectral sensors can achieve higher efficiency and could be programmed to recognise aspects like hardness, lignin, brightness, and colour (GUNDUPALLI et al., 2016).
The indirect sorting by NIR sensors could be used to classify the mixed plastics, one of the worst bottlenecks in this study. A more accurate sorting could be obtained by sorting the plastics of a specific family of polymers, like LDPE and HDPE (GUNDUPALLI ET AL., 2016). Alternatively, plastics could be sorted manually in a loop or another line. If there is interest in automating the sorting, even more, optical sensors could be applied to classify materials by colour. This method is interesting for those with the highest added- value when sorted as such, like HDPE and PET.
Before the collection of gross refuse at the end of the conveyor, the system could also search to sort glass cullets (predominantly) by air classification. This can sort out remaining glasses and metals (heavy fraction) from papers and plastics (light fraction), the last being a share of that with the highest calorific value and potential for conversion into Refuse Derived Fuel (RDF).
Aiming at increasing the efficiency of manual sorting, it is also relevant to promote the motivation of workers. We suggest regular evaluations to identify possible fatigue factors, like temperature and ventilation, and complementary training according to needs, in topics such as family planning, environmental financial, and sexual education. The literature also recommends, for motivation, showing on a notice board the main outcomes achieved, allowing all workers to follow up on the performance (JENSEN, 2015).
Final Considerations
The São José dos Campos MRF receives 70 tons/day of waste from recyclable MSW collection, 72.5% considered recyclable, of which more than 40% have been destined as refuse. The wastage of materials represents financial losses estimated at more than R$ 2 mi. in 2018. There is a big waste of time, mostly in the required time to change the refuse dumpsters (approx. 1 hour). A relevant cause of wastage is the number of waste bags containing materials that remain closed along the process, being disposed of as refuse.
We recommend using technologies to promote an increase in sorting efficiency, like air and magnetic classifiers, Eddy current, and spectral sensors. This proposal complements the NSWP goal of inclusion of waste pickers’ cooperatives in the sorting activities. In this design, by targeting a shorter variety of materials, manual sorting could maximise the purity of products and value-adding.
We observed that many changes occur in a short period, like the rotation of workers in the cooperatives and across the conveyor positions, making it difficult to obtain more robust data for analysis.
Due to a lack of professional skills and financial resources, high heterogeneity, and cultural aspects inherent to the waste pickers, the cooperatives find it hard to guide their actions to improve their operational activity. To this, we suggest the standardisation of processes and implementing a management system, independently of installing new equipment. This favours the assessment of indicators and identification of bottlenecks, as well as the realisation of gravimetric characterisations with a higher frequency and level of details of material types.
We also recommend defining specific positions to sort determined materials, observing the need to tear the waste bags still closed, and the removal of bulkier materials, like bags, cardboard, and PET, at the beginning of the conveyors. It is interesting to promote training on the identification of the material types.
Acknowledgments
The authors thank URBAM and the cooperatives Coopertech, Cooperalfa, and Futura.
References
-
ABRELPE (2022). Panorama dos Resíduos Sólidos No Brasil. Brasil: ABRELPE, 2022. Disponível em: https://abrelpe.org.br Acesso em: 22/12/2022.
» https://abrelpe.org.br - BONELLO, D.; SALIBA, M. A.; CAMILLERI, K. P. An Exploratory Study on the Automated Sorting of Commingled Recyclable Domestic Waste. Procedia Manufacturing, v. 11, p. 686-694, 2017.
- BRASIL (2010). Lei No. 12.305/2010 - Institui a Política Nacional de Resíduos Sólidos.
-
CEMPRE - COMPROMISSO EMPRESARIAL PARA RECICLAGEM. Ciclosoft - 2022. Disponível em: http://cempre.org.br/ciclosoft Acesso em: 22/12/2022.
» http://cempre.org.br/ciclosoft - CIMPAN, C. ET AL. Central sorting and recovery of MSW recyclable materials: A review of technological state-of-the-art, cases, practice and implications for materials recycling. Journal of Environmental Management, v. 156, p. 181-199, 2015.
-
CIMPAN, C. ET AL. Techno-economic assessment of central sorting at material recovery facilities - the case of lightweight packaging waste. Journal of Cleaner Production, v. 112, p. 4387-439, 2016. https://doi.org/10.1016/j.jclepro.2015.09.011
» https://doi.org/10.1016/j.jclepro.2015.09.011 - GAUSTAD, G.; OLIVETTI, E.; KIRCHAIN, R. Improving aluminum recycling: A survey of sorting and impurity removal technologies. Resources, Conservation and Recycling, v. 58, p. 79-87, 2012.
- GODECKE, M. V.; NAIME, R. H.; FIGUEIREDO, J. A. S. O Consumismo e a Geração de Resíduos Sólidos Urbanos no Brasil. Revista Eletrônica em Gestão, Educação e Tecnologia Ambiental, v. 8, n. 8, 2013.
- GUNDUPALLI, S. P.; HAIT, S.; THAKUR, A. A review on automated sorting of source-separated municipal solid waste for recycling. Waste Management, v. 60, p. 56-74, 2017.
- HINES, P.; RICH, N.; BICHENO, J., et al. Value Stream Management. The International Journal of Logistics Management, v. 9, n. 1, p. 25-42, 1998.
-
IP, K. ET AL. Performance evaluation of material separation in a material recovery facility using a network flow model. Resources, Conservation & Recycling, v. 131, p. 192-205, 2018. https://doi.org/10.1016/j.resconrec.2017.11.021
» https://doi.org/10.1016/j.resconrec.2017.11.021 - JENSEN, M. Lean waste stream: reducing material use and garbage using lean principles. Boca Raton: Crc Press/Taylor & Francis Group, 2015.
-
KIRK, A. R. M.; MOKADDAM, Z. B. A fair CoP? MRF sampling, testing and reporting: Big problems caused by small particles. Part 2: Operational realities and financial implications. Waste Management & Research, v. 39, n. 1, p. 140-145, 2021. https://doi.org/10.1177/0734242X20941098
» https://doi.org/10.1177/0734242X20941098 - OHNO, T. O sistema Toyota de produção: além da produção em larga escala. Porto Alegre: Bookman, 1997.
- PERGHER, I.; RODRIGUES, L. H.; LACERD, D. P. Discussão teórica sobre o conceito de perdas do Sistema Toyota de Produção: inserindo a lógica do ganho da Teoria das Restrições. Gestão & Produção, v. 18, n. 4, p. 673-686, 2011.
- PREFEITURA MUNICIPAL DE SÃO JOSÉ DOS CAMPOS. Plano de Gestão Integrada de Resíduos Sólidos de São José dos Campos. São José dos Campos: PMSJC, 2015.
-
RIBEIRO, L. C. S. ET AL. Aspectos econômicos e ambientais da reciclagem: um estudo exploratório nas cooperativas de catadores de material reciclável do Estado do Rio de Janeiro. Nova economia, v. 24, n. 1, 2014. https://doi.org/10.1590/103-6351/1390
» https://doi.org/10.1590/103-6351/1390 - SILVA, C. D. O.; KONRAD, O.; CALLADO, N. H.; et al. Resíduos sólidos urbanos de Maceió/AL: análise da composição gravimétrica sob influências sazonais. Revista Ibero-Americana de Ciências Ambientais, v. 11, n. 3, p. 426-439, 2020.
- SOUZA, M. T. S.; PAULA, M. B.; SOUZA-PINTO, H. O papel das cooperativas de reciclagem nos canais reversos pós-consumo. Revista de Administração de Empresas, v. 52, n. 2, p. 246-262, 2012.
-
SOUZA, M. A.; LIMA, F. P. A.; VARELLA, C. V. S. A conformação social do lixo e das tecnologias de triagem: o caso da transferência de Centrais Mecanizadas de Triagem em São Paulo. urbe. Revista Brasileira de Gestão Urbana, v. 13, 2021. https://doi.org/10.1590/2175-3369.012.e20200073
» https://doi.org/10.1590/2175-3369.012.e20200073 - SUNDIN, E.; BJÖRKMAN, M.; EKLUND, M., et al. Improving the layout of recycling centres by use of lean production principles. Waste Management, v. 31, n. 6, p. 1121-1132, 2011.
- SVOBODA, J. Magnetic Techniques for the Treatment of Materials. London: Springer Science & Business Media, 2004.
-
TANGUAY-RIOUX, F. ET AL. Mixed modeling approach for mechanical sorting processes based on physical properties of municipal solid waste. Waste Management, v. 144, p. 533-542, 2022. https://doi.org/10.1016/j.wasman.2022.04.025
» https://doi.org/10.1016/j.wasman.2022.04.025 - TCHOBANOGLOUS, G.; KREITH, F. Handbook of solid waste management. New York: Mcgraw-Hill, 2002.
-
TORTORELLA, G. ET AL. Productivity improvement in solid waste recycling centres through lean implementation aided by multi-criteria decision analysis. Benchmarking: An International Journal, v. 25, n. 5, 2018. DOI 10.1108/BIJ-01-2017-0013
» https://doi.org/10.1108/BIJ-01-2017-0013 -
URBAM (2023). Áreas de atuação: Gestão Integrada e Gerenciamento de Resíduos Sólidos. Disponível em: https://www.urbam.com.br/atuacao_residuos_solidos Acesso em: 12/04/2023
» https://www.urbam.com.br/atuacao_residuos_solidos - WRAP. MRFs Comparison of efficiency and quality Materials Recovery Facilities. The Old Academy, 21 Horse Fair, Banbury, Oxon OX16 0AH: WRAP, 2006.
- ZAGO, V. C. P.; BARROS, R. T. V. Gestão dos resíduos sólidos orgânicos urbanos no Brasil: do ordenamento jurídico à realidade. Engenharia Sanitária e Ambiental, v. 24, n. 2, p. 219-228, 2019.

 Source: Authors, with data from the URBAM management system
 Source: Authors, based on data by URBAM
 Source: Authors
 Source: Authors
 Source: Authors