
 Modest Effects of a Resistance Training Protocol Against Obesity and Changes in Glucose Metabolism Caused by High Carbohydrate Diet in Male Swiss Mice
Imbalanced feeding and reduced physical activity cause obesity and metabolic impairments. It was investigated whether an obese phenotype and alterations of glucose metabolism because of a high-carbohydrate diet (HCD) in mice could be prevented by a protocol of high-intensity interval resistance training (HIIRT). Male Swiss mice were distributed in groups: CoS (n=24) control, sedentary and fed with standard rodent chow; ObS (n=20) obese, sedentary, and ObT (n=20) obese, trained, both fed with HCD. The training sessions (group ObT) were made on vertical ladder with 90% of the maximal load of each animal corrected weekly. After eight weeks, in vivo glucose monitoring tests, tissue and blood analyses (n=10 animals per group) and in situ liver perfusion (n=10-14 animals per group) were carried out. HCD significantly increased food ingestion and adiposity; caused liver lipid accumulation, high blood glucose and glucose intolerance; and diminished the liver output of glucose, lactate, pyruvate and nitrogen. Despite the markedly improved training performance of the ObT mice, adiposity or liver fat were not significantly changed, and HIIRT was only mildly successful as a preventive agent against the changes of glucose metabolism (restoring glucose output only with glycerol and lactate, and pyruvate output with alanine) and lipid profile (such as triglycerides, HDL, VLDL and TyG index), suggesting an insufficient energy expenditure of the designed protocol. These observations indicate that excess adiposity does not compromise high-intensity resistance training, but training format, modality, intensity and frequency are important determinants of exercise efficacy against obesity and metabolic impairments.
Keywords:
glucose metabolism; interval resistance training; high carbohydrate diet; mouse; liver perfusion.
High-carbohydrate diet caused obesity and impaired glucose metabolism in mice.
The obese phenotype was not prevented by simultaneous resistance training.
Training had only mild effects on systemic and liver glucose metabolism alterations.
Training variables are suggested as important determinants of exercise efficacy.
 Thumbnail
 Thumbnail
 Thumbnail
 Thumbnail
 Thumbnail
 Thumbnail
 Thumbnail
 Thumbnail
 Thumbnail
 Thumbnail
 Thumbnail
 Thumbnail

 (A) Relative food ingestion during eight weeks; p<0.0001 vs week 1 of the group (♣), paired t test; p<0.0001 to p<0.05 vs CoS (a), ANOVA/Tukey. (B) AUC of ingested food; p<0.0001 vs CoS (a), ANOVA/Tukey. Data shown as box and whiskers; n=20-24/group.
 (A) Progression of body mass during eight weeks; p<0.0001 vs week 1 of the group (♣), paired t test; p<0.0001 vs CoS (a), ANOVA/Tukey. (B) Body mass index; p<0.0001 vs CoS (a), ANOVA/Tukey. (C) Lee index; p<0.001 vs CoS (a), ANOVA/Tukey. Data shown as box and whiskers; n=20-24/group.
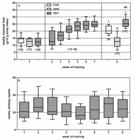
 (A) Relative maximal load of groups CoS, ObS and ObT; p<0.0001 vs week 1 of the group (♣), paired t test; p<0.0001 vs CoS (a) and vs ObS (b), ANOVA/Tukey; n is shown in ( ). (B) Total climbing repeats per week of group ObT; n=15-20. Data shown as box and whiskers.
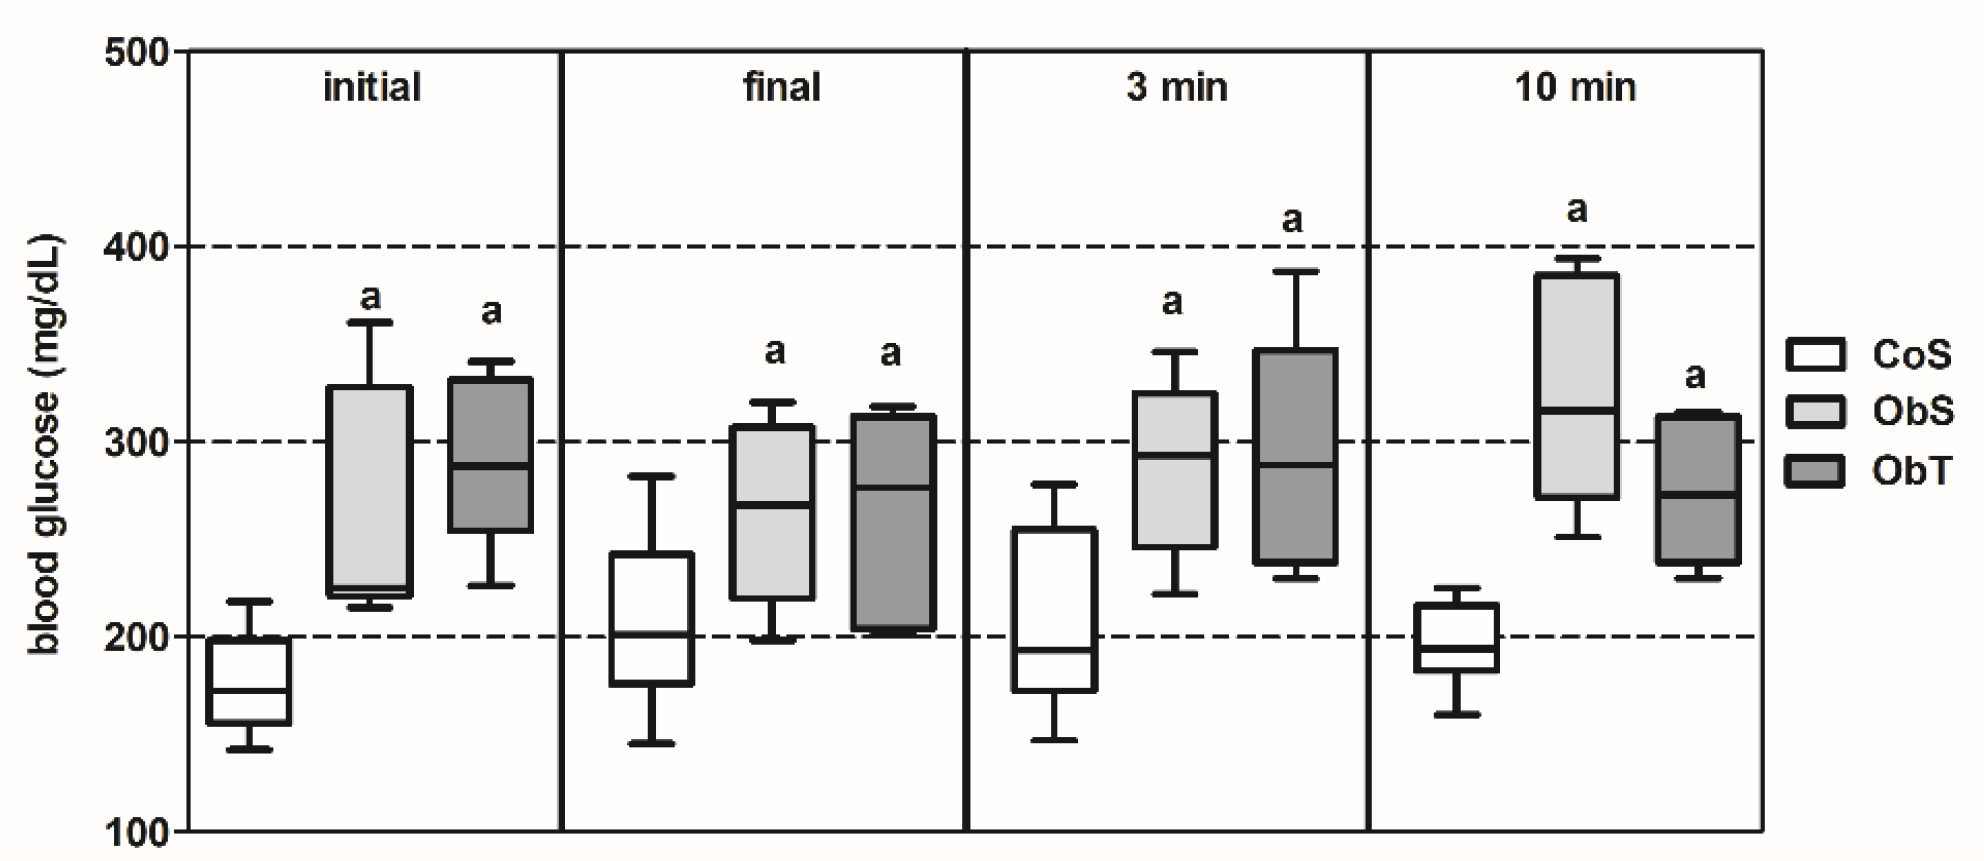 p<0.0001 initial, p<0.05 final, p<0.001 3 minutes and 10 minutes, vs CoS (a), ANOVA/Tukey. Data shown as box and whiskers; n=9-11/group.
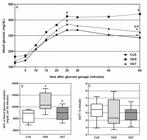
 (A) Time course of blood glucose; p<0.01 for CoS, p<0.05 for ObT, vs time 25 minutes of the group (♣), paired t test; p<0.0001 vs CoS (a) and vs ObS (b), ANOVA/Tukey. (B) Area under curve of blood glucose variation; p<0.01 vs CoS (a) and vs ObS (b), ANOVA/Tukey. (C) Rate of blood glucose increase. Data shown as mean (A) and box and whiskers (B and C); n=7-9/group.
 (A) Time course of blood glucose; p<0.0001 for CoS, p<0.05 for ObS and ObT, vs time 10 minutes of the group (♣), paired t test; p<0.05 to p<0.0001 vs CoS (a), ANOVA/Tukey. (B) Area under curve of blood glucose variation. (C) Rate of blood glucose decrease. Data shown as mean (A) and box and whiskers (B and C); n=8-10/group.
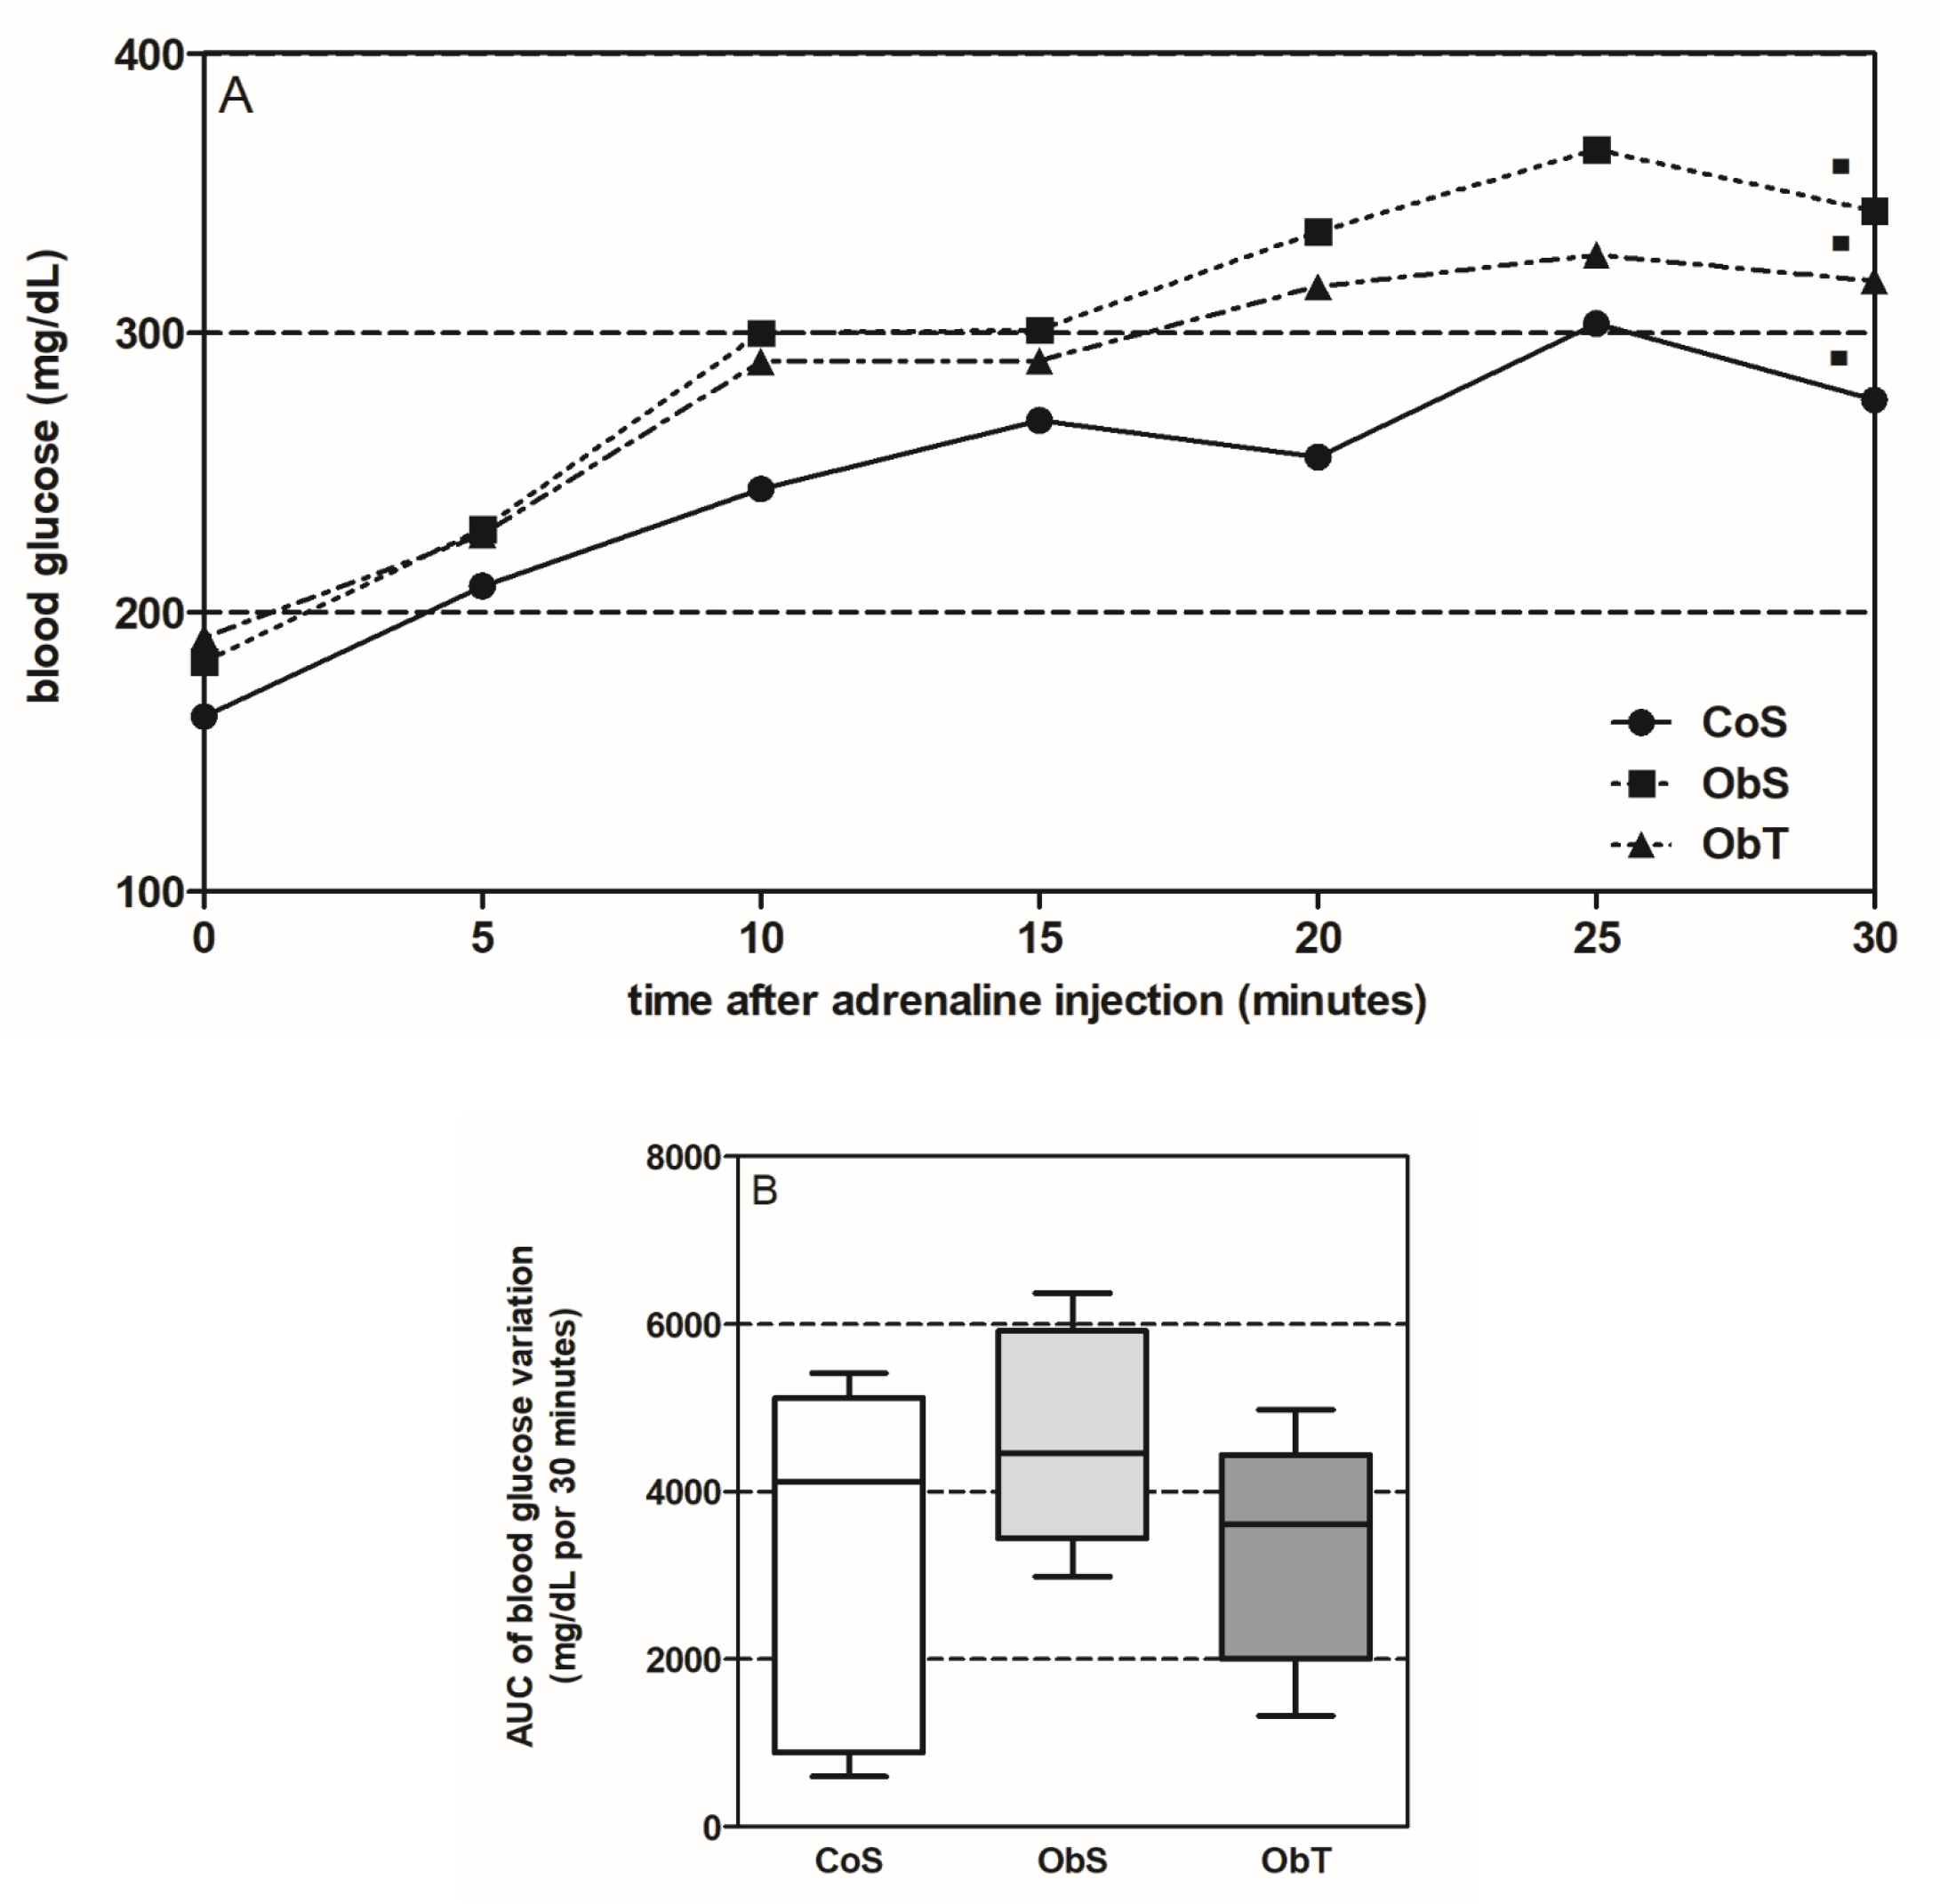 (A) Time course of blood glucose; p<0.0001 for CoS, p<0,001 for ObS, p<0,01 for ObT, vs time zero of the group (♣), paired t test. (B) Area under curve of blood glucose variation. Data shown as mean (A) and box and whiskers (B); n=8-10/group.
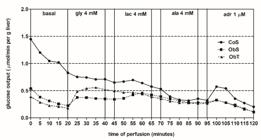
 Data shown as mean. n=6-8 (CoS), n=4-7 (ObS and ObT). gly: glycerol; lac: lactate; ala: alanine; adr: adrenaline.
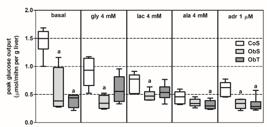
 p<0.001 for basal and adrenaline perfusions, p<0.01 for glycerol perfusion, p<0.05 for lactate and alanine perfusion, vs CoS (a), ANOVA/Tukey. Data shown as box and whiskers; n=6-8 (CoS), n=4-7 (ObS and ObT).
 Peak lactate output during basal perfusion (A) and with alanine (B) p<0.001 for CoS, p<0.0001 for ObS, p<0.01 for ObT, vs basal perfusion of the group (♣), paired t test; p<0.05 vs CoS (a), ANOVA/Tukey. Peak pyruvate output during basal perfusion (C) and with alanine (D) p<0.0001 for CoS and ObT, p<0.001 for ObS, vs basal perfusion of the group (♣), paired t test; p<0.0001 vs CoS (a) and vs ObS (b), ANOVA/Tukey. Peak nitrogen output during alanine perfusion (E) p<0.001 vs CoS (a), ANOVA/Tukey. Data shown as box and whiskers. n=5-8 (CoS), n=6-7 (ObS), n=4-7 (ObT).
 (A) Rate of glycolysis; p<0.01 vs CoS (a), KW/Dunns. (B) Rate of glycogenolysis; p<0.0001 vs CoS (a), ANOVA/Tukey. Data shown as box and whiskers. n=6-8 (CoS), n=6 (ObS), n=4-5 (ObT).