 Design and Linearization of a Doherty Power Amplifier in 45 nm CMOS Technology for 5G Applications
Abstract
Linearity and efficiency are simultaneously two important aspects for designing a power amplifier (PA) dedicated to 5G millimeter-wave applications. However, a PA suffers a trade-off between these two aspects. The maximum efficiency of this circuit happens in a non-linear region, which is not suited for mobile transmission applications. Besides, even when operating at the linear region, the circuit may not be able to fully comply with digital metrics standards which ensure a good quality for mobile transmission applications. To enhance efficiency in back-off regions from the PA non-linear region, Doherty topology is a good preference. To comply with digital metrics standards, enhancement of PA linearity through digital pre-distortion (DPD) is possible. This work presents the design of a Doherty PA at a central frequency of 26 GHz and focuses on showing a methodology for linearization with DPD using an iteration between SpectreRF and MATLAB. The PA is designed in a 45 nm node using a commercial CMOS process. DPD is applied using a memory polynomial model with an indirect learning structure to enhance its accuracy. For continuous-wave signals, the Doherty PA achieves a saturation power of 22.2 dBm, a peak PAE of 23.76% and 12.6% in 6 dB back-off region. DPD is applied to comply with error vector magnitude (EVM) standards for a 5G NR modulated signal. The DPD technique improves the linearity of the PA as it can be seen by the improvement in the measured EVM by 20/3 dB and in adjacent-channel-power-ratio (ACPR) by 18.36/4.28 dB for a 5G NR 256 QAM signal with 50/100 MHz bandwidth.
Keywords:
Doherty power amplifier; millimeter-wave; digital pre-distortion; 5G.
HIGHLIGHTS
A methodology for digital pre-distortion application is presented.
A saturation power of 22.2 dBm is obtained for the power amplifier (PA) in simulation.
A peak of 23.76% of power added efficiency is obtained for the PA in simulation.
Digital predistortion application for 5G NR 50/100 MHz modulated signals improves the error vector magnitude by 20/3 dB.
INTRODUCTION
Fifth generation of mobile telecommunication (5G) applications require low latency, high throughput and a high density of users [1]. To meet these demands, millimeter-wave (mm-Wave) band was deployed, and a wide range of frequency is available (24 GHz - 60 GHz). However, some drawbacks are observed within this new frequency region. First, because of the high frequencies used, the coverage capability of this band is smaller. This leads to the need for more cells to be deployed to ensure the same coverage area when compared to the one offered by sub-6 GHz frequencies. Second, the influence of path loss is significant, leading to worse signal-to-noise ratio (SNR) at reception and overall degradation of signals during transmission. Systems with multiple-input-multiple-output (MIMO) are required so that the SNR can be enhanced, but at the cost of an increase in the design complexity and in the number of radiofrequency (RF) paths in such systems. The combination of more hardware and cells deployment leads to the need for energy efficient systems [1,2].
The power amplifier (PA) is one of the most energy hungry circuits that is found in RF transceivers [2] and its maximum efficiency behavior happens in the compression zone which is the most non-linear region of operation. Thus, a trade-off between linearity and efficiency is established. Furthermore, high modulation schemes are used in 5G to ensure high throughput, but at the cost of raising the total amount of peak-to-average-power-ratio (PAPR). Consequently, PAs are needed to operate far away from their compression zone to secure linearity, leading to an operation far away from their efficiency peak. In this scenario, Doherty power amplifier (DPA) presents a good linearity-efficiency trade-off, because of its feature of maintaining a high value of efficiency in the output back-off (OBO) regions [3].
Due to the influence of transistors non-linearities and memory effects from passive networks, error vector magnitude (EVM) and adjacent-channel-power-ratio (ACPR) metrics suffer degradation in their values. To overcome this issue, linearization techniques can be implemented to correct amplitude-to-amplitude (AM-AM) and amplitude-to-phase (AM-PM) curves, making it easier for PAs to comply with communications standards. Digital pre-distortion (DPD) technique uses a model to replicate the inverse behavior of a PA to cancel non-linear and memory effects of the circuit by pre-distorting the input signal. The advantages of this approach are the use of well-known and robust models and the possibility of implementation in base-band processors [4].
Therefore, the aim of this work is to design a DPA using a 45 nm node for CMOS process and apply a digital pre-distortion methodology. The circuit operates at a central frequency of 26 GHz. The main contribution of this work is to present and apply a methodology for DPD application using an iteration between SpectreRF and MATLAB.
The DPA performance is simulated on SpectreRF using harmonic balance and envelope simulations for operation with continuous-wave and modulated signals, respectively. EVM is used to compare where the DPA complies with communication standards for a 5G New Radio (NR) protocol. The methodology for DPD application is based on indirect learning and is done using an iteration between simulations on SpectreRF and signal processing on MATLAB. The work demonstrates the linearization methodology on a 5G NR 256 quadrature amplitude modulation (QAM) signal applied to the DPA.
Related works
For mm-Wave applications, some DPAs have already been proposed for complementary metal-oxide-semiconductor (CMOS) process [5-7]. In [5], the main contribution focuses on the optimization of the power combiner at the DPA output using a novel passive network. While the methodology reduces the number of passive devices at the output power combiner, it does not take into consideration the problem of narrow bandwidth associated with the approach.
In [6], a transformer-based DPA is proposed. Additionally to input and coupling transformers, the work uses a series transformer which incorporates the functionality of output matching and impedance transformer in single integrated passive. The impedance transformation ratio at the output is large enough so that more power can be delivered and the bandwidth associated with the DPA is not degraded. However, this approach is more complex in terms of design.
In [7], a beamforming DPA is proposed. The circuit contains a vector multiplier block with enhanced AM-PM characteristic so that it can generate the proper phase for the signals associated with the beamforming structure of the transmitter. The power combiner is designed using a integrated transformer and is optimized for output matching and impedance inverter functions. The main drawback of the circuit is the lower efficiency performance when compared to other PAs in the state-of-art.
In the aforementioned works only [7] uses DPD as a option for linearity enhancement for DPA operation with modulated signals. However, one does not find a description or methodology regarding the application of such technique. The importance of a known methodology for DPD application contributes not only for the replication and dissemination of such technique in a design environment but also allows a discussion regarding when this technique can be used to relax design constraints related to the linearity of the circuit.
MATERIAL AND METHODS
This section details the methodology behind the design and the linearization of the DPA and is organized as follows: subsection “Power amplifier fundamentals” describes some important concepts of PAs. Subsection "Doherty power amplifier design" describes the working principle and methodology for DPA design. Subsection "Digital pre-distortion principles" presents the fundamentals concepts of DPD. Subsection "Digital pre-distortion methodology" presents the methodology for DPD application.
Power amplifier fundamentals
The power amplifier is a radiofrequency circuit located at the front-end of transmission systems [8]. The PA delivers to the antenna a signal whose power is viable to reach target devices or points of interest.
Ideally, the responses of output amplitude by input amplitude (AM-AM curve) and the difference between the output and input phase by input amplitude (AM-PM curve) do not present nonlinearities for any magnitude of the input signal. However, the typical response curve of a PA is composed by a linear region and a saturation region. In the latter, output power exhibits a compression behavior and reaches a maximum value [8].
Large-signals metrics commonly used to describe linearity are output compression point of 1 dB (OCP1) and saturation power (Psat) [8,9,10]. The former measures the point where the power gain deviates by 1 dB from its expected value and the saturation power refers to the maximum power provided by the PA.
Efficiency is typically measured by power added efficiency (PAE), which is the ratio of the power added at the output (Pout-Pin) to the PA DC power consumption (PDC) [8,9,10].
Besides, PAs are divided into operating classes. Each class definition is based on the measurement of the signal excursion angle at the output and represents a way of classifying the linearity-efficiency trade-off [9, 10]. Class A has an excursion angle of 360º, while class B has 180º. Class AB has a value between 180º and 360º, while class C has an excursion less than 180º. It is observed that the lesser the excursion angle, the greater is the efficiency [9,11].
Small-signals measurements can also be done using scattering parameters, or commonly S-parameters [8]. Small-signal gain (S21) and direct isolation (S11) are the most used in literature.
Transmitters must comply with standards imposed in communication protocols to ensure quality of transmission [8,9,12]. In this sense, some digital channel metrics are determined for power amplifiers, since the effects of nonlinearities degrade spectral composition and overall quality of transmission.
Error vector magnitude (EVM) is based on the quantitative analysis of a constellation that represents the symbols associated with modulated signals [9]. The metric calculates the error between the ideally expected position and the measured position of any given symbol in a constellation composed of a set of symbols related to the modulation scheme. Equations 2 and 3 exhibits the definition of EVM [8]
where the term denotes the difference between the vectors containing the measured and ideal positions of the symbol in constellation, Vrms is the voltage of the modulated signal, in root mean-square, and N is the number of symbols in the sample. The lower the value, the less likely the PA is to present an ambiguous or erroneous symbol.
For the 5G NR transmission protocol, [12] establishes maximum values for EVM in the frequency range from 24.25 GHz to 27.75 GHz, as shown in Table 1.
The adjacent-channel-power-ratio (ACPR) is based on the analysis of a power spectral density (PSD) and it refers to how much of the power in a given reference channel leaks to an adjacent transmission channel [9].
The performance of the PA with digital metrics is linked to its linearity [3,4,7,8,9]. Therefore, improving the linearity of the circuit promotes an improvement in the aforementioned metrics.
Doherty power amplifier design
The topology was first presented in [13] focusing on efficiency enhancement of linear PAs that operate with modulated signals. Figure 1 shows the DPA architecture.
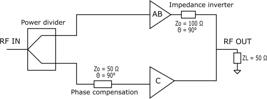
The architecture is composed of a power divider at the input that splits the signal between two branches: the main branch, composed of a PA biased in class AB and an inverting impedance; and the auxiliary branch, composed of PA biased in class C and a phase compensation impedance. Typically, the two impedances are designed based on quarter-wave transmission line (TL) which, in practice, can be implemented by striplines or lumped components [6,7]. Both TLs have an angle (Ɵ) of 90º and a proper value of characteristic impedance Zo [6,7,13].
The operation of the DPA is based on load modulation technique. The auxiliary PA remains off until 50% of the maximum input range. As the input varies between 50% and its maximum value, the auxiliary branch injects current at the output impedance (ZL) node and the impedance inverter changes the load seen by the main PA from 4 × ZL to 2 × ZL. As the voltage peak is maintained in its maximum value during the injection of current by the auxiliary path, the efficiency is increased in this OBO region, which corresponds to a 6 dB back-off [9,13]. A phase correction impedance is used so that the signal from the auxiliary branch can match the phase deviation caused by the impedance inverter in the main branch.
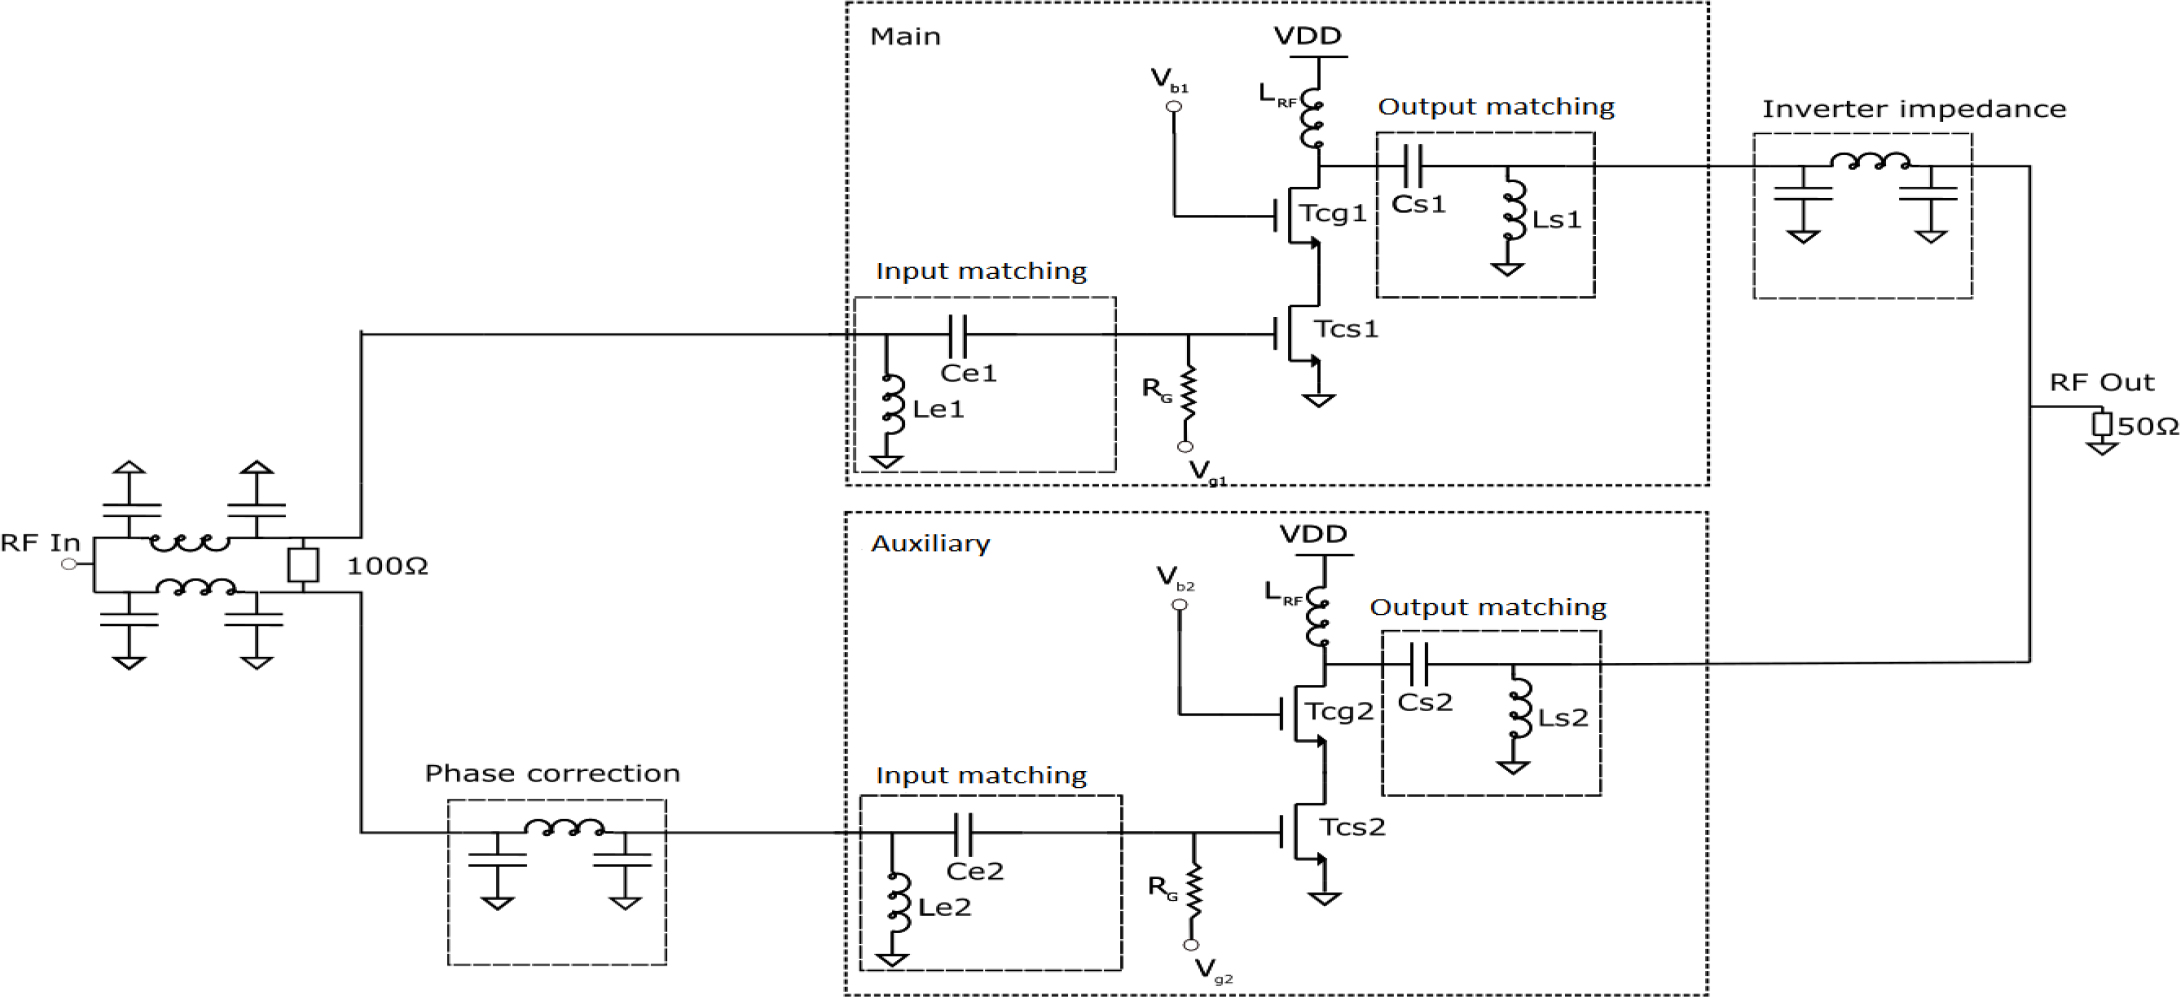
The proposed DPA schematic is shown in Figure 2. The main and auxiliary PAs are designed with a classic two stack cascode topology, granting higher voltage excursion and better distribution of stress suffered on both transistors [9]. The voltage supply (VDD) is set to 3.3 V and their biasing at common-source gate is set to class AB and C for the main and auxiliary PAs, respectively, following the classic topology [13] presented in Figure 1.
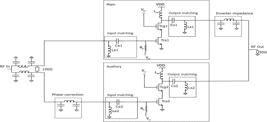
In the main PA, the total width of Tcg1 and Tcs1 transistors are 200 µm. For the auxiliary PA, the total width is 200 µm for Tcg2 and is 150 µm for the Tcs2 transistor. Simulations of harmonic balance in SpectreRF were done to ensure that both PAs deliver a saturation power of at least 20 dBm.
The gate biasing voltage of the transistor in the common gate of the main PA is Vb1 = 2.8 V and its choice is based on an optimization that considered a trade-off between PAE and Psat. The PAE was simulated for values of Vb1 above 2.5 V and the choice is based on the maximum value of PAE that could meet the condition of Psat > 20 dBm.
LRF is the choking RF inductor, while Rg is the biasing resistance. Their values are 1.42 nH and 10 kΩ, respectively. Nodes Vg1 and Vg2 are the input biasing voltages of the main and auxiliary amplifiers and their values are set to 650 mV and 250 mV, respectively, considering a threshold voltage vth ≈ 300 mV.
Input matching was done for both PAs. For the main PA, the value of the passives are Ce1 = 18.39 fF and Le1 = 83.71 pH, while for the auxiliary PA, the value are Ce2 = 49.53 fF and Le2 = 93.76 pH. Output matching was done to improve the compression point value, based on the load-pull technique. For the main PA, the value of the passives are Cs1 = 15.68 fF and Ls1 = 414.81 pH, while for the auxiliary PA, the values are Cs2 = 16.9 fF and Ls2 = 352.2 pH. SpectreRF was used to simulate load-pull and to obtain the input impedance of both PAs.
The input splitter is based on Wilkinson's power divider and adopts a lumped based component design, following the same TLs methodology for the analog blocks of phase correction and impedance inverter [8]. The values of capacitance and inductance are obtained through equations
and
where Zo is the characteristic impedance of the TL with respect to the values shown in Figure 1.
The DPA performance can be evaluated based on continuous-wave and modulated signals [14]. For continuous-wave, harmonic balance simulations are done to obtain linearity and efficiency parameters, such as Psat, OCP1 and PAE. For envelope simulations, EVM is one of the most important digital metrics for characterization [6] and so it is adopted to determine which scenarios the DPA needs an enhancement in linearity to comply with the standards accordingly to Table 1.
Digital pre-distortion principles
The pre-distortion technique aims at a desired circuit to reproduce its inverse behavior and present a distorted signal at its input. The result is a system that presents a linearized transfer curve and is composed of a pre-distorter and the target circuit [4,15,16].
A pre-distortion system that is implemented in baseband is an alternative of great interest in literature [15]. Such an approach permits the use of more complex and accurate models for the PA, in addition to the use of a digital circuit with high integrability potential [9]. Therefore, a DPD is a specific type of pre-distortion system that can cancel both memory and non-linear effects arising from the PA [7, 9,10].
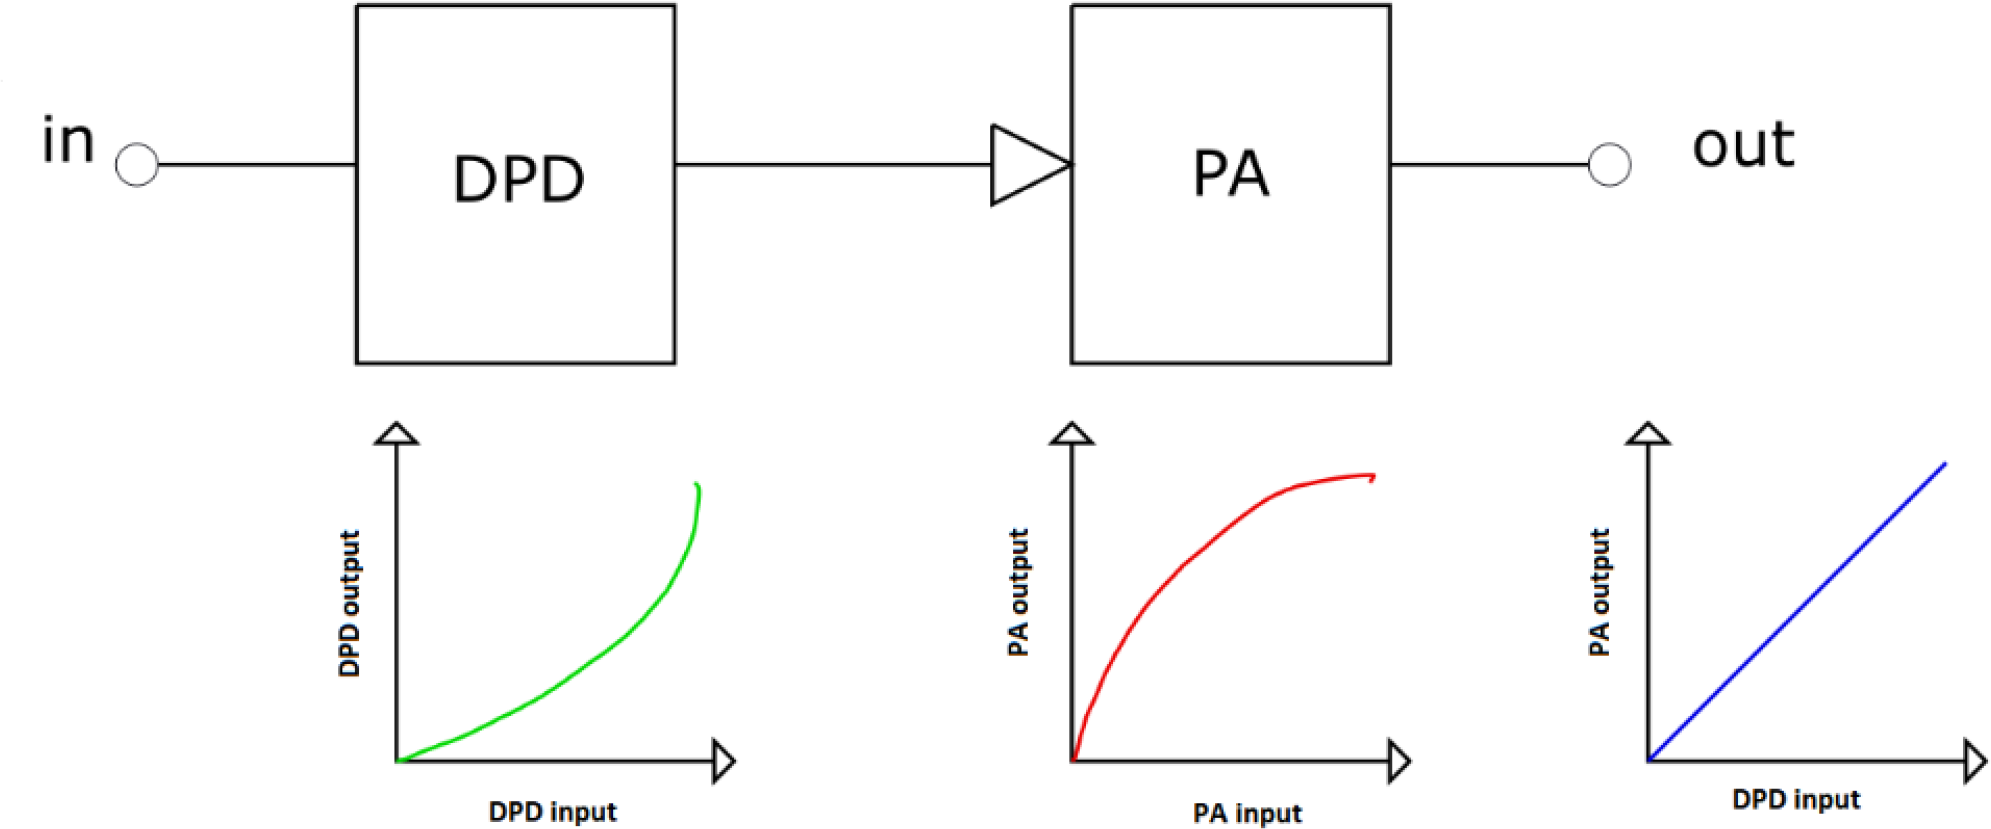
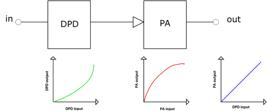
Figure 3 shows the basic system organization, composed of a DPD in cascade with a PA [16]. For the sake of simplicity, additional analog and digital circuits related to the baseband and radiofrequency part of this system (digital-to-analog converter, antenna, local oscillator, mixer, etc) were omitted. The transfer curves associated exemplify the principle of linearization showing that an inverse response (green) of a DPD is generated based on a known response (red) of a PA to present at the output a linearized AM-AM response (blue) [16].
A known model to describe the PA behavior is the Volterra series [4, 16, 17, 18]. This model is based on Taylor’s series and includes memory parameters, to properly describe the PA behavior. A memory system means that for a given instant of time, the output response depends on the response of previous instants [16].
The input and output behavior of the PA are measured and a linear extraction method, such as linear regression, is applied so that the coefficients are obtained [16]. However, the model suffers from a trade-off between accuracy and processing complexity. For large values of memory (M) and non-linearity (P), the application of the model is almost unfeasible.
Other models based on Volterra’s series are proposed in literature so that a simplified version can be achieved while maintaining good accuracy. The memory polynomial (MP) model exhibits a good compromise between accuracy and complexity, making its applicability recurrent for linearization [7]. For a given set of input () and output (), where the over bar denotes a complex quantity, the MP model has its low-pass representation [16] accordingly to equation 6
where M represents the memory parameter, P the truncated value of the non-linear parameter of the model and c the complex coefficients. An inverse response is obtained based on the behavior collected from the output of the PA and equation 6 can be rewritten as equation 7
Linear regression can be applied to solve equation 7 by finding the coefficients . The accuracy of the model can be evaluated as well. For a set of N points, equation 8 shows the normalized-mean-square-error (NMSE), which is the ratio of the error obtained through modeling for a given point and the original reference value [16]
Additionally, for a given value of M and P, the model can achieve a better accuracy without the need of changing its parameters. This process is known as learning and in literature there are two possible ways to achieve it: direct and indirect learning [4]. Direct learning relies on the use of adaptive algorithms that update the values of the coefficients in real time. Usually, adaptive algorithms have non-linear characteristics and a real time evaluation with the PA considering hundreds of iterations is needed [4].
In an indirect learning structure, a two-iteration process can achieve better accuracy and it is based on a linear method of extraction. Though it exhibits lower performance than direct learning, it provides a faster and non-complex method that can be applied.
For this work, indirect learning is chosen [4,6], as it would be unfeasible to apply hundreds of iterations based on SpectreRF and MATLAB.
Digital pre-distortion application
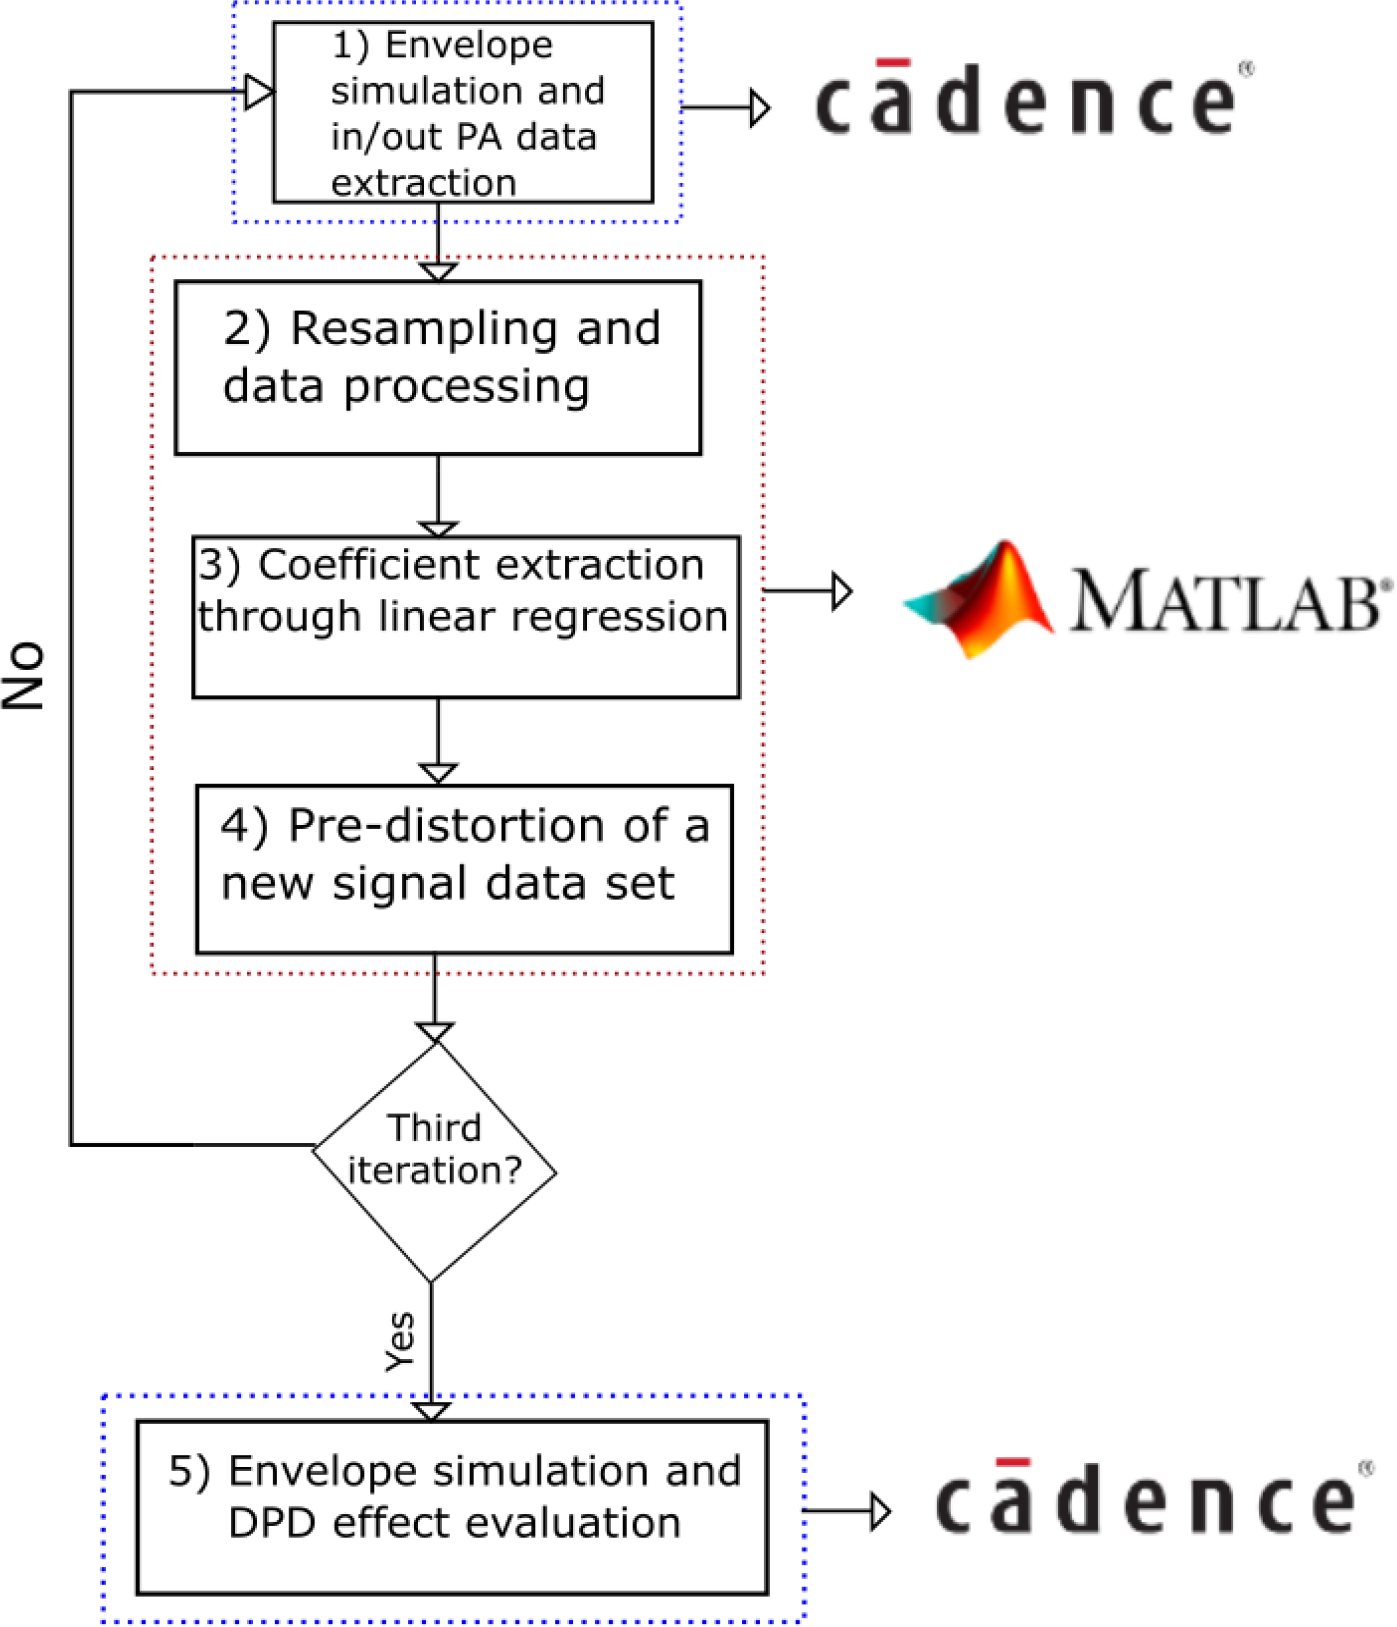
The proposed method for DPD application uses an iteration between SpectreRF and MATLAB. Indirect learning needs at least two iterations so that the coefficients are updated and the effect of DPD can be evaluated. Figure 4 shows a flowchart containing an overview of the process.
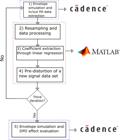
In the first iteration, the AM-AM response of the PA is modeled through the input and output data collected and the associated coefficients are extracted. The DPD response is modeled using the coefficients previously extracted and a new signal dataset for the PA. The new dataset corresponds to in equation 7. Thus, a pre-distorted signal is generated and can be applied to the input of the PA.
In the second iteration, the AM-AM response of the PA is modeled again using the input and output collected. As the PA is submitted to a distorted input, a new output behavior is obtained and so an update of the coefficients can be done. Consequently, an update for the DPD response is also obtained and a new dataset is able to be pre-distorted based on this update. It is expected that an improvement in NMSE is observed from the first to the second iteration, validating the learning process.
The third iteration only applies the new set of pre-distorted signal at the input of the PA and a comparison can be made between the PA response with and without DPD. The results can be observed based on the EVM and ACPR impacts and AM-AM responses of the PA.
RESULTS
This section shows the results associated with the DPA performance. Subsection "DPA simulation results" exhibits the results for continuous-wave and modulated signals, done in simulations before parasitic extraction. Subsection "Linearization" shows the results for the linearization process using the methodology described in the last section.
DPA simulation results
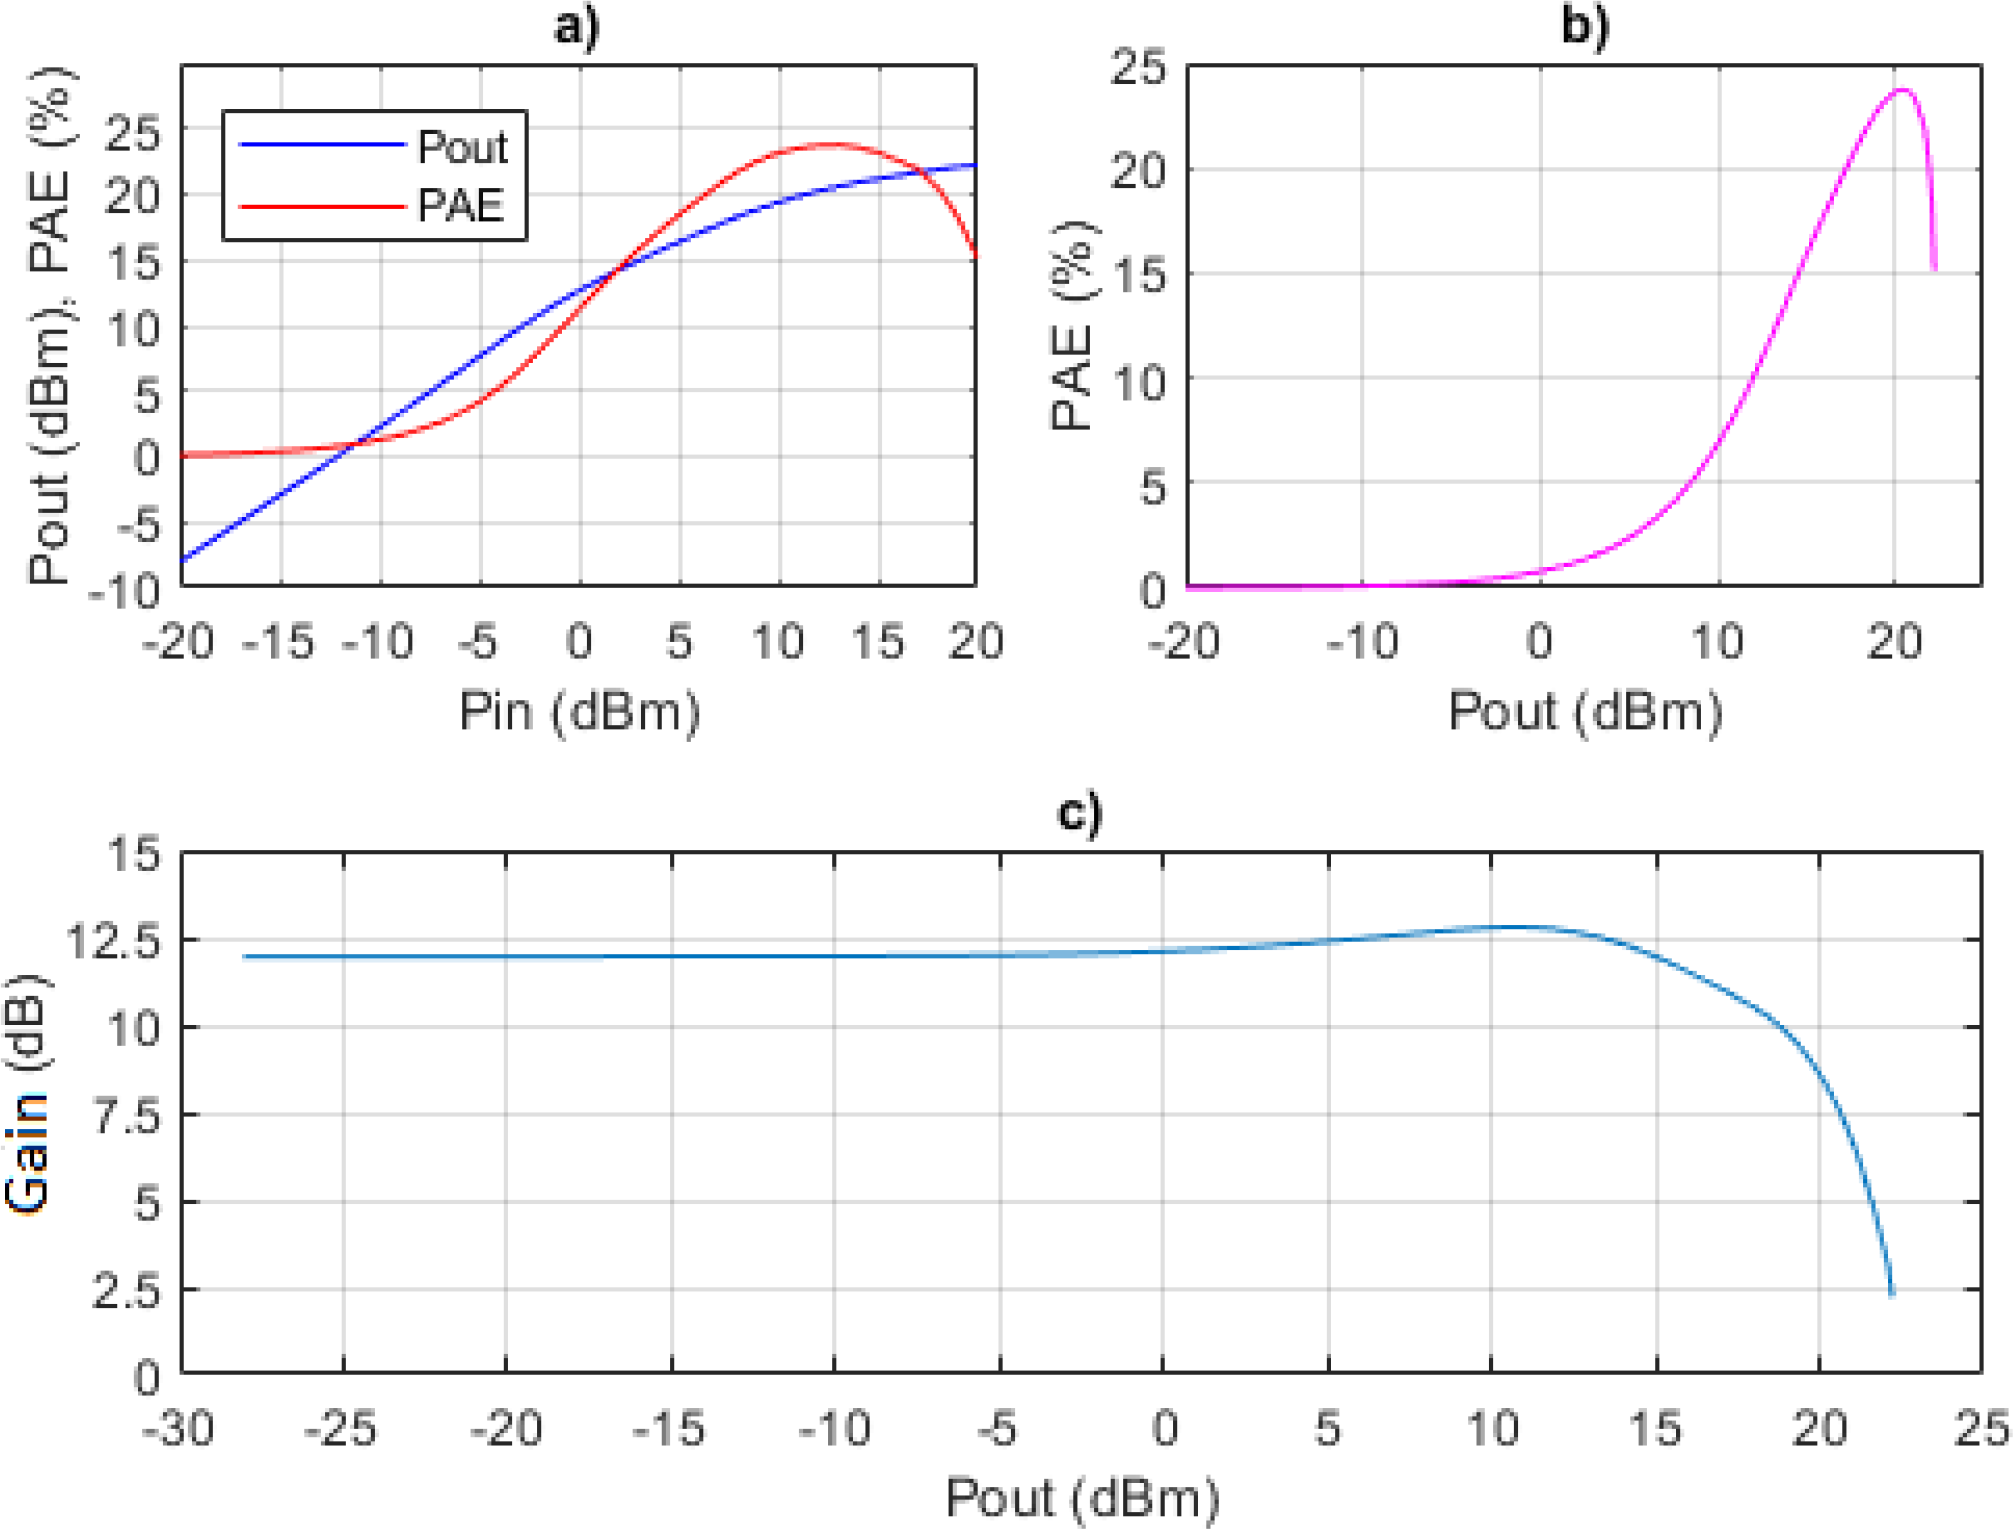
Figure 5 illustrates the following PA response curves simulated at the center frequency of 26 GHz: output power and PAE versus input power (Figure 5.a), PAE versus output power (Figure 5.b), and large signal gain versus output power (Figure 5.c).
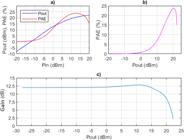
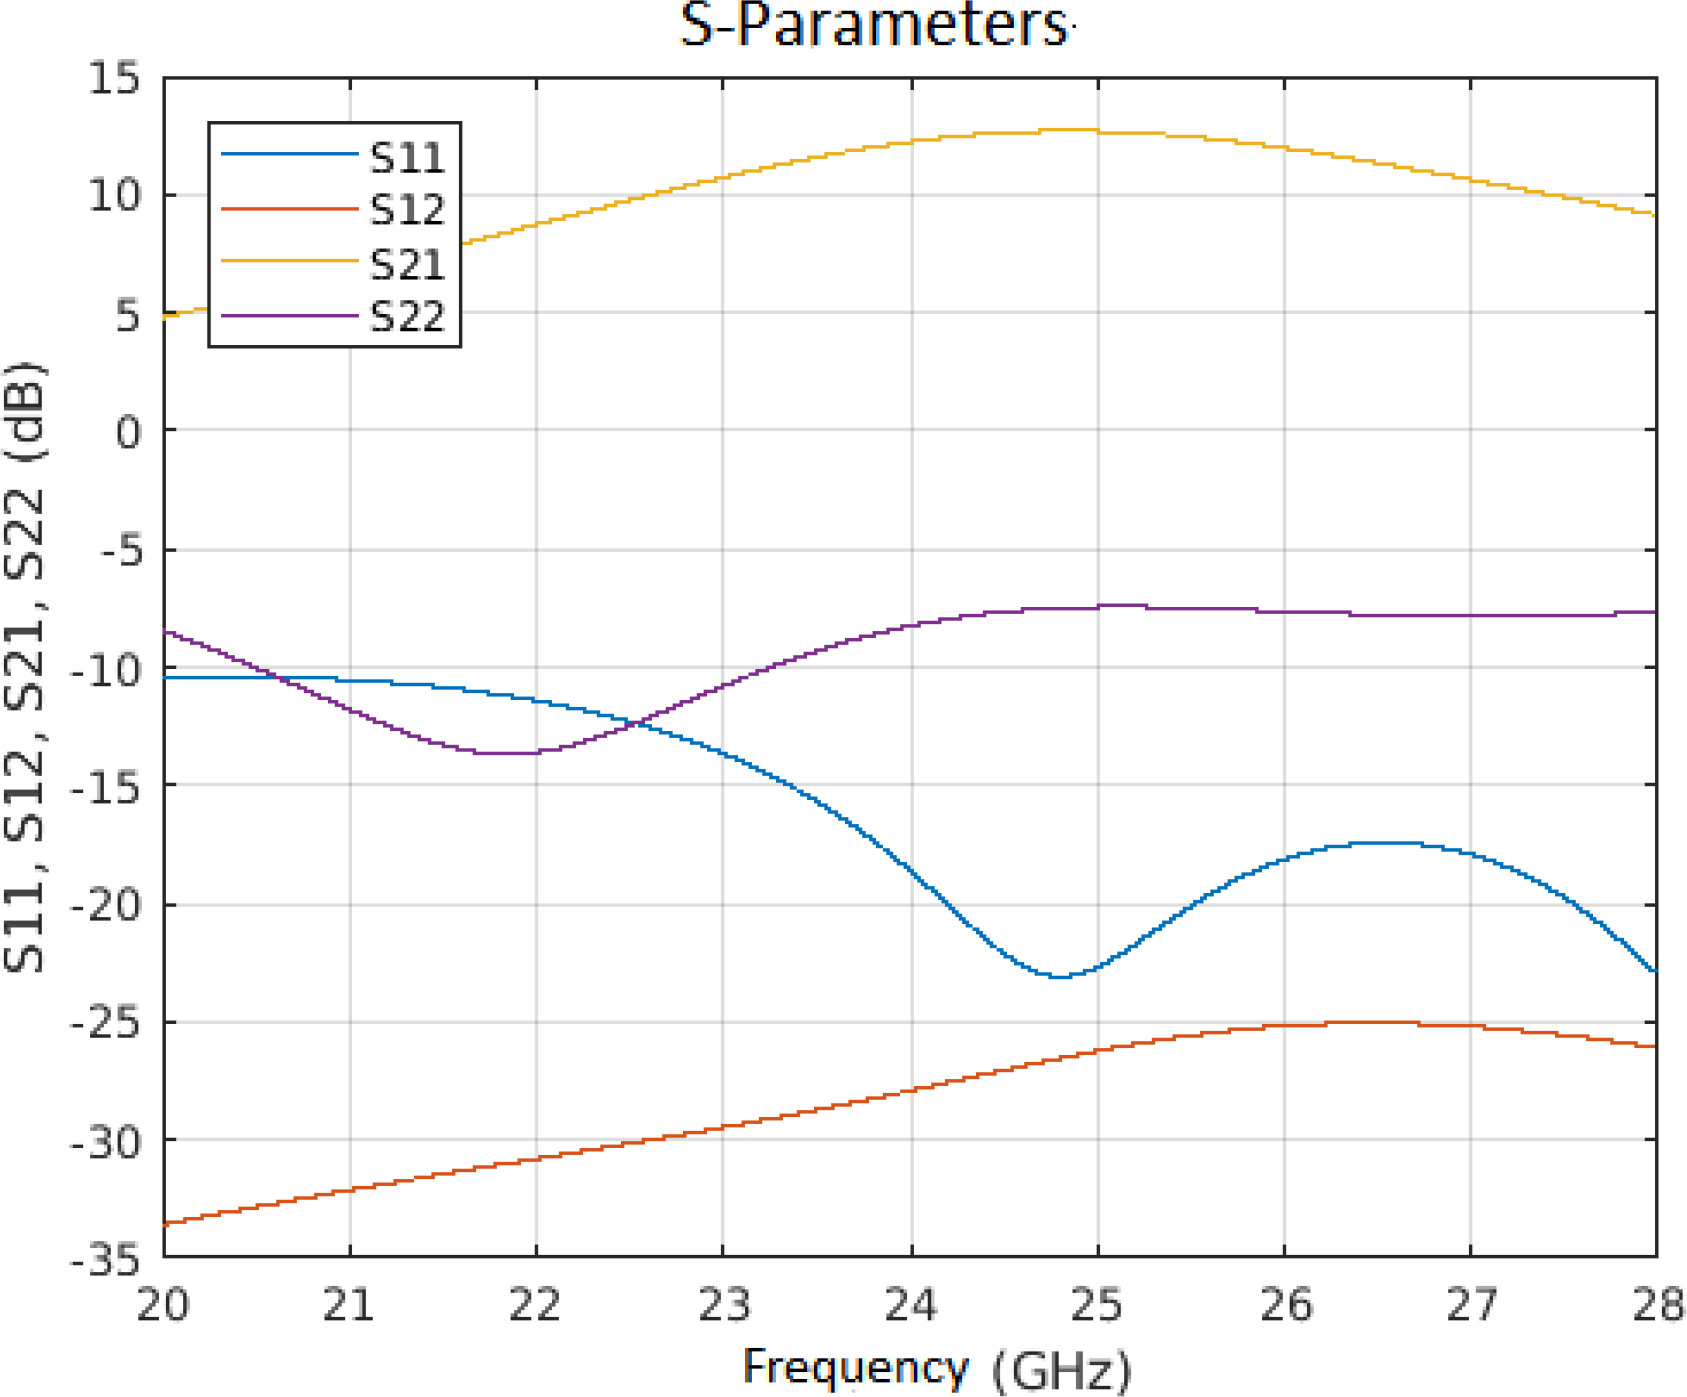
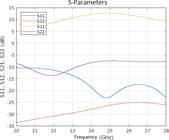
The DPA has a Psat equal to 22.2 dBm and an OCP1 equal to 17 dBm. The PAE has a peak value of 23.76%, while its value in the 6 dB OBO region, considering OCP1 as reference, is approximately 12.6%. Figure 6 exhibits the scattering parameters as a function of the frequency. It also contains the reverse gain (S12) and output isolation (S22). The simulated gain parameter S21 is equal to 12 dB at frequency of 26 GHz. For S11, it is noticed that a good input matching is done considering the low value of presented at the desired frequency, meaning that the circuit is less likely to reflect signals from its output.
Envelope simulations were done for a 5G NR signal with 16, 64 and 256QAM schemes and 50/100 MHz bandwidth. Table 2 shows the results for EVM and ACPR, measured for an output power of 10 dBm. According to Table 1, only the operation with 256 QAM signals does not achieve the required specifications, as the maximal values for 16/64/256 QAM are -18.1/-21.9/-29.1 dB, respectively. Therefore, linearization is applied to enhance the PA linearity performance for these cases. The average adjacent-channel-power-ratio (ACPRavg) is also presented to compare the effect of linearization in this digital metric.
Linearization
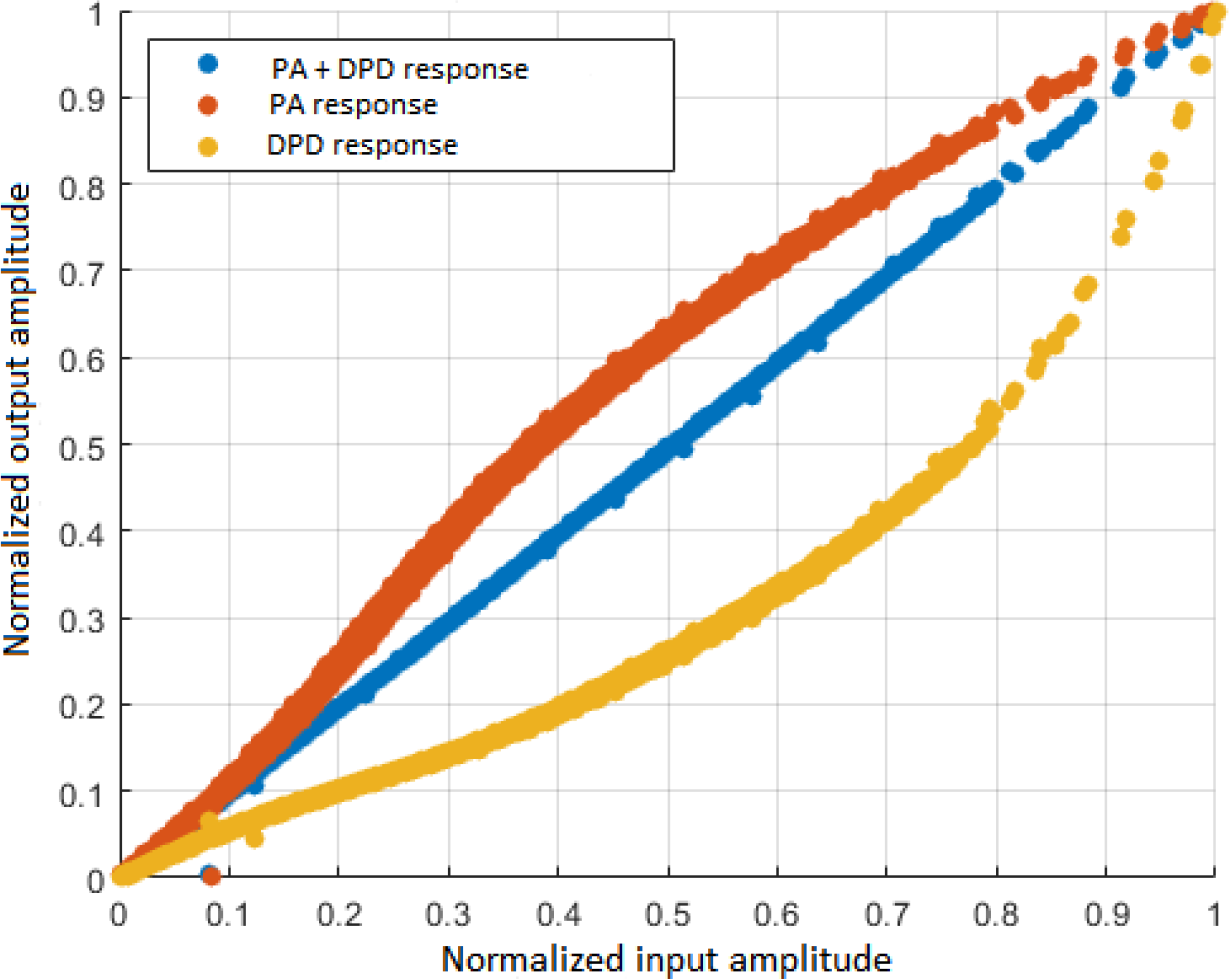
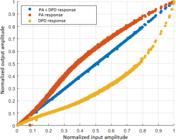
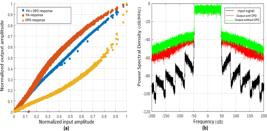
The linearization was applied for a 5G NR 256 QAM signal, considering 50 MHz and 100 MHz as bandwidths. Referring to the 256QAM 50 MHz case, Figure 7 shows the AM-AM curve for PA, DPD and the linearized system containing PA and DPD, considering input and output normalized voltages. The model can account for distortions and memory effects of the circuit, distorting the whole input range and contributing to a better output response. The effect of the DPD in this linearity enhancement is noticed in EVM metric, which improved from -27.86 dB to -46 dB.
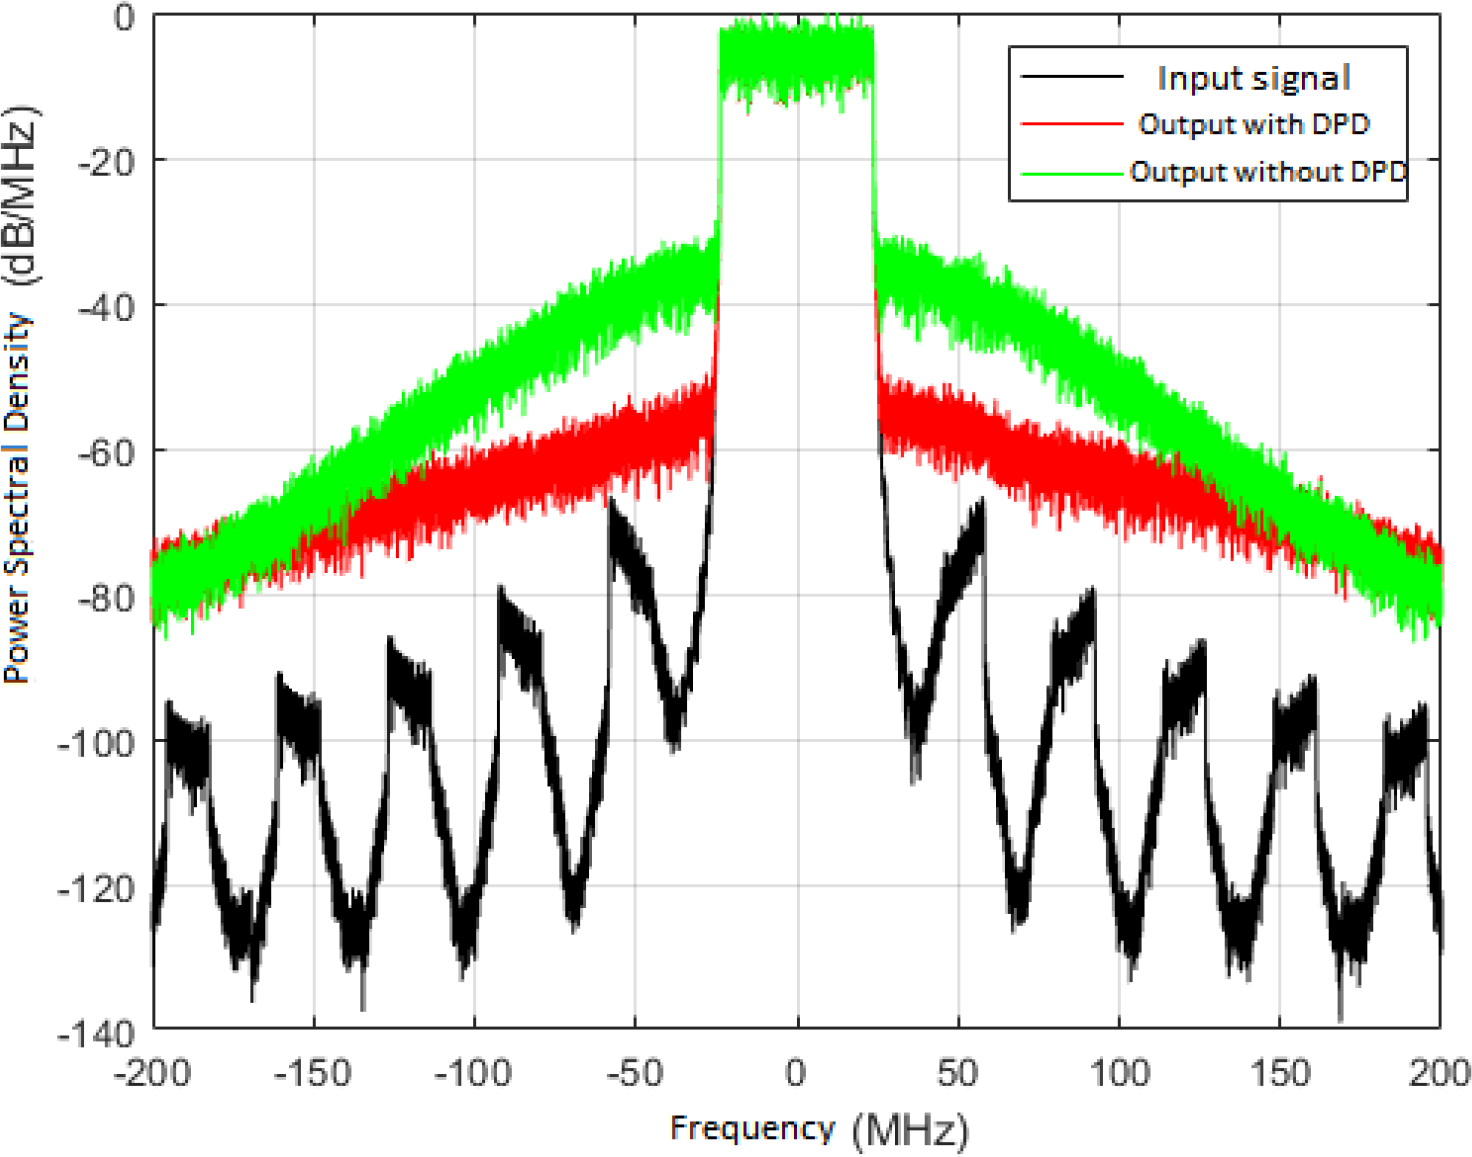
The effect of the DPD can also be noticed in Figure 8, which shows a power spectral density (PSD) as function of the frequency for the input signal, output signal without DPD and with DPD. The linearization improved ACPR from -32.64 dBc to -51 dBc, meaning that transmissions using adjacent channels can achieve better quality. An average output power of 9.7 dBm was obtained with an average PAE of 7.02%.
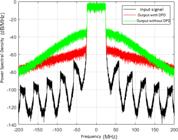
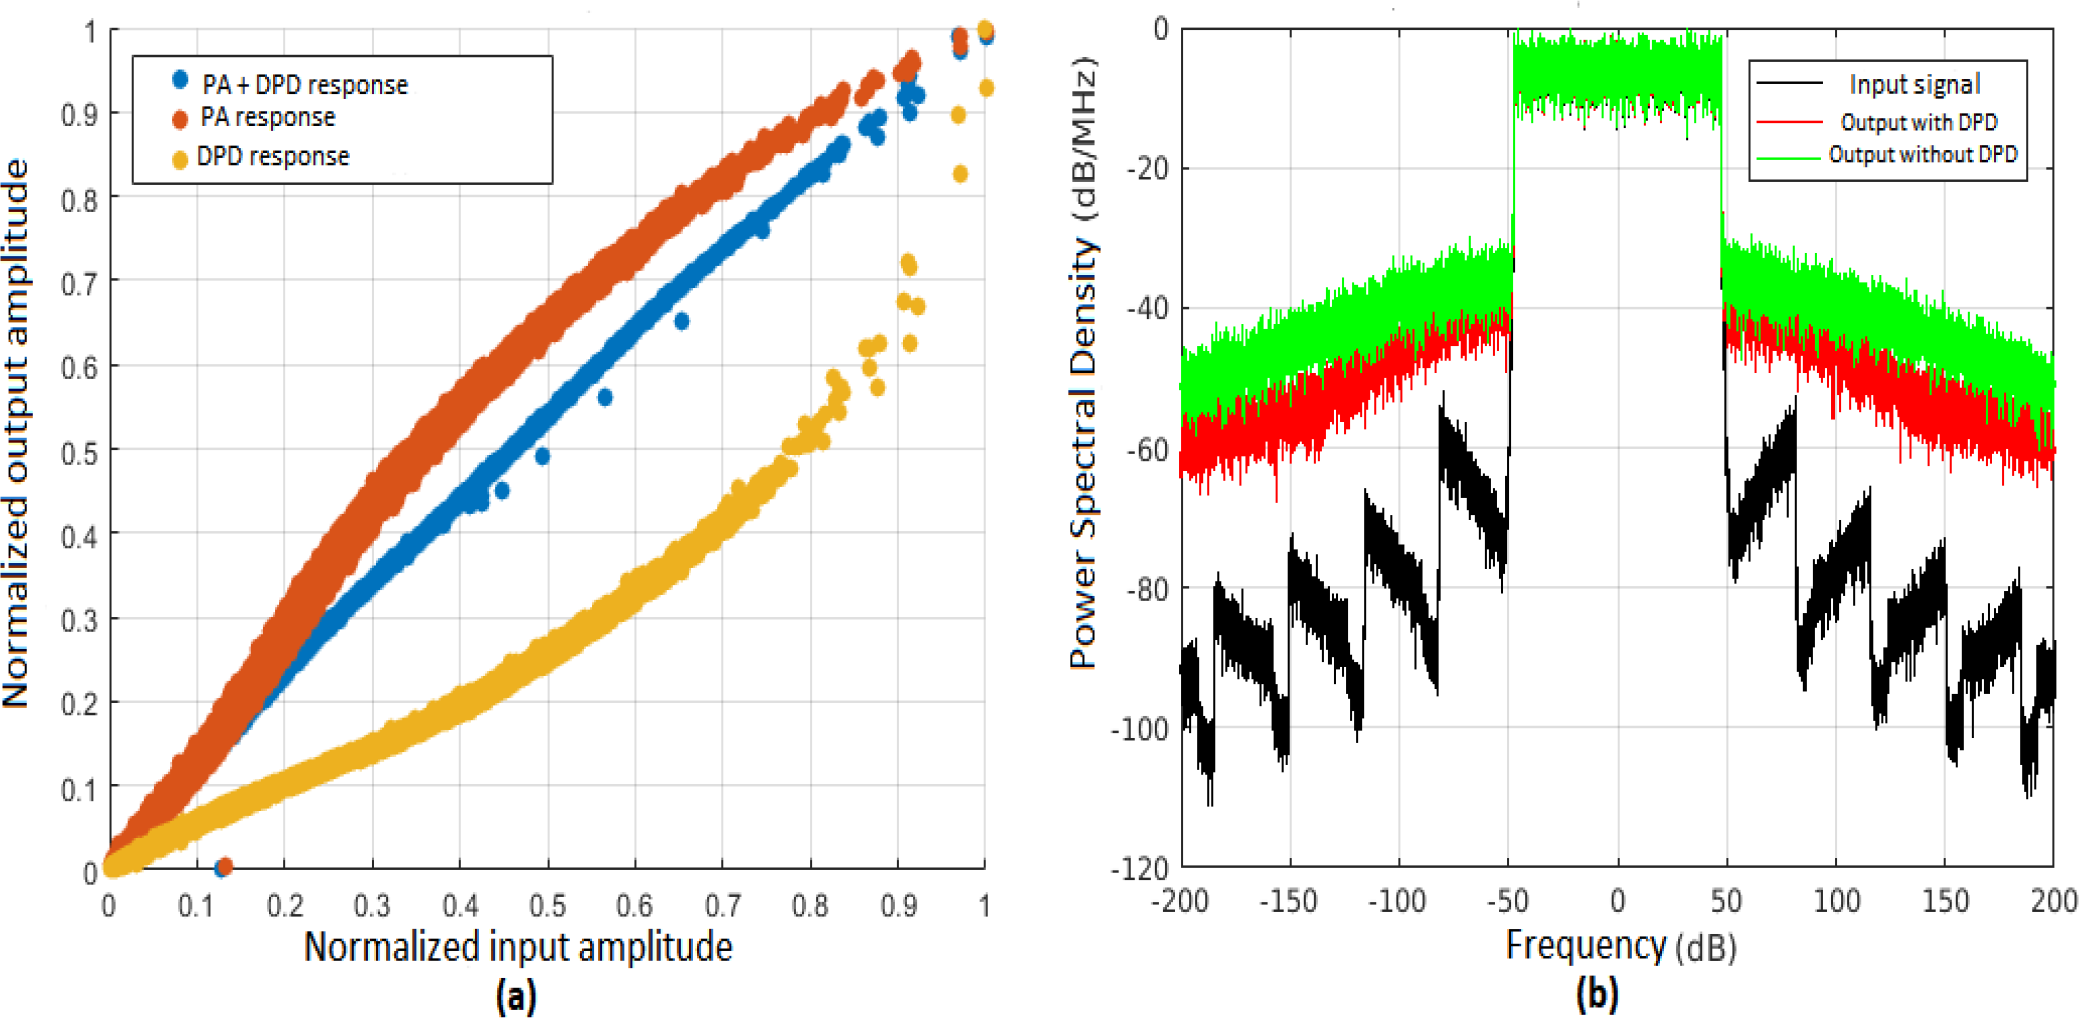
For the 256QAM 100 MHz case, EVM and mean ACPR values improved from -27 dB to -30 dB and -32.72 dBc to -37 dBc, respectively. Figure 9 shows the AM-AM response and the PSD. An average output power of 10.4 dBm was obtained with an average PAE of 8.78%.
A state-of-the-art comparison is made in Table 3 with the simulated results. For the sake of simplicity, only the results for 256QAM are shown in Table 3.
DISCUSSION
As seen in Table 3, the proposed DPA achieved a good linearity performance by having a Psat close to the expected value of 20 dBm in the state-of-art despite the lower value of 12 dB in gain when compared to references [5], [6] and [7]. The DPA is able to stay within the state-of-art performance for EVM and ACPR as the results for 50 MHz and 100 MHz scenarios exhibit values of -46/-30 dB and -51.5/-37 dB, respectively. Average efficiency in 50 MHz and 100 MHz bandwidths are close to the state-of-art as well, showing that the linearization with DPD was essential to enhance the circuit performance.
Regarding DPD performance, the improvement is more significant for the 50 MHz scenario, as the enhancement in EVM and ACPR are close to 20 dB for both metrics, while in the 100 MHz scenario, this enhancement was close to 3 dB for both metrics. Although the MP model has the best complexity-accuracy relationship, its performance may not be satisfactory for increasingly higher band signals [17]. As the signal bandwidth increases, the memory effects associated with the circuit also increase.
Other versions of the MP, with a higher degree of complexity, such as generalized MP or advanced MP, can model memory effects in a more consistent way, contributing to improving the performance of the linearizer in the system [18].
For future works, a study on the use of integrated transformers is recommended, since its use enhances the bandwidth and reduces area occupation of the circuit, when compared with the use of TLs designed from passive components. Also, a layout design is intended.
It is expected to extend the analysis of the DPA performance for simulations with higher bandwidths signals, such as 200 MHz and 400 MHz. A comparison of advanced versions of the MP model on DPD performance is intended as well.
In the possibility of taking measurements of a prototype of the circuit elaborated in the present work, the hypothesis is that the DPD would be an indispensable technique to enhance DPA performance in order to be consistent with other works in the literature, having the potential to demonstrate in a more objective way that its application is capable of bringing a circuit without analog enhancements into compliance with state-of-the-art performance expectations.
CONCLUSION
This work proposed a DPD application methodology based on an iteration between SpectreRF and MATLAB. For this purpose, a Doherty PA circuit was designed in a 45 nm CMOS technology, operating at 26 GHz. The DPA achieved a saturation power value of 22.2 dBm, a peak PAE of 23.76%, and 12.6% in the 6 dB OBO region. Envelope simulations were performed using 5G NR signals with 50 MHz and 100 MHz bandwidths. According to the EVM reference values in [12], the 16 and 64 QAM schemes met the regulations, while the 256 QAM scheme did not comply with the maximum values for the 50 MHz and 100 MHz bandwidths.
To meet the regulations, linearization was applied to the PA. Using indirect learning method and the memory polynomial model, the PA was able to improve its EVM metrics from -27 dBm to -46 dBm and from -27 dBm to -30 dBm for the 50 MHz and 100 MHz 5G NR 256QAM signals, respectively.
Future works are related to extending the analysis of the performance for larger bandwidths, to design a layout and to study the impact of different models for DPD application performance.
-
Funding:
This study was financed in part by the Coordenação de Aperfeiçoamento de Pessoal de Nível Superior - Brasil (CAPES) - Finance Code 001, and by Conselho Nacional de Desenvolvimento Científico e Tecnológico (CNPq), grant number [310783/2023-2].
Acknowledgments:
The authors would like to thank Fundação Coordenação de Aperfeiçoamento de Pessoal de Nível Superior (CAPES) and Conselho Nacional de Desenvolvimento Científico e Tecnológico (CNPq) for their financial support.
REFERENCES
- 1 Mendes LL, Moreno CS, Marquezini MV, Cavalcante AM, Neuhaus P, Seki J, et al. Enhanced Remote Areas Communications: The Missing Scenario for 5G and Beyond 5G Networks. IEEE Access. 2020. 8:219859-80.
- 2 Li Y, Bakkaloglu B, Chakrabarti C. A System Level Energy Model and Energy-Quality Evaluation for Integrated Transceiver Front-Ends. IEEE Trans Very Large Scale Integr (VLSI) Syst. 2007 Jan. 15(1):90-103.
- 3 Vasjanov A, Barzdenas V. A Review of Advanced CMOS RF Power Amplifier Architecture Trends for Low Power 5G Wireless Networks. Electronics. 2018 Oct. 7(11):271.
- 4 Schuartz L, Freire LBC, Hara AT, Mariano AA, Leite B, Lima EG. Modified indirect learning applied to neural network-based pre-distortion of a concurrent dual-band CMOS power amplifier. 2021. Analog Integrated Circuit Signal Process. 106: 277-92.
- 5 Rostomyan N, Özen M, Asbeck P. 28 GHz Doherty Power Amplifier in CMOS SOI With 28% Back-Off PAE. IEEE Microwave Wirel. Compon. Lett. 2018 March. 28(5): 446-8
- 6 Zong Z, Tang X, Khalaf K, Yan D, Mangraviti G, Nguyen J. A 28-GHz SOI-CMOS Doherty Power Amplifier With a Compact Transformer-Based Output Combiner. IEEE Trans Microwave Theory Tech. 2021 June.69(6):2795-808.
- 7 Fang X, Xia J, Boumaiza S. A 28-GHz Beamforming Doherty Power Amplifier With Enhanced AM-PM Characteristic. IEEE Trans Microwave Theory Tech. 2020 July. 68(7): 3017-27.
- 8 Razavi B. Radiofrequency Microelectronics. 2nd ed. Pearson; 2011. p 71-75 and 751-758.
- 9 Ruiz HS, Pérez RB. Linear CMOS RF Power Amplifiers. 1st ed. New York: Springer; 2014. p 11-24, p 29-42, p 75-78, p 87-88
- 10 Cripps SC. Advanced Techniques in RF Power Amplifier Design. 1st ed. Artech House; 2002. p 39-46, p 401-410
- 11 Sedra AS, Smith KC, Carusone TC, Gaudet V. Microelectronics. 8th ed. Oxford University Press; 2019; 912-22.
- 12 ETSI. 3GPP TS 38.101-2 V16.4.0 (2020-06): User equipment (UE) radio transmission and reception (Release 16). ETSI. 2020.
- 13 Doherty WH. A New High Efficiency Power Amplifier for Modulated Waves. Proc IRE. 1936 Sept. 24(9): 1163-82.
- 14 Pedro JC, Root DE, Xu J, Nunes LC. Nonlinear Circuit Simulation and Modeling: Fundamentals for Microwave Design. 1st ed. Cambridge: Cambridge University Press; 2018.
- 15 Borel A, Barzdenas V, Vasjanov A. Linearization as a Solution for Power Amplifier Imperfections: A Review of Methods. Electronics. 2021 May;10(9):1073.
- 16 Lima EG. Behavioral Modeling and Digital Base-band Predistortion of RF Power Amplifiers [thesis]. Torino (PIE): Polytechnic University of Turin; 2009.
- 17 Isaksson M, Wisell D, Rönnow D. A Comparative Analysis of Behavioral Models for RF Power Amplifiers. IEEE Trans Microwave Theory Tech. 2006 Jan. 54(1):348-59.
- 18 Tehrani AS, Cao H, Afsardoost S, Eriksson T, Isaksson M, Fager C. A comparative Analysis of Complexity/Accuracy Tradeoff in PA Behavioral Models. IEEE Trans Microwave Theory Tech. 2010 June. 58(6):1510-20.
-
Editor-in-Chief:
Alexandre Rasi Aoki
-
Associate Editor:
Alexandre Rasi Aoki