 A Framework for Segmenting Filarial Worm in Thick Blood Smear Images Using Morphological Operations
Abstract
Filariasis is a parasitic disease caused by thread-like nematode worms known as filarial worms. This disease is transmitted to humans through bites of infected mosquitoes. Filariasis is a significant public health concern in many tropical and subtropical regions of the world, particularly in Africa, Asia, and the Pacific islands. It causes the clinical disease namely Lymphatic Filariasis that primarily affects the lymphatic system and leads to lymphedema, elephantiasis, and recurrent fever. A global initiative to eradicate lymphatic filariasis as an international health problem has been launched by the World Health Organization (WHO). In this work, the acquired microscopic blood smear images were preprocessed and converted into grayscale images. Further, the images are subjected to morphological operations such as skeletonization, thinning and Euclidean distance transform (EDM) to extract the filarial worms from blood smear images. It is found that the similarity indices between the ground truth and the images segmented using our proposed method were high with an average Dice, Jaccard and Structural Similarity Index Measure (SSIM) of 97.56%, 97.11% and 98.21% respectively. It is observed that the proposed framework accurately segments the worm without losing its proximal and distal portions, despite the presence of artifacts, and variation in shape and size of the worms due to folding or coiling. The automated segmentation of filarial worms is highly desirable for mass screening of lymphatic filariasis, particularly during the pre-elimination phase and in low-endemic situations.
Keywords:
Filarial worms; Lymphatic Filariasis; Microscopic images; Skeletonization; Segmentation.
HIGHLIGHTS
Framework for detecting and segmenting filarial worm in microscopic images.
Identification microfilaria in distorted arrangements such as folding and coiling.
Enables automated segmentation and feature extraction.
Supports mass screening of lymphatic filariasis cases in endemic situations.

INTRODUCTION
People living in tropical and subtropical areas of the world are mostly infected by a collection of infectious diseases known as Neglected Tropical Diseases (NTDs) [1]. NTDs often occur in areas with inadequate sanitation, poor access to healthcare, and limited resources for disease control and prevention. NTDs encompass a wide range of diseases caused by various pathogens, including parasites, bacteria, and viruses. Some common NTDs are Malaria, Dengue, Chagas, Schistosomiasis Leishmaniasis and Lymphatic Filariasis [2]. NTDs affect more than 1 billion people worldwide, with millions of individuals suffering from painful symptoms or disabilities. These diseases can lead to significant economic and social burdens in affected communities [3]. Mortality in falciparum malaria and dengue among children, disfigurement /disability in filariasis and travellers’ risk in soil helminthics are also the major public health concerns.
Filariasis is a parasitic infection caused by thread-like filarial worms that are transmitted through the bite of Microfilariae infected mosquitoes [4]. Filariasis leads to chronic conditions, such as lymphedema elephantiasis and hydrocele (swelling of the scrotum). Patients often require ongoing medical care, which can include surgeries, medications, and rehabilitation. The primary way to prevent and control filariasis is through early detection of the infection and recommended strategy to prevent the disfigurement/disability is the detection at early stage of the disease [5]. Early detection of the infection to prevent the transmission is performed by examining the stained blood smears that identifies the presence of microfilariae, the larvae of the filarial worm, in the bloodstream. The microscopy technique is a commonly utilized tool for detecting filarial worms present in blood smears [6] and continue to be the gold standard under the Global elimination programme. Though it is a simple technique, it requires trained technician to examine the blood smears and it is also a time-consuming process. In addition, poor staining, structural differences, looping and coiling cause difficulties in identifying the microfilaria. Image processing techniques have played a significant role in the detection of filarial worms using microscopic techniques in recent years [7]. These techniques utilize the use of digital images of the blood smears, which are then analyzed using a special software that automatically detects and counts the microfilariae. These techniques also have the potential to reduce the workload of laboratory technicians and improve the consistency and reliability of results.
In medical image processing, segmentation plays a vital role in analyzing both normal and pathological conditions by extracting the relevant components from the images [8]. This process divides the image into multiple sections based on pixel intensities. Using segmentation techniques, specific objects within the image were extracted by removing the background noise and artifacts [9]. Segmenting microorganisms in blood smear images has been adopted in several research areas. Separating microfilaria from blood smear images is a difficult process due to artifacts such as scrapes on the glass, variations in lighting, and varied forms and sizes of the filarial worm. There are only a few research studies on the detection and segmentation of microfilaria [10]. Mallawaarachchi and coauthors (2013) [11] created a GUI-based detector for preprocessing, filtering at different thresholds, and binarizing blood smear images to detect microfilariae from thick blood smear images. The authors concluded that microscopic monitoring of microfilaria from peripheral blood smears seems to be valuable if combined with computer-aided diagnostics.
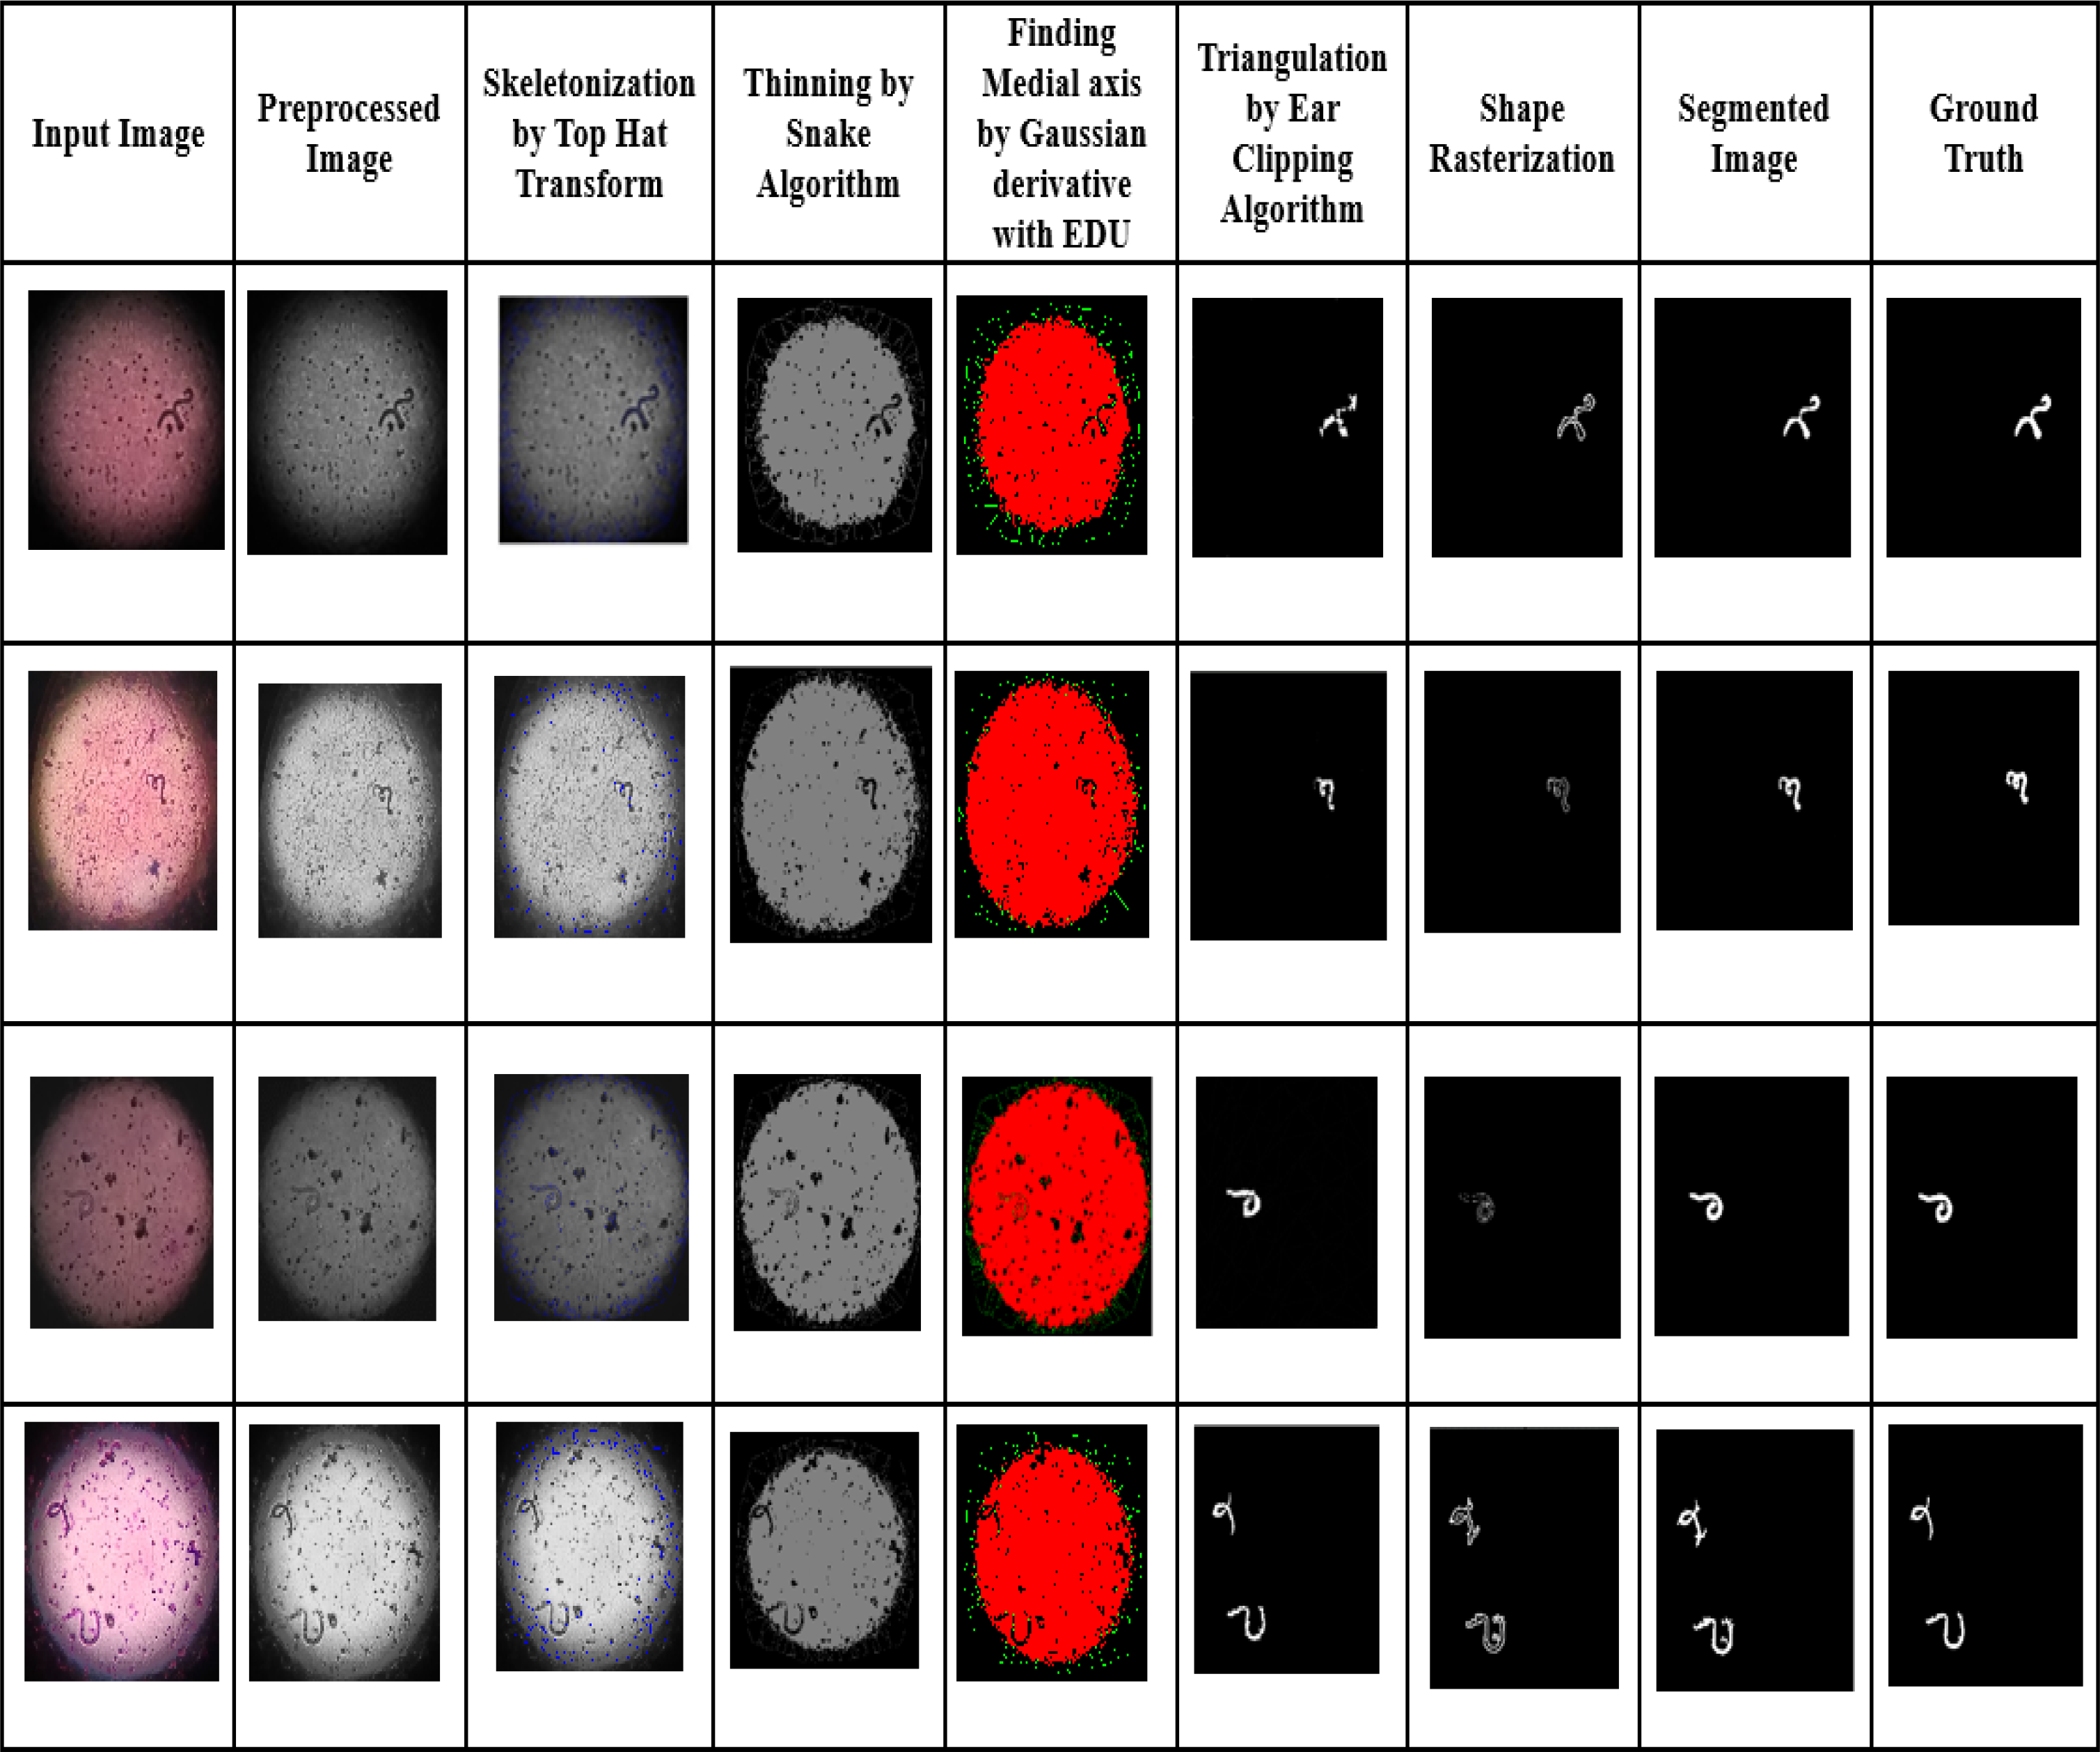
Al-Tam and coauthors (2016) [12] developed a quench-based function for identifying and categorizing the presence of the microfilariae species loiasis produced by deer flies, employing several classifiers in terms of color and shape. The authors suggested two Classifier-SVM to identify objects in both color and grayscale images. Al-Tam and coauthors (2021) [13] created a hessian polar context descriptor to detect different microfilariae species from 2D images. The authors concluded that the proposed descriptor gives the abnormal difference in Hessian-polar context values between the microfilariae and non-microfilariae blood smear images. Ding and coauthors (2018) [14] proposed a local prefitting energy-based active contour model for segmentation. The authors discussed that the proposed method is fast and segments more accurately with less computational cost. Olalla and coauthors (2022) [15] developed an image processing-based classification for elephantiasis patients. The authors classified the filarial and non-filarial patients from the blood sample images. Kumar and Babulal (2023) [16] evaluated the presence of the Lymphatic Filariasis parasite (microfilariae) in blood smears using a stacking classifier and image processing approaches with limited set of images.
The primary objective of this research is to improve the reliability of microfilaria detection in thick stained smears by segmenting the filarial worm from the microscopic images using morphological image processing techniques, without affecting the proximal and distal features.
MATERIAL AND METHODS
The thick blood smears were prepared and stained according to the conventional laboratory diagnostic procedures. Trained medical laboratory technician screened the stained smears to identify microfilaria. The microscopic images are captured using a digital camera and digital smear images are saved after recording the identification numbers. Image preprocessing techniques were adopted to enhance and improve the quality of the microscopic images [17]. The blood smear images are initially resized to 512×512 pixels and then converted to grayscale images to reduce the level of computational complexity. Initially, the blood smear images were filtered using a Hessian matrix-based 2D Jerman filter as proposed by Fan and coauthors (2022) [18]. The main advantage of this filter is to discover the spherical or blob-shaped objects, gradually decreasing the image's saturation from its outer edges toward the center while simultaneously applying a filtering process. Also, bilevel thresholding has been implemented using Renyi’s entropy to the filtered blood smear images as Karmakar and coauthors (2022) [19].
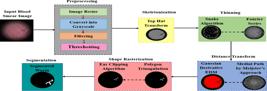
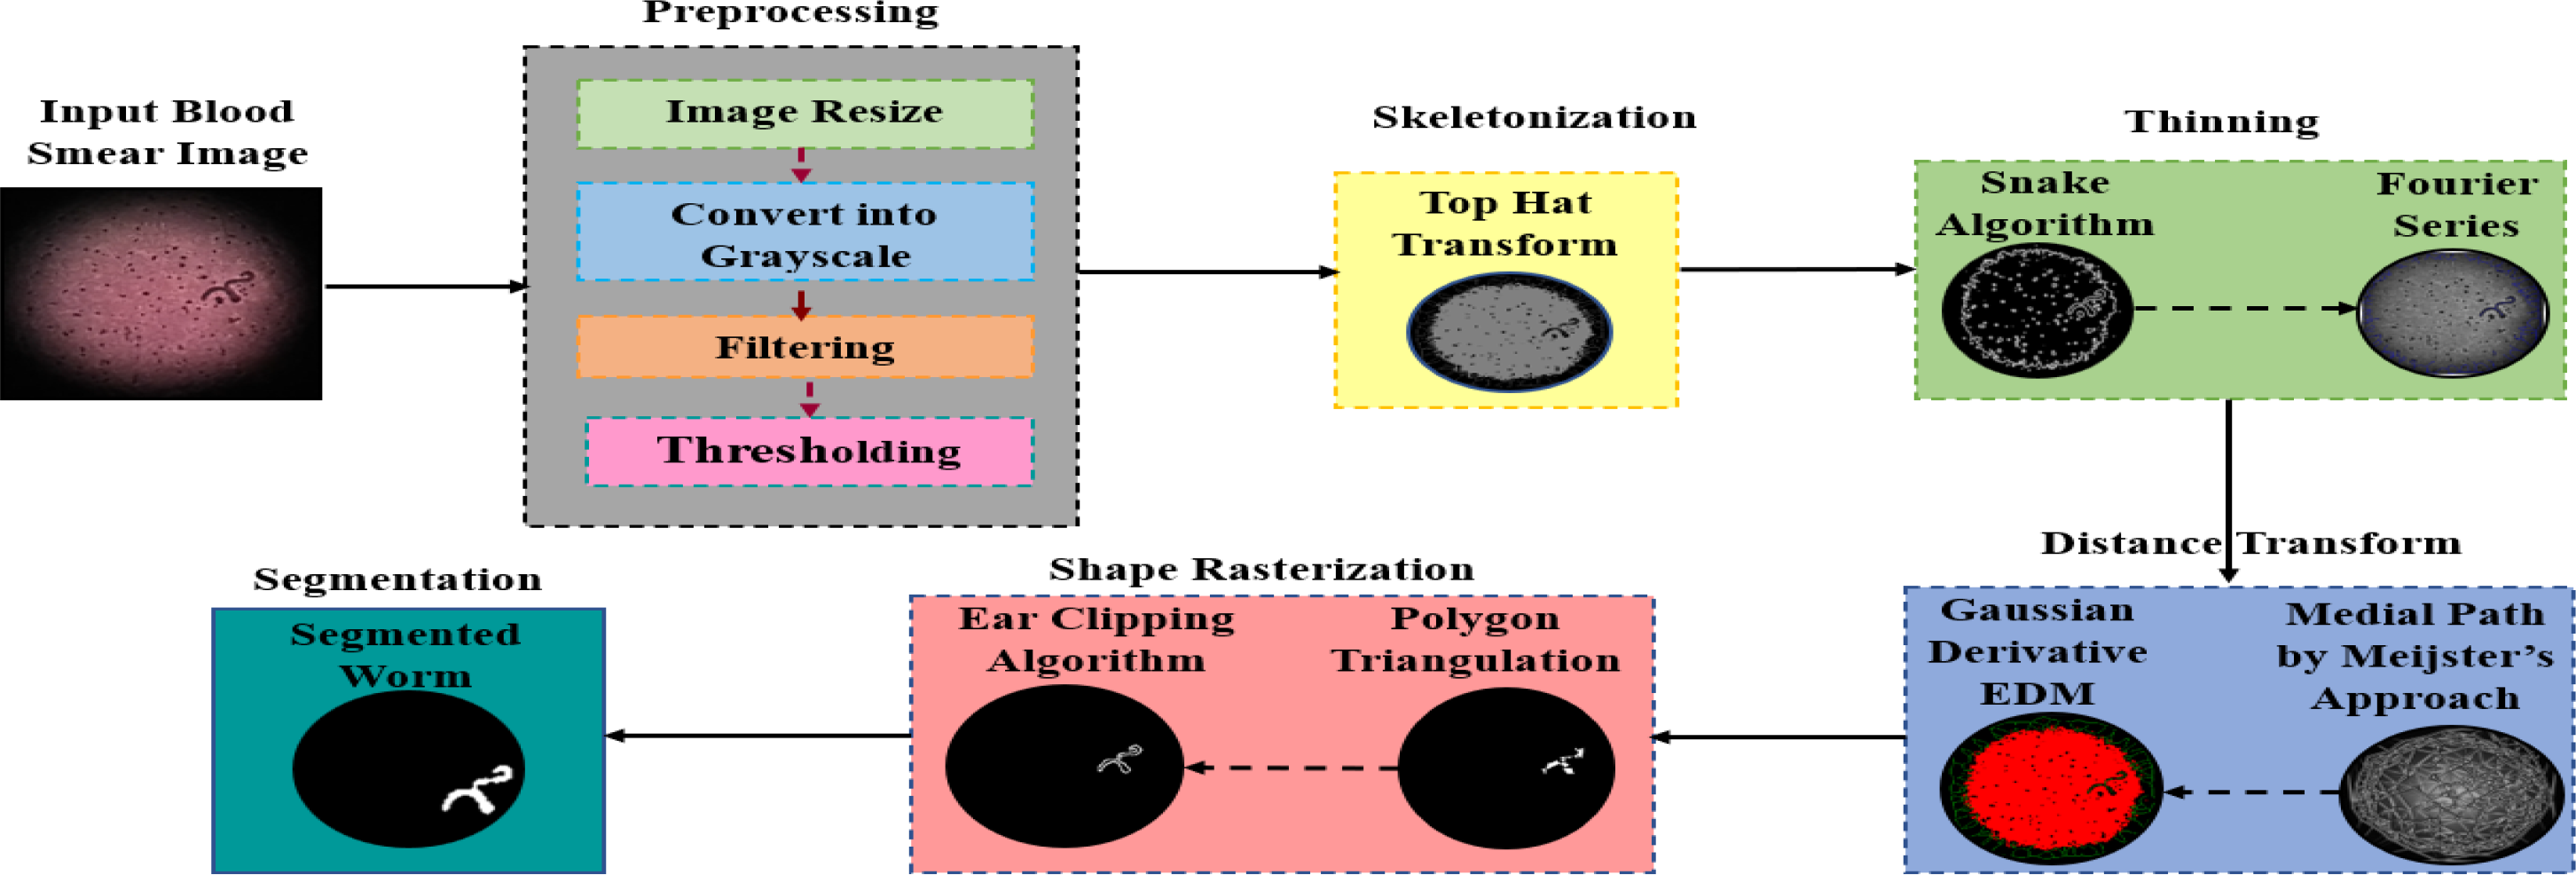
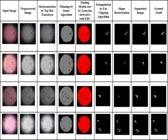
After preprocessing, the images were skeletonized using the top-hat transform [20]. Thinning of the blood smear images was then performed with the snake algorithm and Fourier series [21]. The worm skeleton was subsequently subjected to a distance transform using Meijster’s approach and the Gaussian derivative Euclidean distance method (EDM) [22]. The shape of the worm was obtained using the polygon triangulation technique with the ear clipping algorithm [23]. Finally, the segmented worm was achieved through the shape rasterization technique. The overall block diagram for segmenting W. bancrofti microfilarial worms from blood smear images is shown in Figure 1.
Skeletonization
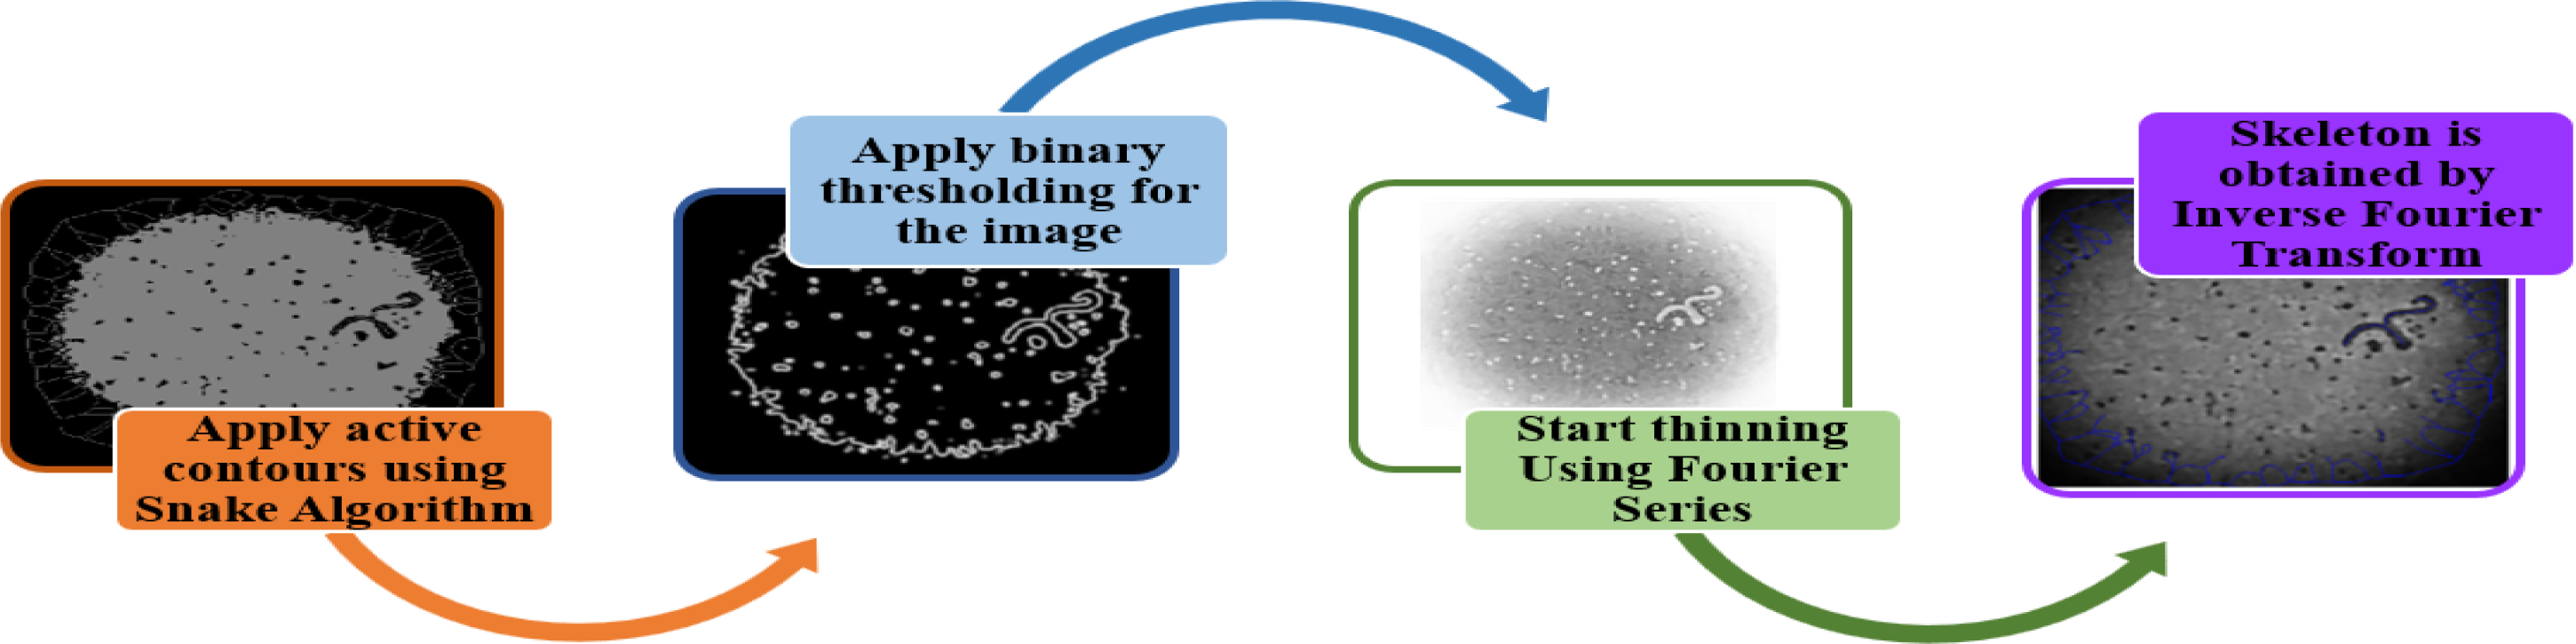
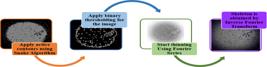
The complex structure of an object was reduced to its essential geometric shape or "skeleton" using Skeletonization [24]. Many different applications, notably shape analysis, pattern recognition, and visual comprehension, frequently utilize the skeletonization process. It reduces the amount of data while preserving important characteristics within the image. Skeletonization can be applied to extract the central axis of blood vessels, bones, or other anatomical structures. Skeletonization using the top-hat transform [20] extracts the skeleton of an object or structure in a binary image. The top-hat transform is a morphological operation that highlights small structures or details in an image that are brighter (or darker) than their surroundings. The top-hat transform is applied to emphasize the lines and ridges within an object. Figure 2 shows the preprocessing of blood smear images subjected to Skeletonization process.

Thinning
Thinning is the part of the skeletonization process that is applied iteratively to reduce the object’s width by preserving its topology [25]. The Snake algorithm, also known as the Active Contour Model is used with Fourier descriptors for thinning the object in an image [24]. Fourier descriptors representing the shape of the initial contour in the frequency domain are calculated with the snake algorithm. In the Snake algorithm, the energy function is made of two components namely internal energy and external energy [21]. The internal energy, also known as the "snake energy," represents the snake's stiffness and smoothness. It is calculated based on the shape of the snake and its desire to be smooth. The external energy is derived from the image data and attracts the snake towards features of interest in the image, such as object boundaries. Fourier descriptors capture the global shape characteristics of the contour [25]. Once the Fourier descriptors indicate significant thinning, stop the snake algorithm and apply some additional thinning post-processing to the contour. Thus, the shape can be retrieved from the Inverse Fourier transform (IFT). Figure 3 shows the thinning of blood smear images using the snake algorithm and Fourier descriptor.
Medial Path
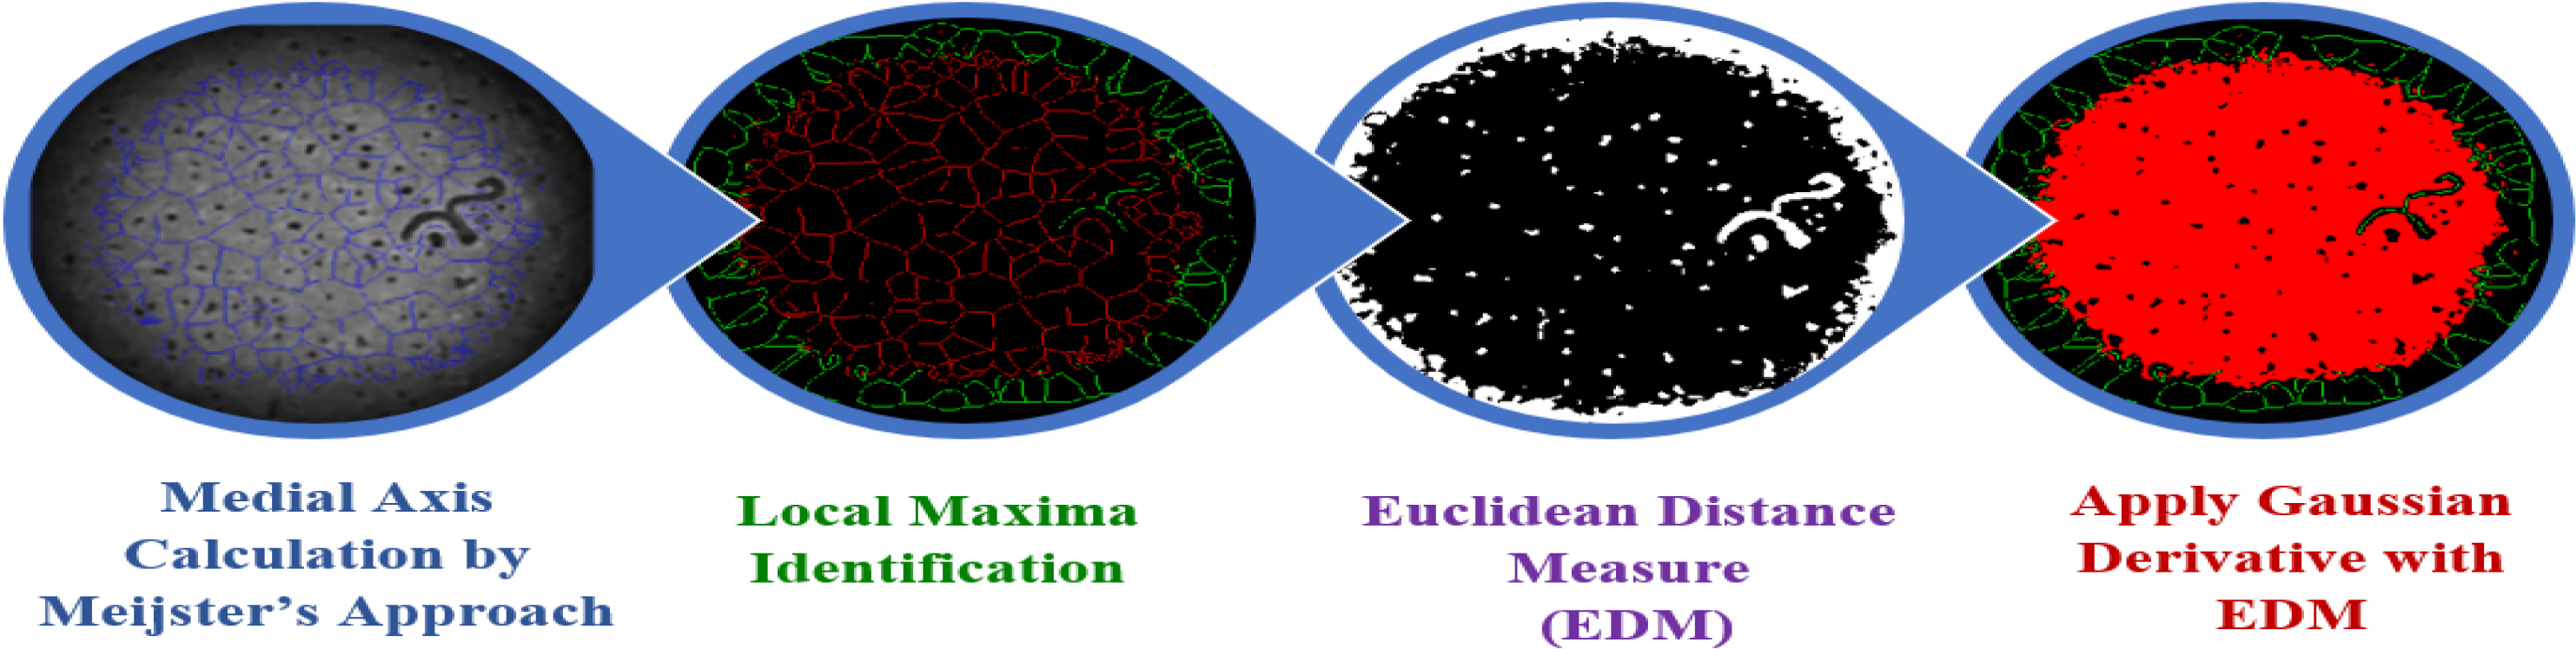
Meijster's approach is used for finding the medial axis or medial path of the worm within the blood smear image. The medial axis is represented by the centerline or skeleton of an object [26]. Meijster's approach is efficient while using morphological operations of image processing techniques. The binary image of blood smear is represented with the object as white (foreground) pixels on a black (background) background. The object should be a single, connected component. The Gaussian distance transform by EDM (Euclidean distance Measure) is calculated for the binary image [27]. The distance transform assigns each pixel in the object a value corresponding to its distance from the nearest background pixel. Local Maxima are identified in the distance transform image. These local maxima represent the points along the medial axis. The medial axis is thinned properly for pruning. This involves iteratively removing pixels from the distance transform image that are not part of the medial axis [27]. The image is thresholded to create a binary representation, where the object of interest is white and the background is black [19]. Thus, pruning examines the neighbouring pixels and their distance values. After pruning, the skeletal points have remained and form the medial axis [25]. These points represent the centerline of the object. The skeletal points were connected to form a skeleton that closely approximates the medial path. Using Meijster's approach [26] the medial axis or medial path of the object was represented as a set of points or a connected curve [28]. Figure 4 shows the overall process of medial axis calculation by Euclidean distance and Gaussian derivative.

Shape Rasterization
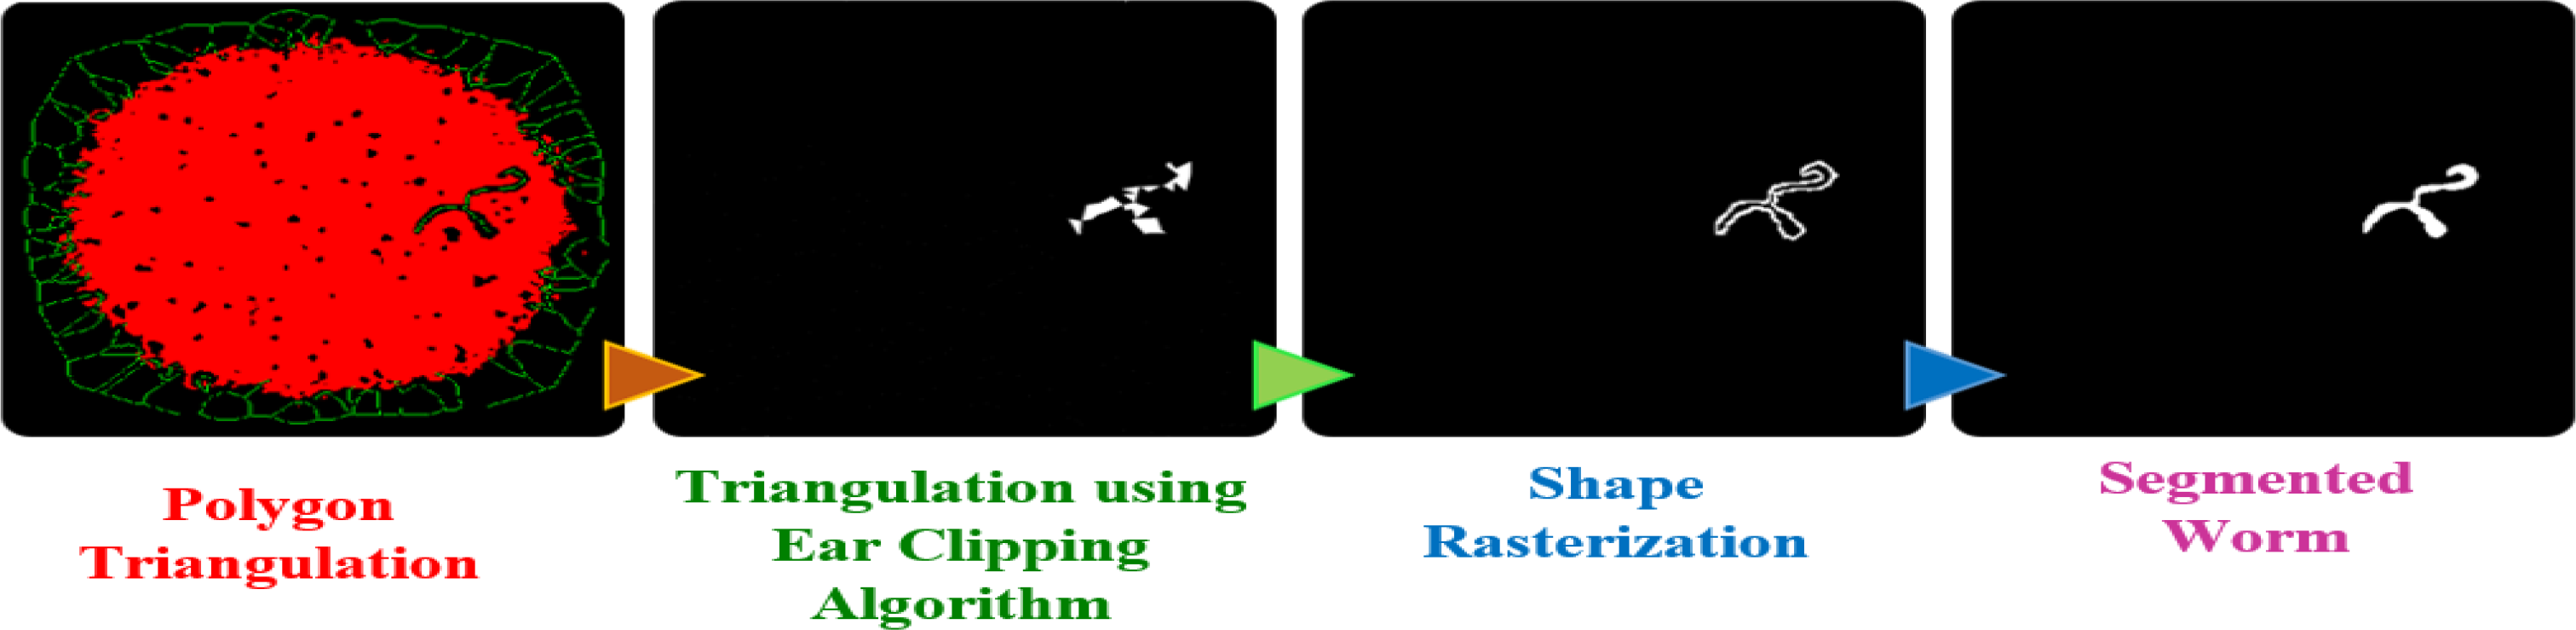
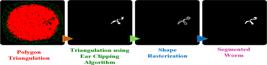
Rasterization is the process of converting vector graphics (described by lines, curves, and shapes) into pixel-based images [29]. While the ear-clipping algorithm is typically used for triangulating polygons and the output of the ear-clipping algorithm is given as input for rasterization. The polygon is triangulated and given as input for the ear clipping algorithm [30]. The algorithm is used to decompose the polygon into triangles by identifying and "clipping" ears (convex vertices) iteratively. This algorithm essentially finds triangles within the polygon [31]. Figure 5 shows the shape rasterization process using the ear clipping algorithm.
Metrics
The microscopic blood smear images are pre-processed to make the images consistent in terms of resolution and format. Identifying and segmenting worms from blood smear images was performed using image processing techniques such as Skeletonization, Thinning, and Medial Axis Transform. From the segmented worms, various geometric features are extracted for detecting the worm shape and size. Features of interest namely edges, corners, blobs, and other distinctive regions were identified within the image to perform segmentation [17]. The geometric measures were calculated to evaluate the worm's shape and structure. The geometric shape feature measurements namely Area, Convex Area, Filled Area, Perimeter, Diameter, Eccentricity, Solidity, Extent, Roundness, and Euler number of all worm images were calculated.
RESULTS
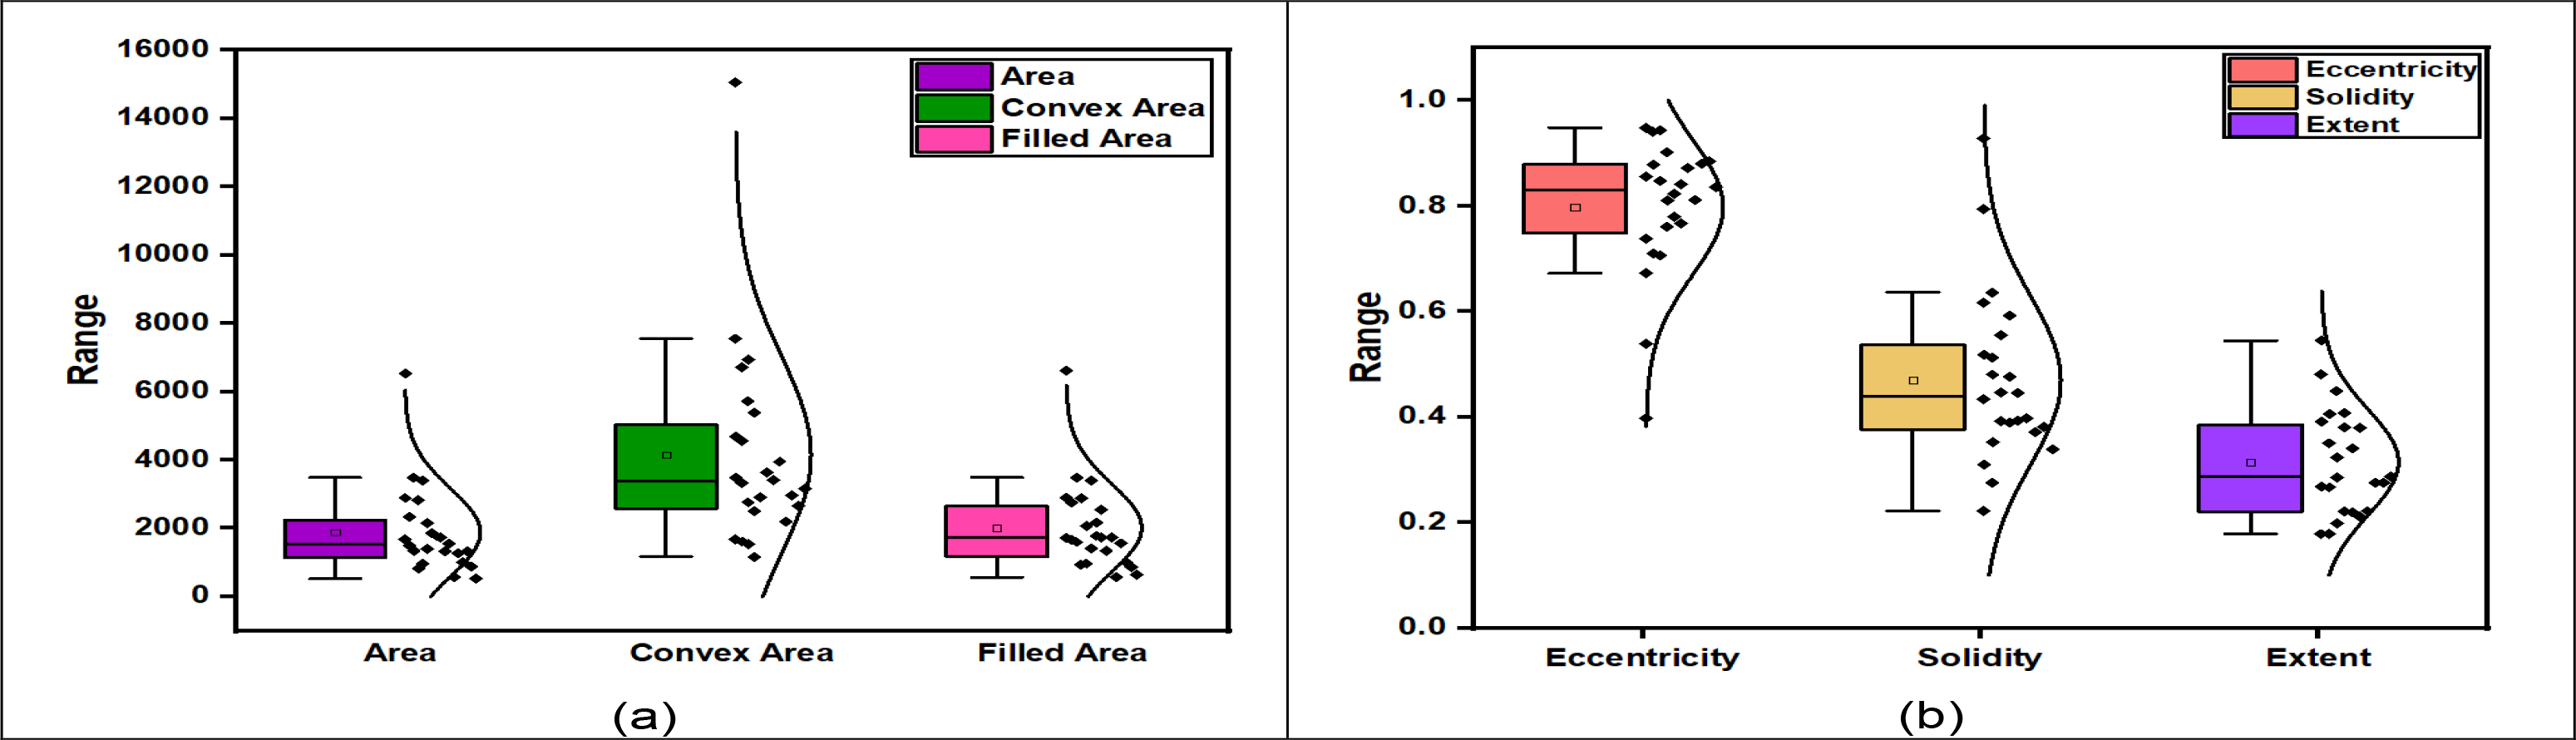
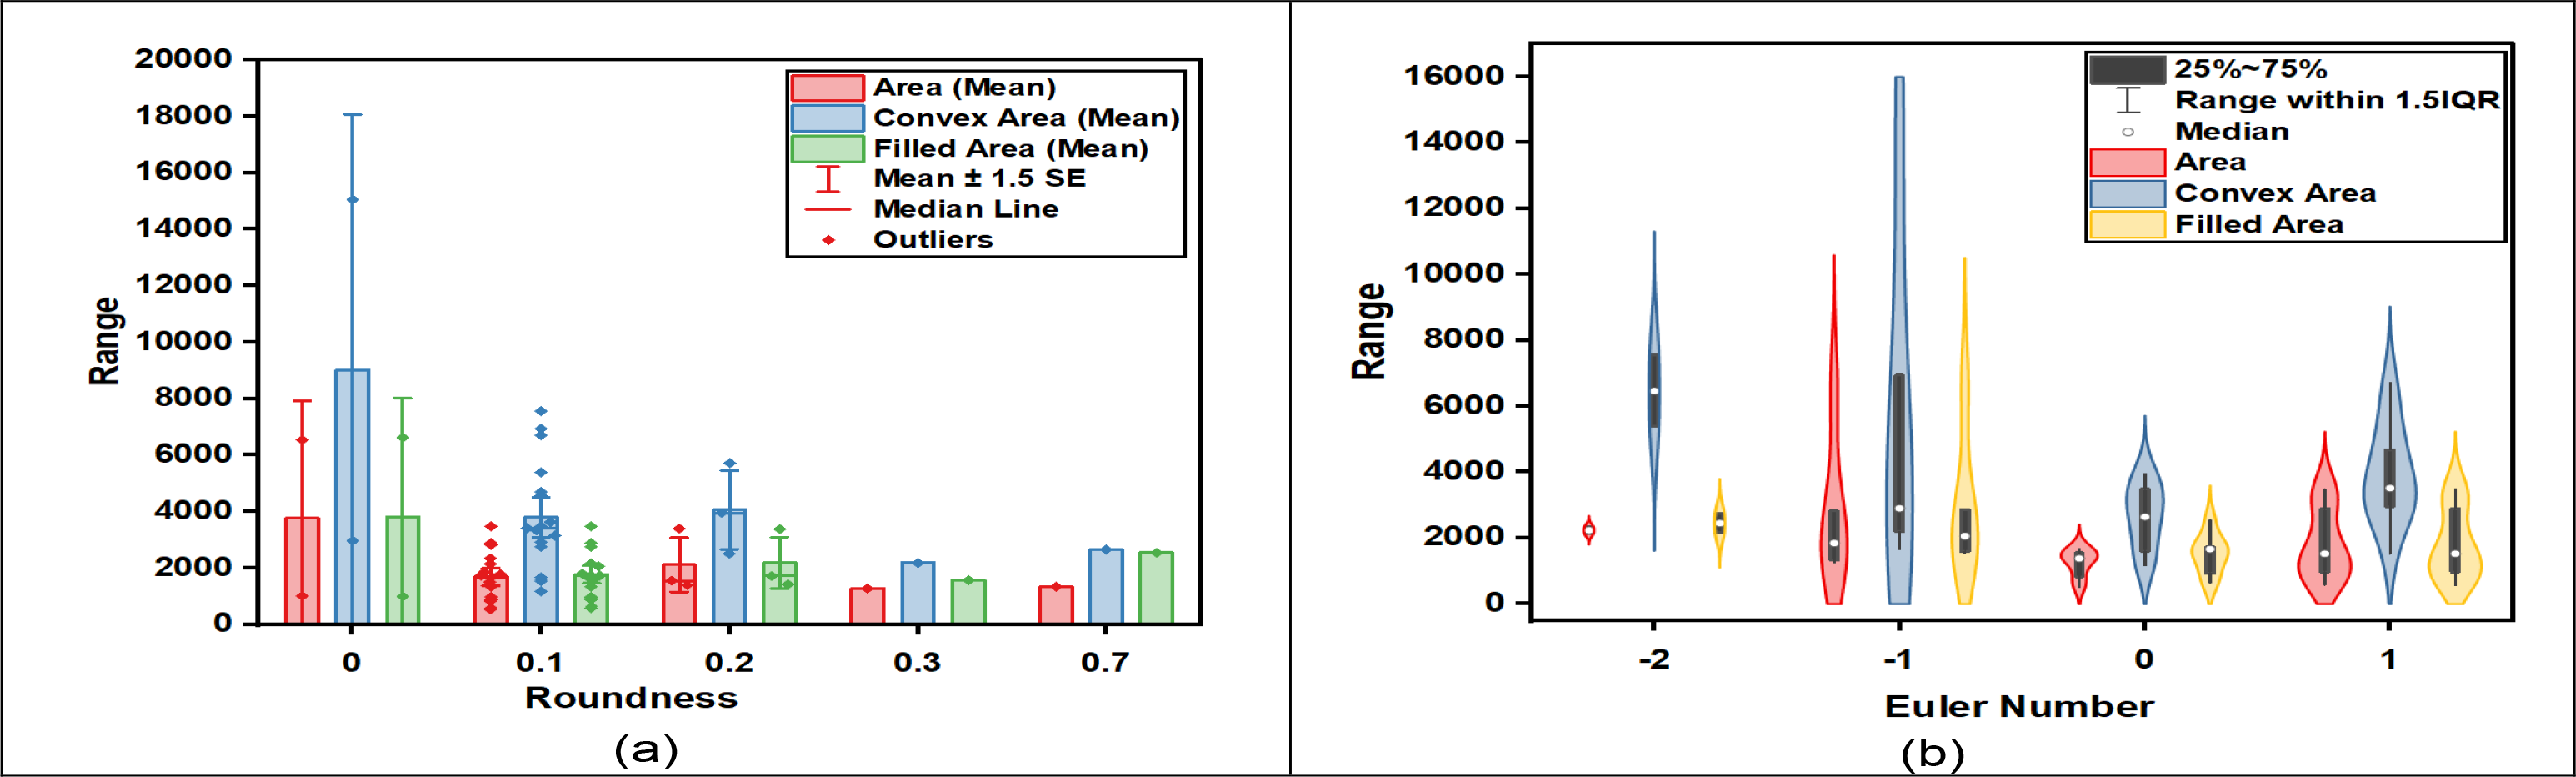
Figure 6(a) shows the grouped bar overlap plot for the geometric features Area, Convex Area, and Filled Area. Figure 6(b) shows the grouped bar overlap plot for Eccentricity, Solidity, and Extent of the worm within the segmented image. Figure 7(a) and 7(b) show the grouped mean bar plot with the median line for Roundness and violin plot for Euler number-based analysis with the geometric shape metrics namely Area, Convex Area, and Filled Area of the worm. Figure 7(a) shows that the value of roundness is between 0 to 1. The value of roundness is between 0 to 0.6 for most of the worms in the image. This shows most worms are coiled in shape and form a circular structure. From Figure 7(b) we infer that worms have an Euler number between -2 to 1. Hence from Euler values, we conclude that the worms segmented by the proposed method are with less holes or no holes.
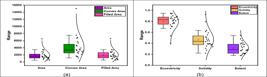
Average Mean ± Standard deviation for thirty worm images (a)Area, Convex Area, and Filled Area values (b)Eccentricity, Solidity, and Extent values
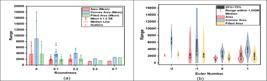
Average Area, Convex Area, and Filled Area values for thirty worm images (a) Roundness (b) Euler number
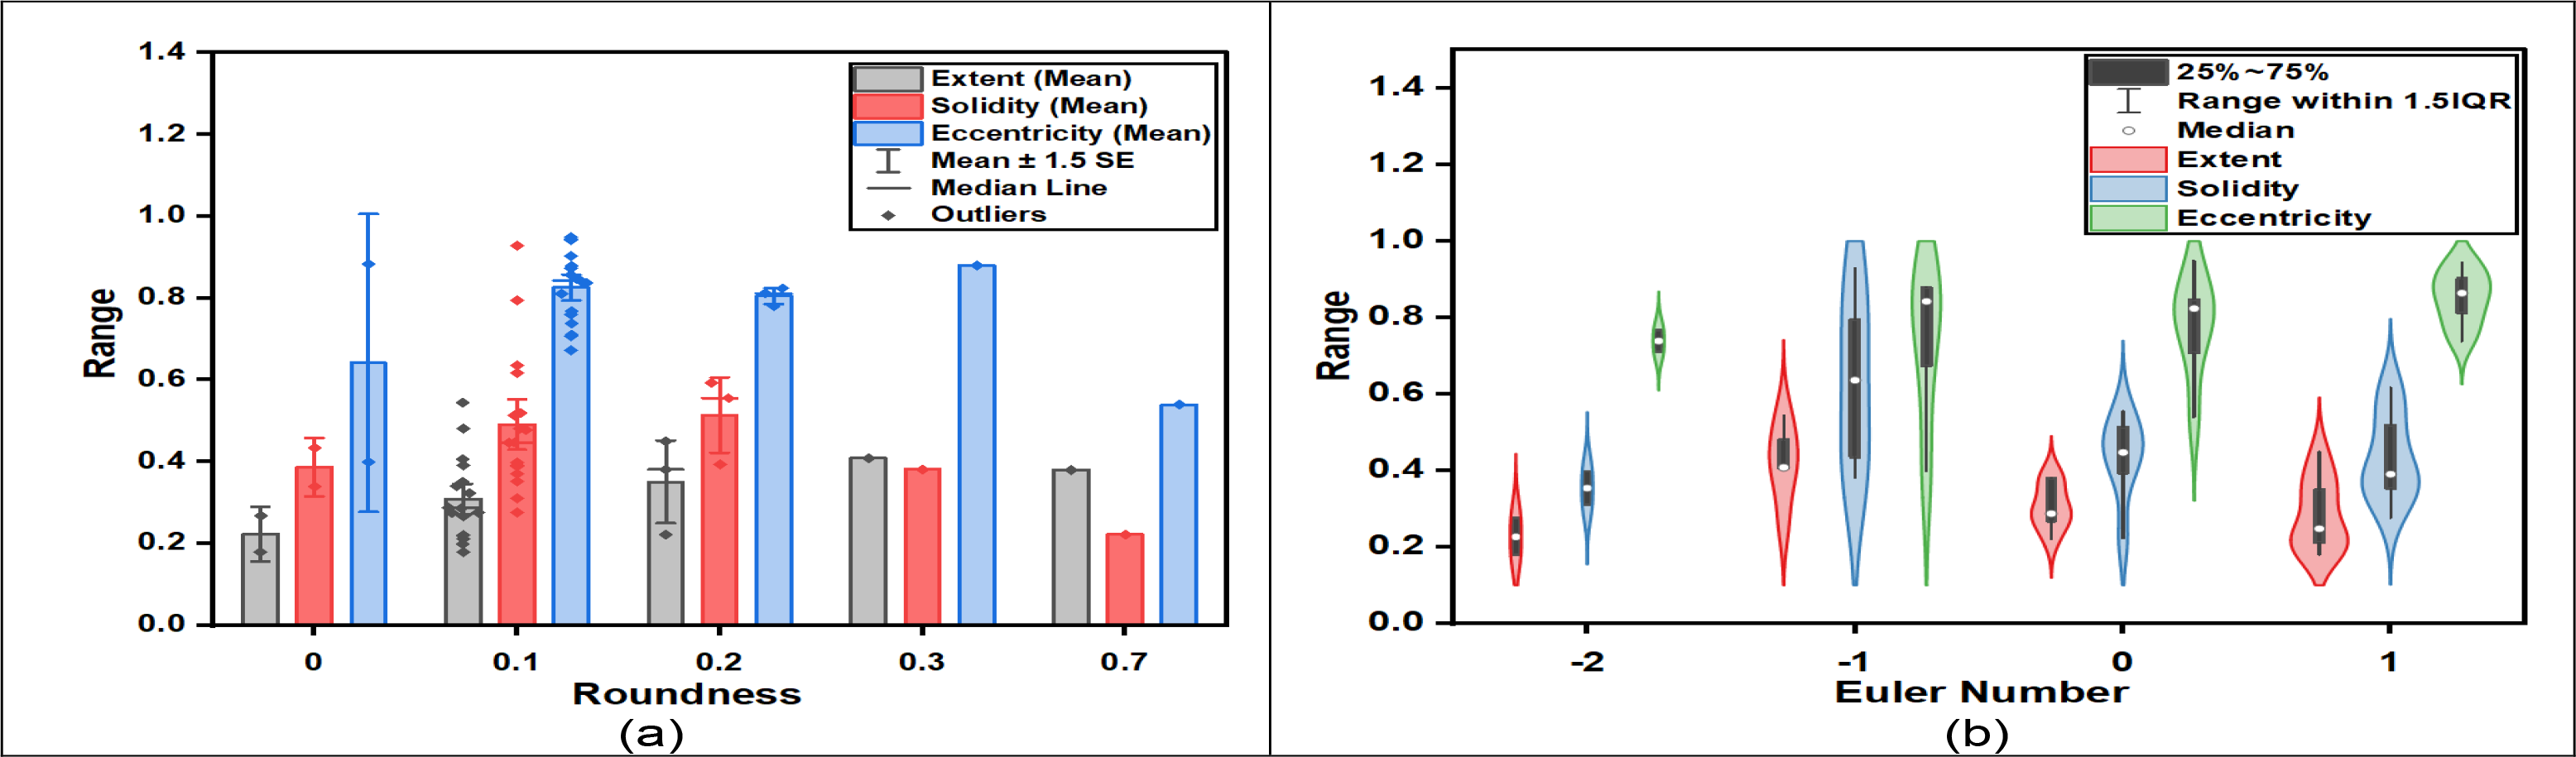
Figure 8(a) and 8(b) show the grouped mean bar plot with the median line for Roundness and violin plot for Euler number-based analysis with the geometric shape metrics namely Eccentricity, Solidity, and Extent of the worms. Figure 8(a) shows the grouped mean bar plot with the median line for Roundness and violin plot for Euler number-based analysis with the geometric shape metrics namely Extent, Solidity, and Eccentricity of the worm. Figure 8(b) shows the Eccentricity values of all worm images is high compared to Solidity and Extent. The worm with eccentricity 0 is a perfect circle in shape, and as the eccentricity value increases, the shape becomes more elongated. The higher the eccentricity and lower the extent values show that the structure of segmented worms was circular or elongated in shape.
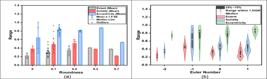
Average Eccentricity, Solidity, and Extent values for thirty worm images (a) Roundness and (b) Euler number
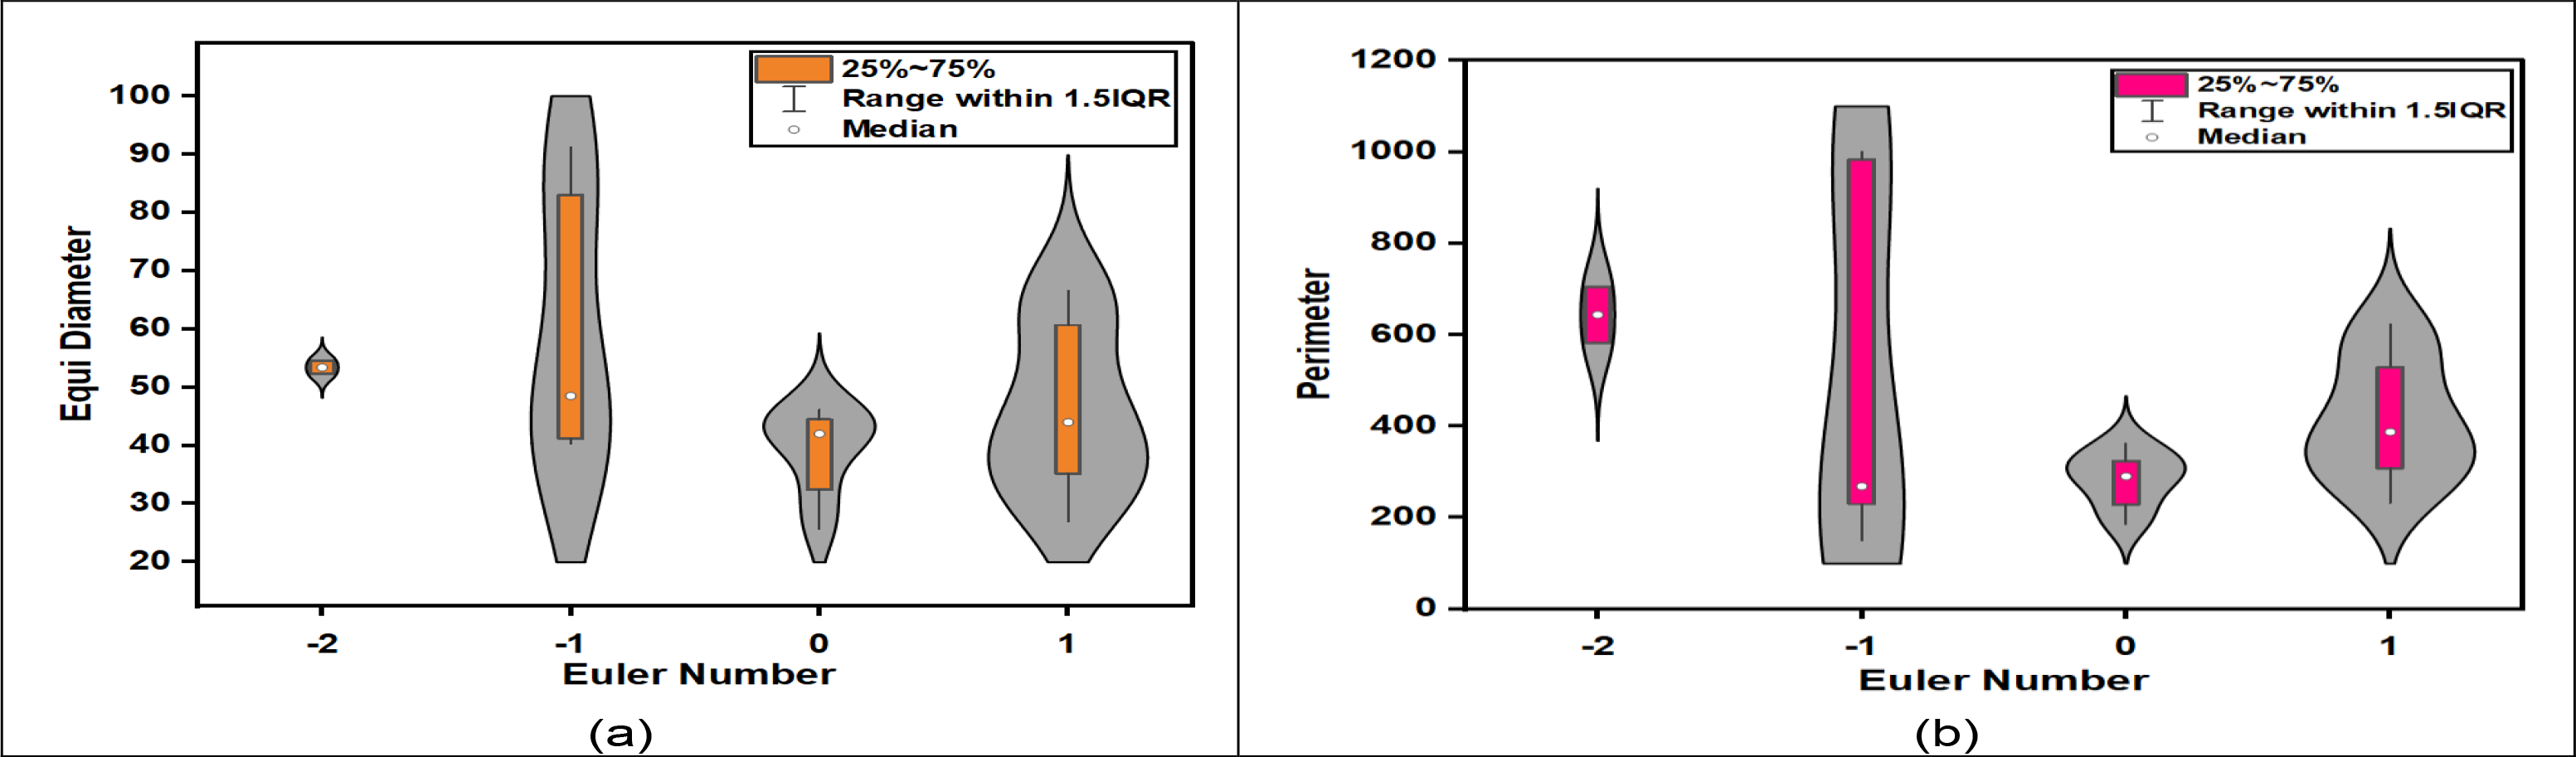
Figure 9 (a) and (b) show the violin plot for Euler number-based analysis for geometric shape metrics Equi Diameter and Perimeter for 30 worm images. From the plot, we infer the Euler number -2 to 1 have worm diameter values ranging from 25 to 90 and perimeter values ranging between 100 to 1100.
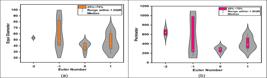
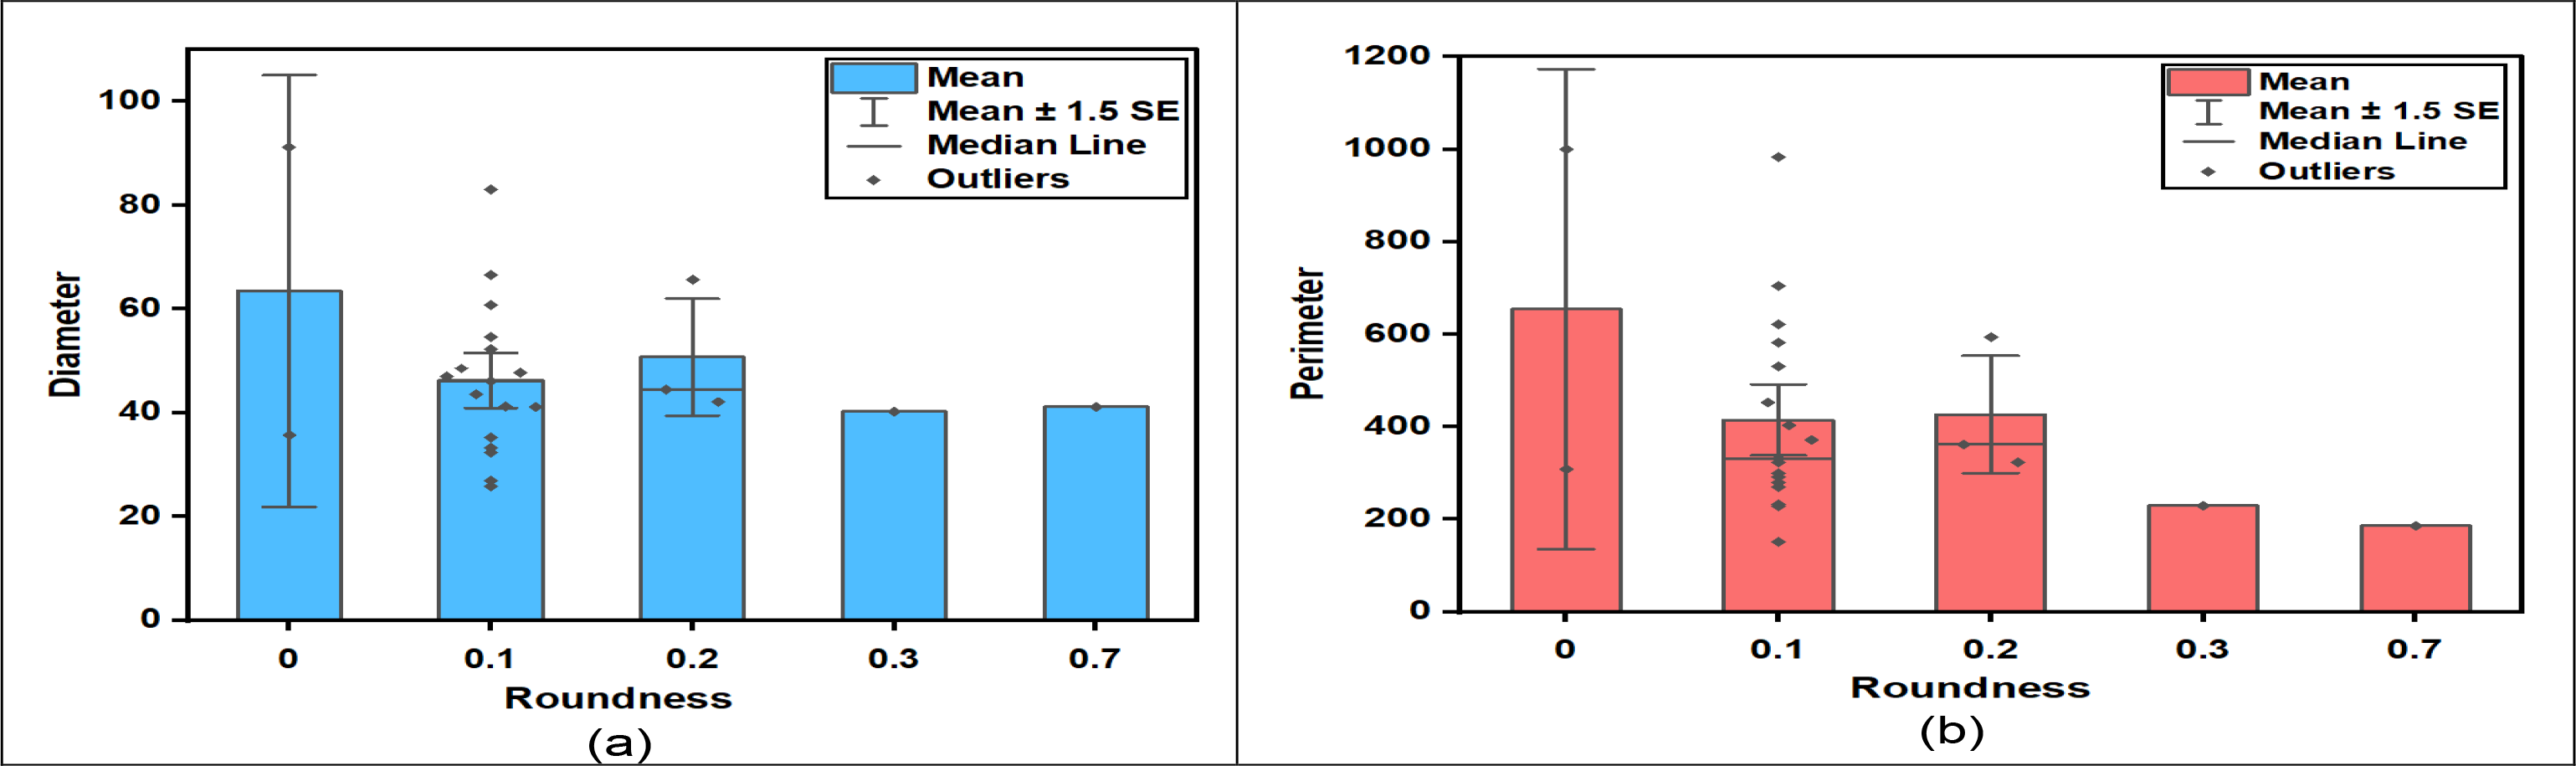
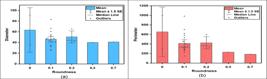
Figure 10 (a) and (b) shows the grouped mean bar plot with the median line for geometric shape metrics Equi Diameter and Perimeter with roundness for 30 worm images. From the plot, we infer that most worms have roundness values ranging between 0.1 to 0.7.
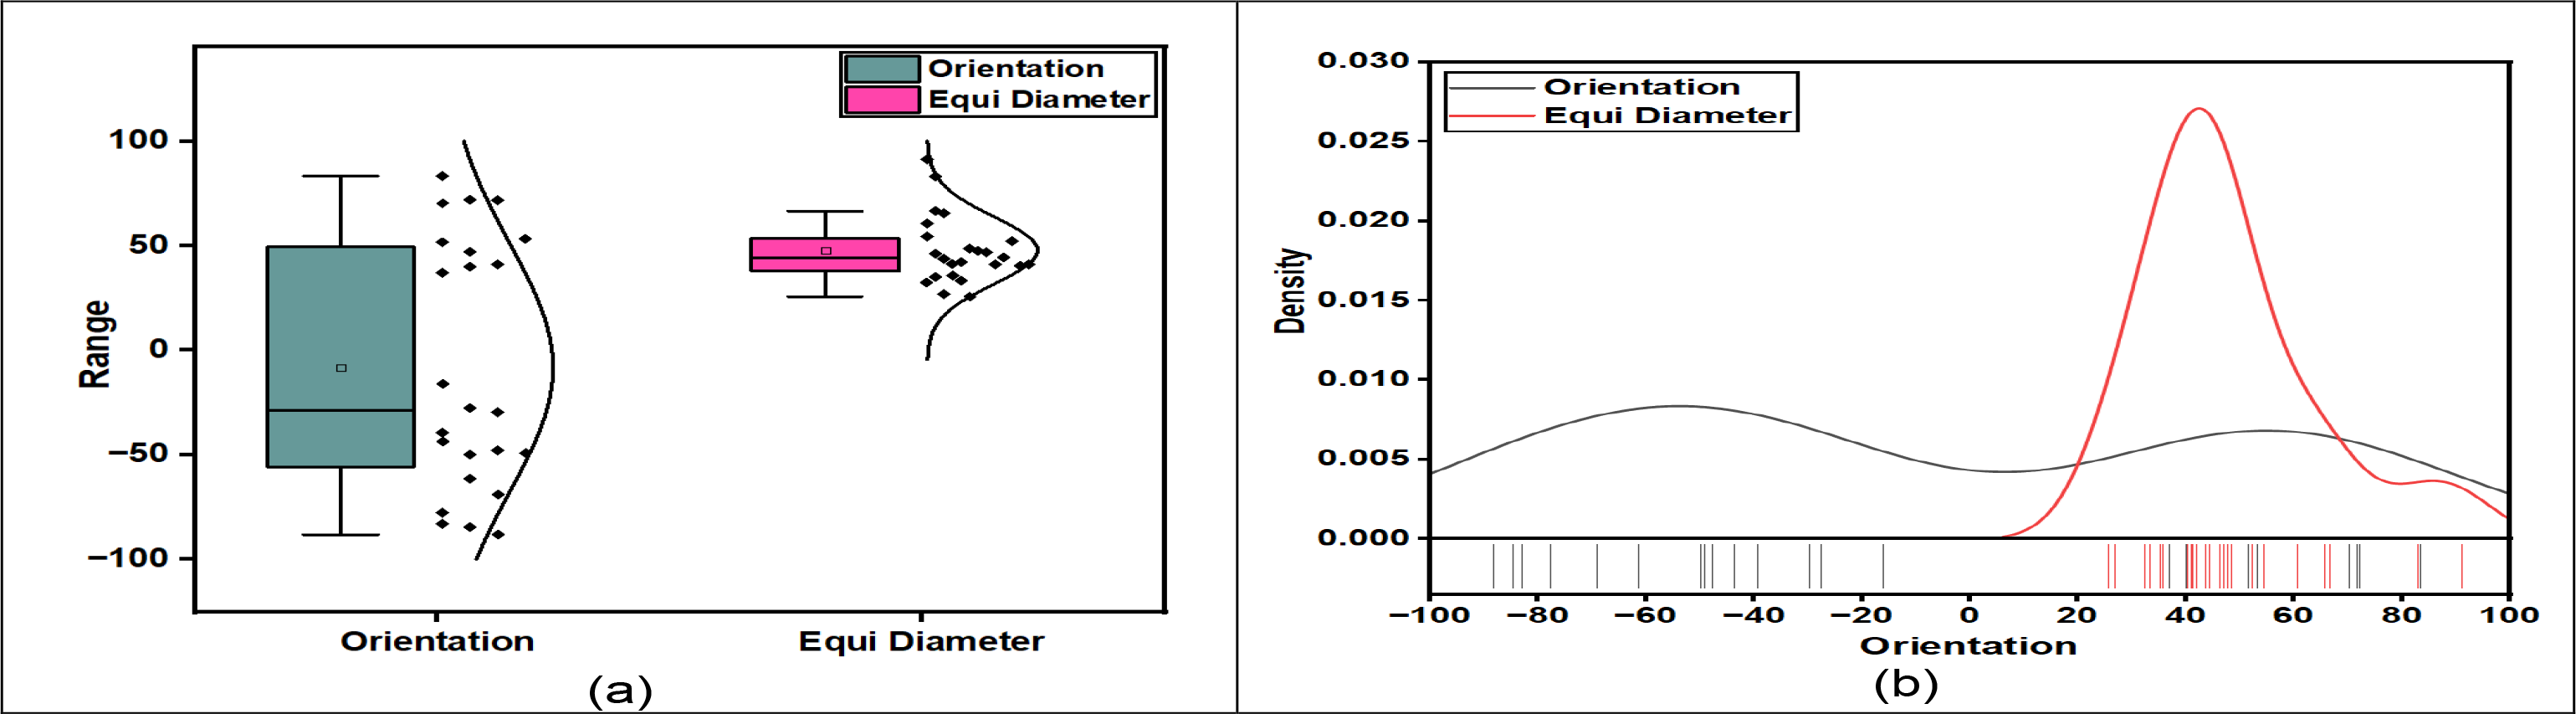
Figures 11 (a) and (b) show the grouped mean bar plot and distribution with Rug for geometric shape metrics Diameter and Perimeter of 30 worm images. From the plot, we infer that the orientation of worms is between -100 to +100 and the diameter of all worms ranges between 20 to 100 scalar values.
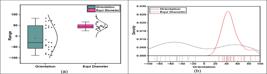
Average orientation and diameter values of 30 worm images a) Scattered plot (mean ± standard deviation) and b) Distribution plot with Rug values
DISCUSSION
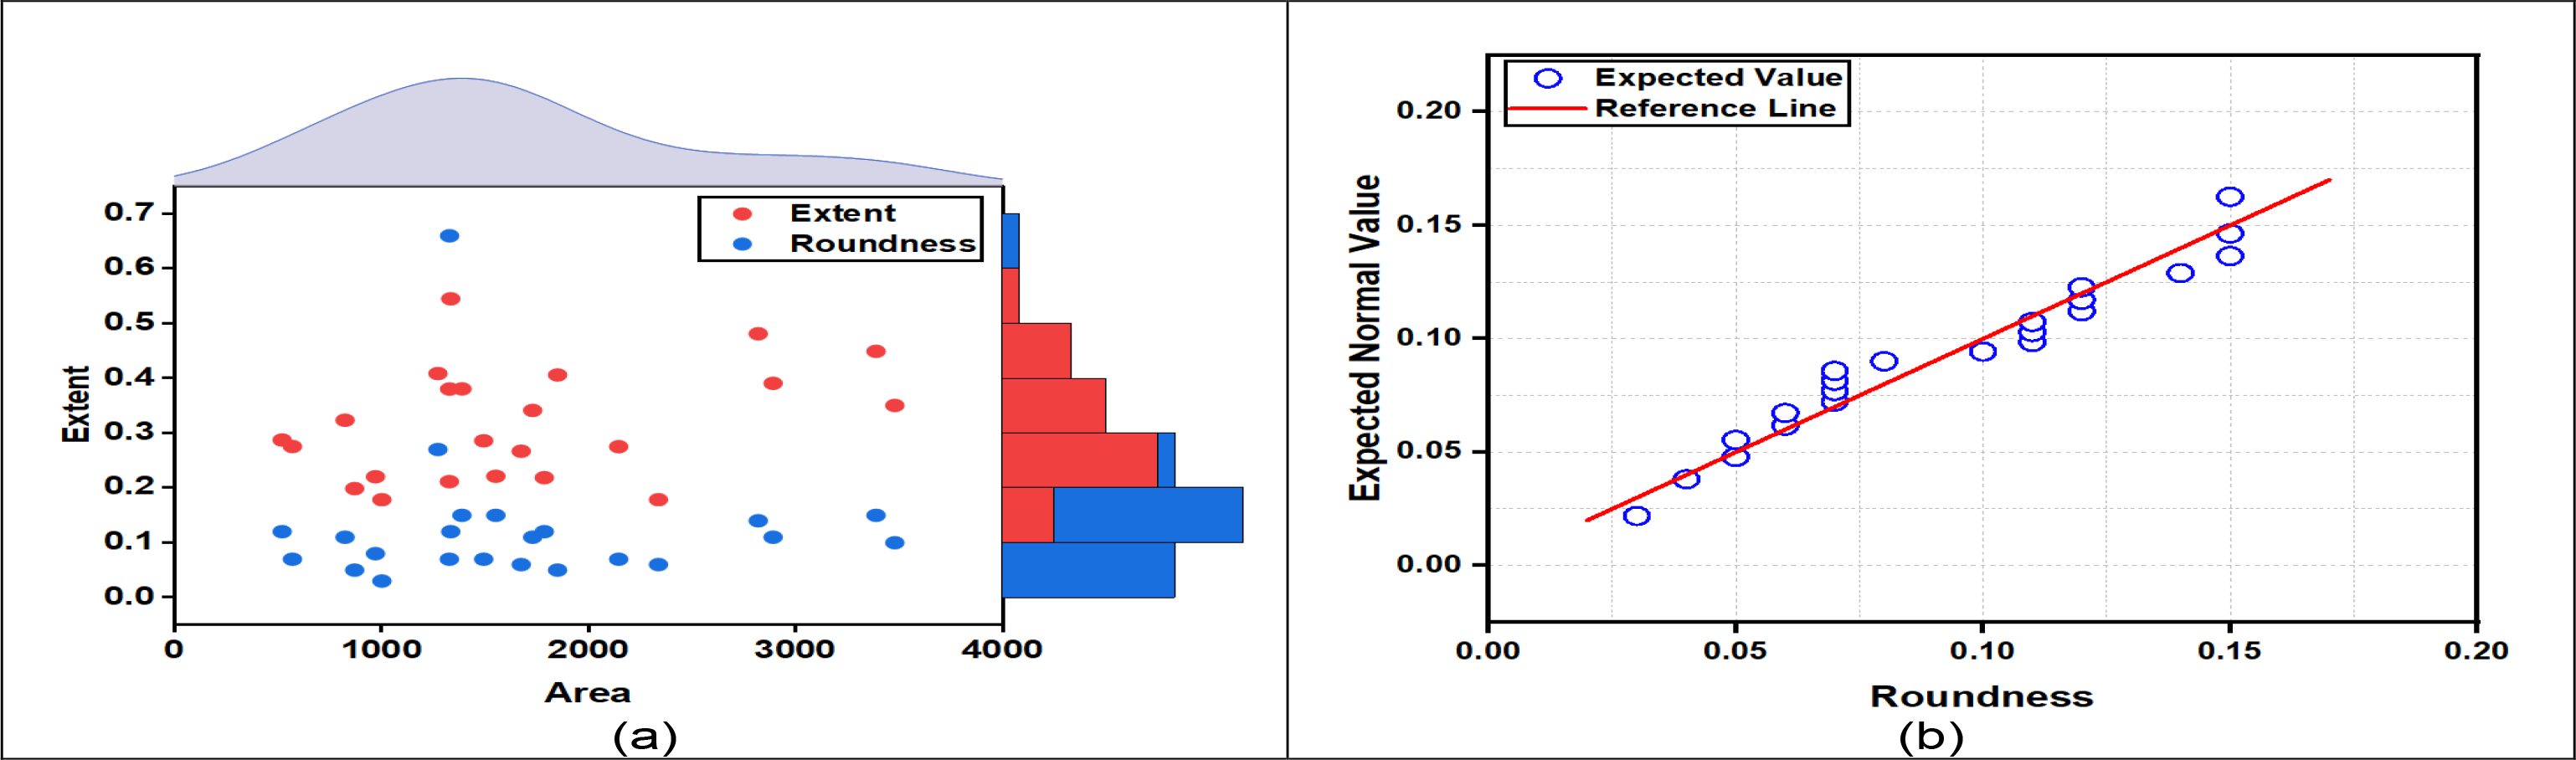
The automated OCR-NURBS image segmentation technique was developed by Kumar P and Babulal KS (2024) [32] for detecting microfilariae in blood smears for the diagnosis of filariasis. The combination of OCR and NURBS segmentation could be computationally intensive and necessitate high-performance hardware. The accuracy of this method depends on the quality of blood smear images. Low-resolution and noisy images reduce the performance of segmentation leading to diagnostic inaccuracies. In the proposed approach, the blood smear images were subjected to various preprocessing techniques to improve the quality by eliminating distortion, blurriness, low resolution, and noise. Figure 12(a) illustrates the marginal scattered plot with a histogram for orientation, diameter, and roundness of 30 worm images with their area. From the figure, the area of most worms is between 2000 to 4000. This shows that worms have an increasing diameter and all worms have extent values less than 0.6 that concludes the worms were neither coiled nor spherical. Figure 12(b) shows that the Q-plot of the calculated roundness value increases and forms a straight line with reference line parameters of the normal value.
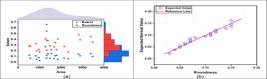
a) Marginal histogram scattered plot for average area values with the extent for thirty roundness worm images and b) Q-plot of Average with expected parameters and reference line of roundness values for thirty worm images.
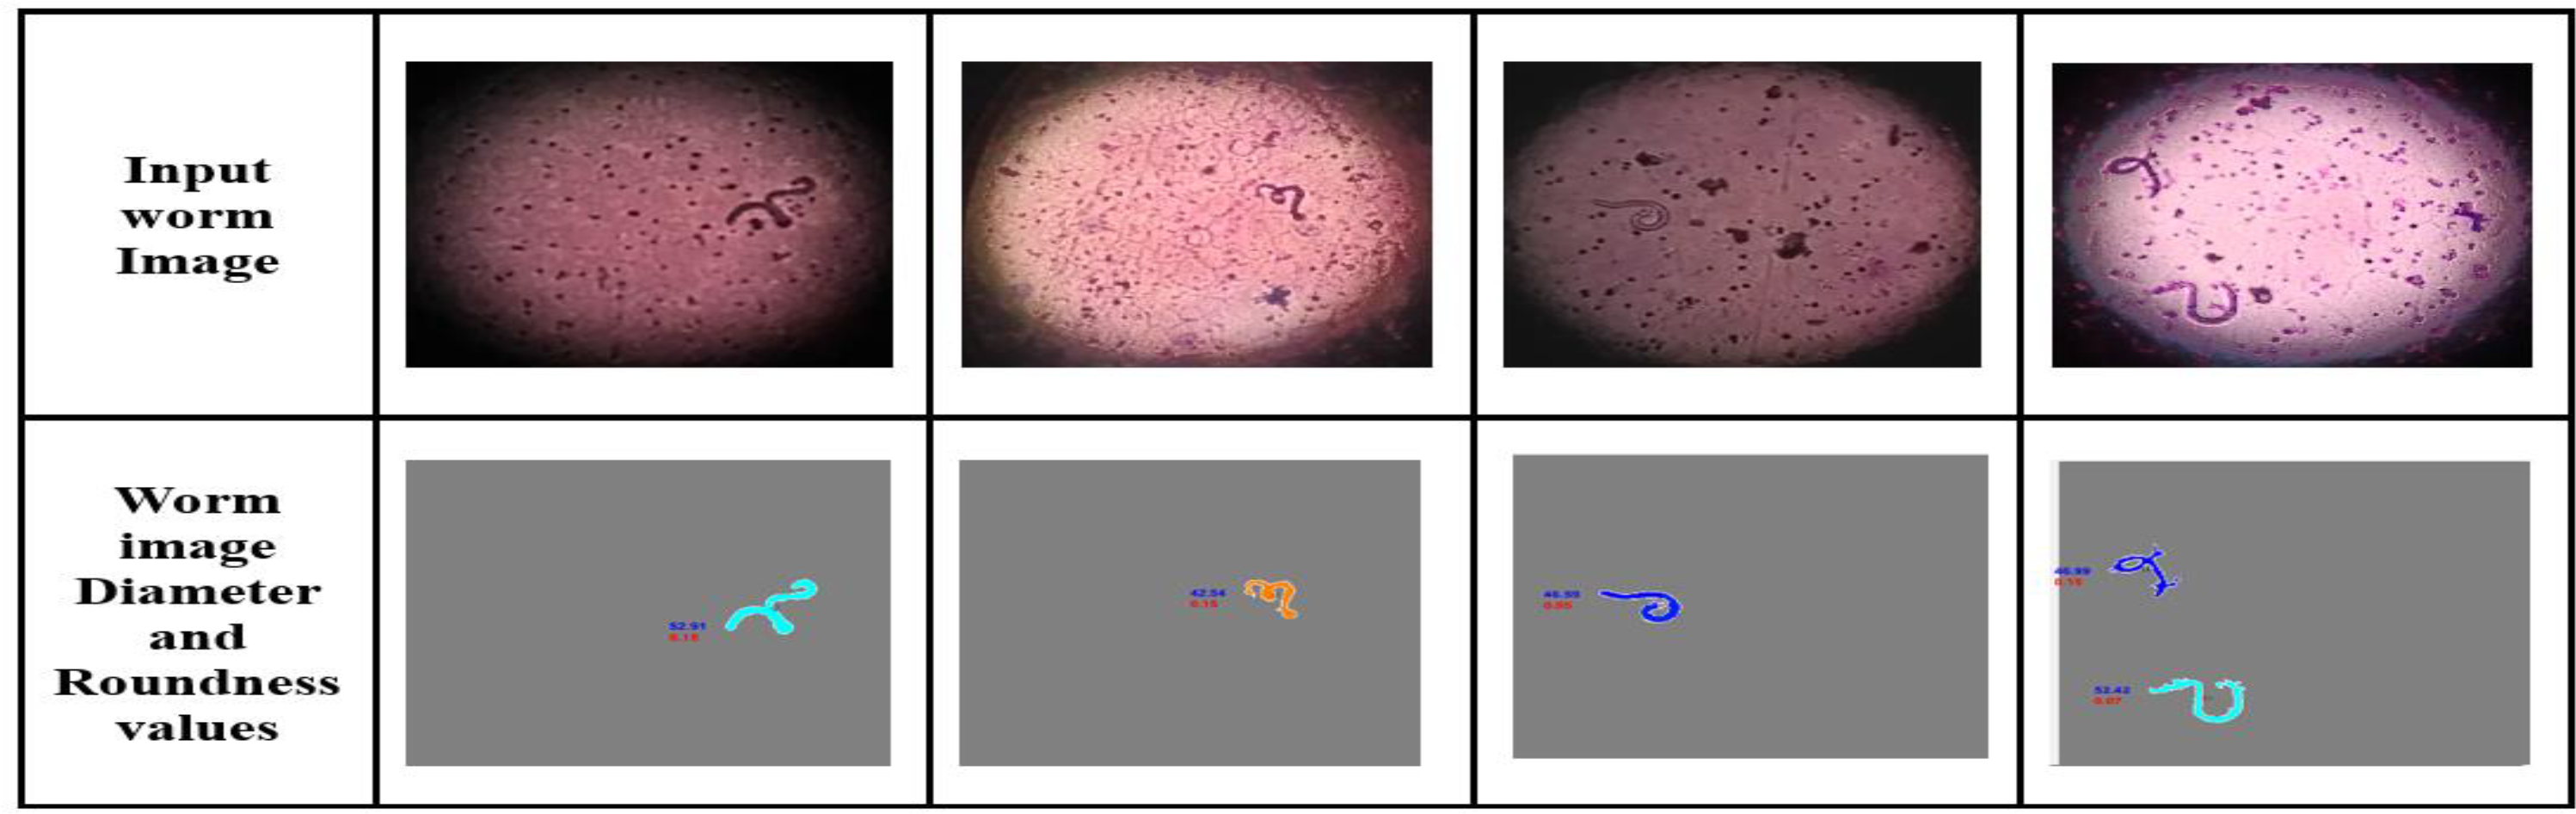
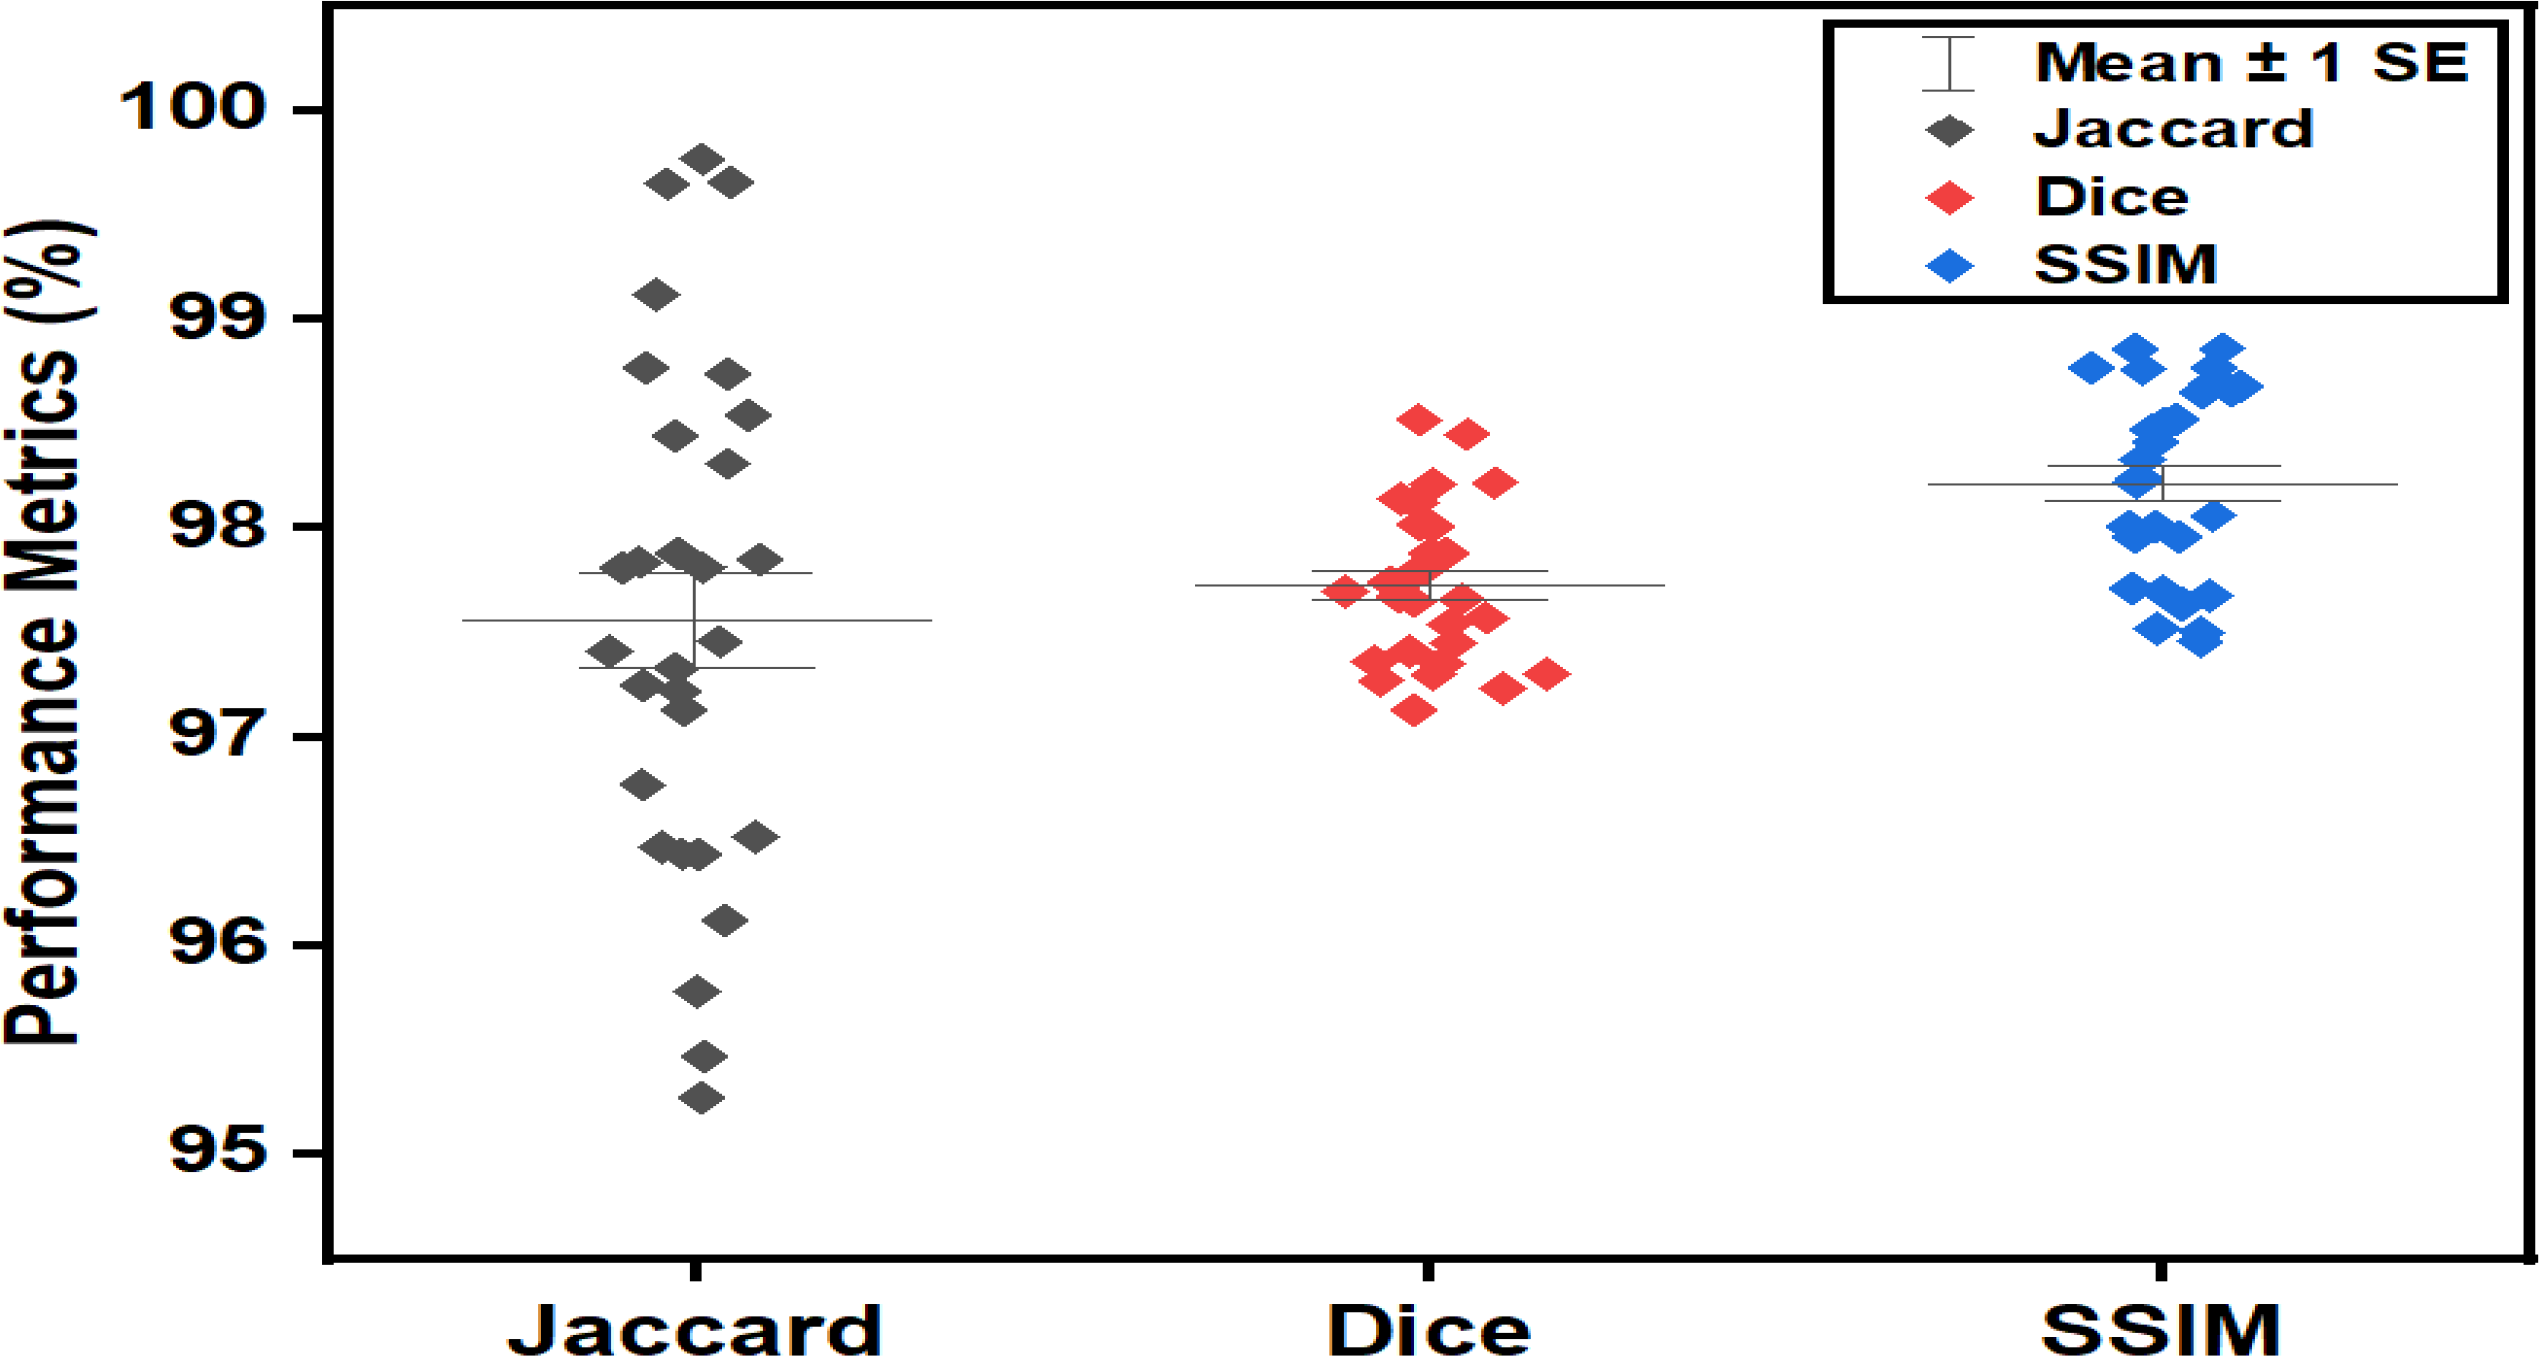
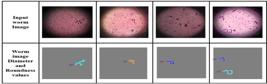
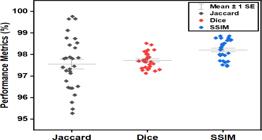
Figure 13 illustrates the worm images with their corresponding diameter and roundness values. Figure 14 depicts the overall morphological method-based segmented worm with ground truth. Figure 15 depicts the scattered distribution plots for 30 filarial images and ground truth after segmentation. The segmented worms achieved Jaccard values between 0.9513 and 0.9978, Dice values from 0.9734 to 0.9856, and SSIM values between 0.9758 and 0.9872. These high ranges of SSIM values indicate that the proposed methodology is effective for segmenting the filarial images using morphological-based segmentation techniques.
CONCLUSION
Filariasis continues to be a serious public health challenge affecting millions of people across various parts of the world, especially in tropical and subtropical regions. WHO emphasized the Vector Control Measures, Mass Drug Administration Programme (MDAP), and Global Programme to Eliminate Lymphatic Filariasis (GPELF) for eliminating filariasis throughout the world. The insufficient thick smear and staining procedures currently available are not robust toward the elimination stage. Using image processing techniques, we developed a computer-aided framework that effectively segments microfilariae in thick blood smear microscopic images. In this work, the thick blood smear images were resized, converted to grayscale, filtered with a 2D Jerman filter, and thresholded with Renyi’s entropy. The preprocessed blood smear images are skeletonized using top-hat transform. Followed by thinning using the snake algorithm with Fourier series. The medial path of the worm is found using the Euclidean distance transform with a Gaussian derivate. Finally, the segmentation of worms using shape rasterization with the ear clipping algorithm attained high similarity with ground truth, with a Dice coefficient of 97.56%, a Jaccard index of 97.11%, and a Structural Similarity Index of 98.21%. The proposed method is more reliable and consistent than the conventional microscopic analysis technique of thick blood smear images for microfilariae identification. Conventional microscopic analysis depends primarily on the professional expertise and sometimes fails to distinguish real microfilarial structures from coiled debris or artifacts. Furthermore, the distinctive qualities of the worm, such as morphological features, texture patterns or shape descriptors cannot be reliably extracted by microscopy. The automated segmentation and geometric feature extraction are clinically significant for the analysis of filarial worms in mass screening of Lymphatic Filariasis.
-
Funding:
This research received no external funding
Acknowledgments:
We acknowledge the services of Mr.S. Anbusivam, Technical Officer (A) for sorting and video imaging the stained blood smears.
Data Availability Statement:
Research data are available upon request from corresponding author.
REFERENCES
-
1 Engels D, Zhou XN. Neglected tropical diseases: an effective global response to local poverty-related disease priorities. Infectious diseases of poverty. 2020 Feb 1;9(01):9-17. https://mednexus.org/doi/full/10.1186/s40249-020-0630-9
» https://mednexus.org/doi/full/10.1186/s40249-020-0630-9 - 2 World Health Organization. Diagnostic test for lymphatic filariasis to support decisions for stopping triple-therapy mass drug administration: target product profile. 2021 [Internet].
-
3 Medeiros ZM, Vieira AV, Xavier AT, Bezerra GS, Lopes MD, Bonfim CV, Aguiar-Santos AM. Lymphatic filariasis: a systematic review on morbidity and its repercussions in countries in the Americas. International journal of environmental research and public health. 2021 Dec 28;19(1):316. https://doi.org/10.3390/ijerph19010316
» https://doi.org/10.3390/ijerph19010316 -
4 Pryce J, Reimer LJ. Evaluating the diagnostic test accuracy of molecular xenomonitoring methods for characterizing community burden of lymphatic filariasis. Clinical Infectious Diseases. 2021 Jun 15;72 (Supplement_3): S203-9. https://doi.org/10.1093/cid/ciab197
» https://doi.org/10.1093/cid/ciab197 -
5 Newman TE, Juergens AL. Filariasis. https://www.ncbi.nlm.nih.gov/sites/books/NBK556012/
» https://www.ncbi.nlm.nih.gov/sites/books/NBK556012/ -
6 Elvana A, Suryanto ED. Lymphatic filariasis detection using image analysis. In Proceedings of the 4th International Conference on Innovation in Education, Science and Culture, ICIESC kumar, 11 October 2022, Medan, Indonesia 2022 Dec 22. http://dx.doi.org/10.4108/eai.11-10-2022.2325548
» http://dx.doi.org/10.4108/eai.11-10-2022.2325548 -
7 Mathison BA, Couturier MR, Pritt BS. Diagnostic identification and differentiation of microfilariae. Journal of clinical microbiology. 2019 Oct;57(10):128-10. https://doi.org/10.1128/jcm.00706-19
» https://doi.org/10.1128/jcm.00706-19 - 8 Dougherty G. Digital image processing for medical applications. Cambridge University Press; 2009.
- 9 Gonzalez RC. Digital image processing. Pearson education India; 2009.
- 10 da Rosa Neves RP. Lymphatic Filariasis Detection in microscopic images [Master's thesis] Universidade do Porto Portugal, 2016.
-
11 Mallawaarachchi S, Premalal GV, Wimalana KW, Liyanage AS, Samarasinghe S, Nanayakkara ND. Detection of microfilariae in peripheral blood smears using image analysis. In2013 IEEE 8th International Conference on Industrial and Information Systems 2013 Dec 17 (pp. 300-303). IEEE. DOI: 10.1109/ICIInfS.2013.6731999
» https://doi.org/10.1109/ICIInfS.2013.6731999 -
12 Al-Tam F, Dos Anjos A, Pion S, Boussinesq M, Shahbazkia HR. Microfilariae classification using multiple classifiers for color and shape features. Open Engineering. 2016 Dec 5;6(1). https://doi.org/10.1515/eng-2016-0079
» https://doi.org/10.1515/eng-2016-0079 -
13 Al-Tam F, dos Anjos A, Shahbazkia HR. Hessian-polar context: a descriptor for microfilaria recognition. Machine Vision and Applications. 2021 Jan;32(1):25. https://doi.org/10.1007/s00138-020-01154-6
» https://doi.org/10.1007/s00138-020-01154-6 -
14 Ding K, Xiao L, Weng G. Active contours driven by local pre-fitting energy for fast image segmentation. Pattern Recognition Letters. 2018 Mar 1;104:29-36. https://doi.org/10.1016/j.patrec.2018.01.019
» https://doi.org/10.1016/j.patrec.2018.01.019 -
15 Olalla GE, Fiorini ER, Romero-Carazas R, Loayza-Enriquez BK. Detection of Elephantiasis patients using Image processing and Classification methods. Journal of Pharmaceutical Negative Results. 2022 Sep 29;13(3):789-95. DOI:10.47750/pnr.2022.13.03.119
» https://doi.org/10.47750/pnr.2022.13.03.119 -
16 Kumar, P., & Babulal, K. S. (2023, July). Automated diagnosis of lymphatic filariasis: a robust approach for microfilariae detection using image processing and stacking classifier. In 2023 14th International Conference on Computing Communication and Networking Technologies (ICCCNT) (pp. 1-6). IEEE.DOI:10.1109/ICCCNT 56998.2023.10307404
» https://doi.org/10.1109/ICCCNT56998.2023.10307404 - 17 Jain AK. Fundamentals of digital image processing. Prentice-Hall, Inc.; 1989 Jan 1.
-
18 Fan J, Zong X, Tang H, Bi X, Xiao B, Li W. HessHist: A Hessian-matrix weighted histogram for image contrast enhancement. IET Image Processing. 2022 May;16(7):1831-45. https://doi.org/10.1049/ipr2.12450
» https://doi.org/10.1049/ipr2.12450 -
19 Karmakar A, Nag R, Pal M, Paul RR, Chatterjee J, Das RK. Measurement of chaos and quantum decoherence in H&E stained images of oral epithelium for early detection Oral Submucous Fibrosis. In2022 IEEE International Conference on Signal Processing, Informatics, Communication and Energy Systems (SPICES) 2022 Mar 10 (Vol. 1, pp. 236-242). IEEE. DOI:10.1109/SPICES52834.2022.9774229.
» https://doi.org/10.1109/SPICES52834.2022.9774229. -
20 Bai X. Image analysis through feature extraction by using top-hat transform-based morphological contrast operator. Applied Optics. 2013 Jun 1;52(16):3777-89. https://doi.org/10.1364/AO.52.003777
» https://doi.org/10.1364/AO.52.003777 -
21 Charmi MA, Derrode S, Ghorbel F. Fourier-based geometric shape prior for snakes. Pattern Recognition Letters. 2008 May 1;29(7):897-904. https://doi.org/10.1016/j.patrec.2008.01.011
» https://doi.org/10.1016/j.patrec.2008.01.011 -
22 Favreau JD, Lafarge F, Bousseau A, Auvolat A. Extracting geometric structures in images with delaunay point processes. IEEE Transactions on Pattern Analysis and Machine Intelligence. 2019 Jan 1;42(4):837-50. DOI:10.1109/TPAMI.2018.2890586
» https://doi.org/10.1109/TPAMI.2018.2890586 -
23 Eder G, Held M, Palfrader P. Parallelized ear clipping for the triangulation and constrained Delaunay triangulation of polygons. Computational Geometry. 2018 Aug 1; 73:15-23. https://doi.org/10.1016/j.comgeo.2018.01.004
» https://doi.org/10.1016/j.comgeo.2018.01.004 -
24 Zhang F, Wu Y, Xu M, Liu S, Peng C, Gao Z. A Morphological Image Segmentation Algorithm for Circular Overlapping Cells. Intelligent Automation & Soft Computing. 2022 Apr 1;32(1). https://doi.org/10.32604/iasc.2022.021929
» https://doi.org/10.32604/iasc.2022.021929 -
25 Lam L, Lee SW, Suen CY. Thinning methodologies-a comprehensive survey. IEEE Transactions on Pattern Analysis & Machine Intelligence. 1992 Sep 1;14(09):869-85. DOI:10.1109/34.161346
» https://doi.org/10.1109/34.161346 -
26 Meijster A, Roerdink JB, Hesselink WH. A general algorithm for computing distance transforms in linear time. Mathematical Morphology and its applications to image and signal processing. 2000:331-40. https://doi.org/10.1007/0-306-47025-X_36
» https://doi.org/10.1007/0-306-47025-X_36 -
27 Ultsch A, Lotsch J. Euclidean distance-optimized data transformation for cluster analysis in biomedical data (EDOtrans). BMC bioinformatics. 2022 Jun 16;23(1):233. https://doi.org/10.1186/s12859-022-04769-w
» https://doi.org/10.1186/s12859-022-04769-w -
28 Mahmoudi R, Akil M. Enhanced computation method of topological smoothing on shared memory parallel machines. EURASIP Journal on Image and Video Processing. 2011 Dec; 2011:1-7. https://doi.org/10.1186/1687-5281-2011-16
» https://doi.org/10.1186/1687-5281-2011-16 -
29 Yang M, Chao H. ECISER: Efficient Clip-art Image Segmentation by Re-rasterization. Computer-Aided Design. 2015 Jan 1; 58:105-16. https://doi.org/10.1016/j.cad.2014.08.011
» https://doi.org/10.1016/j.cad.2014.08.011 - 30 Eberly D. Triangulation by ear clipping. Geometric Tools. 2008 Mar:2002-5.
-
31 Eder G, Held M, Palfrader P. Parallelized ear clipping for the triangulation and constrained Delaunay triangulation of polygons. Computational Geometry. 2018 Aug 1; 73:15-23.https://doi.org/10.1016/j.comgeo.2018.01.004
» https://doi.org/10.1016/j.comgeo.2018.01.004 -
32 Kumar P, Babulal KS. Automated detection of microfilariae parasite in blood smear using OCR-NURBS image segmentation. Multimedia Tools and Applications. 2024 Jul;83(23):63571-91. https://link.springer.com/article/10.1007/s11042-023-17958-3
» https://link.springer.com/article/10.1007/s11042-023-17958-3
-
Editor-in-Chief:
Paulo Vitor Farago
-
Associate Editor:
Paulo Vitor Farago